1
TOBIN’S Q ANALYSIS AS AN INDICATOR
USED IN
MEASURING AND ANALYZING BANKING INDUSTRY OF
COMPANIES LISTED IN KOMPAS100 PERIOD
2010-2014
Francis M. Hutabarat
1and Vianny Felicia Senjaya
21
Francis M. Hutabarat, MBA, Ph.D is a lecturer in Fakultas Ekonomi at Universitas Advent
Indonesia. Email: [email protected] 2
Vianny Felicia Senjaya is a student at Fakultas Ekonomi at
Universitas Advent Indonesia. Email: [email protected]
Abstract
In globalization era, business world continues to develop in accordance to the demands of changing times. Capacity of the company to compete in the market will determine the performance of the company itself. The value of the company reflects abstraction and performance of the company. If the company is certainly well worth, it is going to influence investors to invest in the company. The objective of this research is to analyzed the data given from companies listed in the Bank Sector at Kompas 100 using method of Tobin’s Q. This study aims to determine whether the value assigned by the market based on the number of sales of shares in the year multiplied by the share price at the end of last year that sought to be greater than the total of all assets of the company during the year. Results and conclusions showed there are three companies in the undervalued categories namely BBNI, BBRI, BDMN, PNBN, BMRI, BJTM, BJBR, BBCA, BBKP in year 2010-2014, a company namely BBTN company touched the position of overvalued company at the year of 2011.
Keywords: Tobin’s Q Method, Bankruptcy, Indonesian Stock Exchange,
I.
Introduction
In globalization era, business world continues to develop in accordance to the demands of changing times.Capacity of the company to compete in the market will determine the performance of the company itself. According to Weston and Copeland (1997), they defines the value of the company is to maximize the value of the mean considering the effect of time on the value of money, the funds will be received this year higher value of the funds will be received in the coming year and the mean is also considering various risks to the company's revenue stream. Meanwhile, according to Suad (2005) value of the company is willing to pay the price a prospective buyer if the company is sold. From the above it can be seen that the value of the company
reflects abstraction and performance of the company. In other words, if the company is certainly well worth, it is going to influence investors to invest in the company.
The indicators used as a measurement variable must be tested first fatherly determine its accuracy. Tobin's Q as one indicator variable measuring the performance of the company from an investment perspective has been tested in a variety of situations to top management. James Tobin, a professor at Yale University, hypothesized that the overall value of the market for all companies on the stock market price will be similar to the cost of the asset placement. Tobin's Q value is generated from the total market value of shares (market value of all outstanding stock) as compared with the rest of the assets owned by the company and the results shows the potential market value of a company. Companies selected are companies included in the
465
KOMPAS100 index is equal to the LQ45, which is linked to the issue of liquidity of the stock. In this case used as the basis for calculation of the index is 100 active stocks. Yet more emphasis samples used in nine companies that were in the banking sector at the KOMPAS100.
This study aims to determine whether the value assigned by the market based on the number of sales of shares in the year multiplied by the share price at the end of last year that sought to be greater than the total of all assets of the company during the year. After that, researchers will compare the results obtained Q ratio of companies each year from 2010 to 2014. That's one way to measure the performance of the company based on the ratio of the market value and the value of assets.
II. REVIEW OF RELATED LITERATURE
Management need to assess the financial condition of his or her company. These needs not just come as a job description, but also an obligation of any worker of a company. By doing that the company can gauge and therefore gain interest of investor and other financial parties with an interest in relation to the company's financial condition. By knowing the financial condition of the company, a rational decision can be made with the help of certain analytical tools. Financial analysis can be done either by an external company such as creditors, investors, and the company's own internal (Sawir, 2003, Fahmi, 2014). Analyze financial performance is by evaluating past performance, then predict the company's future prospects, and then re-evaluate what has happened in the past in order to improve the company's financial performance in the future (Fahmi, 2014). Moreover, Fahmi (2014) suggest that there are five stages in analyzing the financial performance of a company in general, namely: 1. Conduct a review of financial statement data, 2. Perform calculations, 3. Perform a comparison of the results that have been obtained count, 4. interpretation (interpretation) of the various problems found, and 5. Search for and provide solutions (solution) to various problems found. (pp. 239-241). There are various media that can used gauge a
company’s health, namely: financial statements,
that consists of, balance sheet, profit and loss, an overview of retained earnings, and statement of financial position. A financial statements portray the financial condition and results of operations of the actual financial analysis. Meanwhile, from the standpoint of management, financial statement analysis is useful to help anticipate future conditions, which is even more important as a starting point for planning actions that will improve performance in the future. In a financial statement, every company can used gauge its condition through different tools, and one of them is by using financial ratio analysis. Financial ratios are designed to assist us in evaluating the financial statements as a measurement tool in assessing the company's financial condition and performance (Hery, 2015; Horne, 2009) (2004) suggest that financial difficulties or financial distress faced by the firm can vary between liquidity problems, in which the company is unable to meet financial obligations while, until trouble solvency (bankruptcy), where the company's financial liabilities had exceeded his fortune. And this can affect the mind of the investor. Another method in the financial ratios analysis that can be
used is the method of Tobins’Q. Tobin's Q is an
indicator to measure the company's performance, especially on the value of companies that demonstrate a Performance management in managing the assets of the company. Tobin's Q value describes a state-owned enterprise investment opportunities (Lang, et al 1989) or the company's growth potential (Tobin & Brainard, 1968; Tobin, 1969). Tobin’s Q is used in researches,
in comparing the Tobins’Q method and other
466
Puspitasari), company’s performance indicator
(Wolfe and Sauaia, 2003), and Valuing small capitalization companies (Fiakas, 2005).
III.
M
ETHOD OF THE STUDY
The method used in this study is descriptive, and the data collected was analyzed and presented in a descriptive manner. The data were derived from end of the year stock price, total of outstanding share, total asset from the company and KOMPAS100 Index data. The sample used in the study are 9 companies that are listed as companies listed in KOMPAS100 Index at Indonesia Stock Exchange in year 2010-2014. The sample obtained from the active bank companies traded during the observation period of month January to December in the year 2010-2014. Variables are identified among other things, the market value listed, the total asset, and the Q ratio used for intrepertation. Analysis of the data used with the help of Microsoft Office Excel 2013. The stages in the data analysis are as follows: 1. Calculate the market value on individual stocks (MV) each year,
2. Calculate the total asset 3. Calculate the Q ratio
Q ratio is a measure of a parallel connection of an market value with a whole asset in the company.When the value 0 – 1 : When the Tobin's Q ratio is between 0 and 1, it costs more to replace a firm's assets than the firm is worth When Q > 1: A Tobin's Q above 1 means that the firm is worth more than the cost of its assets. Because Tobin's premise is that firms should be worth what their assets are worth, anything above theoretically indicates that a company is overvalued.
IV.
RESULTS AND DISCUSSION
MARKET VALUE (MV)
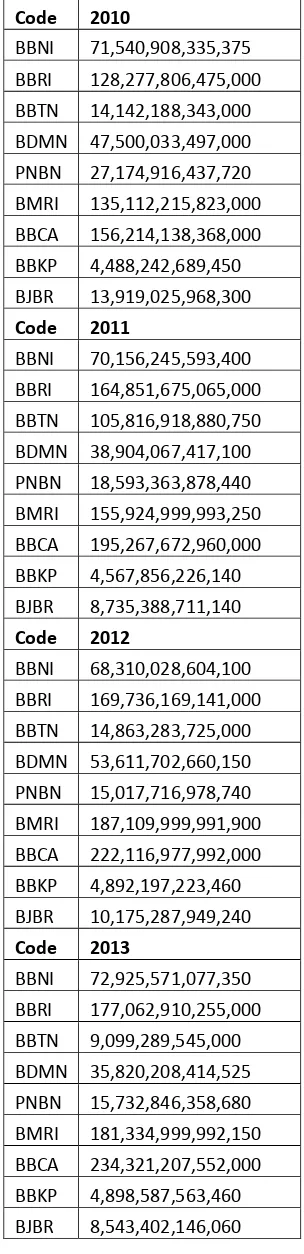
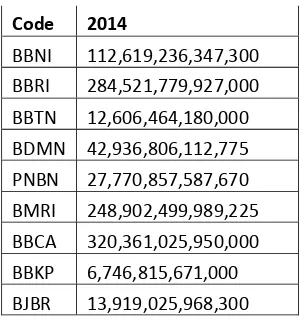
Market value is the price an asset would fetch in the marketplace. Market value is also commonly used to refer to the market capitalization of a publicly-traded company, and is obtained by multiplying the number of its outstanding shares by the current share price. At the year 2010-2014, the market value of the companies in this study are as follows:
Table 1. Market Value
Code 2010
BBNI 71,540,908,335,375
BBRI 128,277,806,475,000
BBTN 14,142,188,343,000
BDMN 47,500,033,497,000
PNBN 27,174,916,437,720
BMRI 135,112,215,823,000
BBCA 156,214,138,368,000
BBKP 4,488,242,689,450
BJBR 13,919,025,968,300
Code 2011
BBNI 70,156,245,593,400
BBRI 164,851,675,065,000
BBTN 105,816,918,880,750
BDMN 38,904,067,417,100
PNBN 18,593,363,878,440
BMRI 155,924,999,993,250
BBCA 195,267,672,960,000
BBKP 4,567,856,226,140
BJBR 8,735,388,711,140
Code 2012
BBNI 68,310,028,604,100
BBRI 169,736,169,141,000
BBTN 14,863,283,725,000
BDMN 53,611,702,660,150
PNBN 15,017,716,978,740
BMRI 187,109,999,991,900
BBCA 222,116,977,992,000
BBKP 4,892,197,223,460
BJBR 10,175,287,949,240
Code 2013
BBNI 72,925,571,077,350
BBRI 177,062,910,255,000
BBTN 9,099,289,545,000
BDMN 35,820,208,414,525
PNBN 15,732,846,358,680
BMRI 181,334,999,992,150
BBCA 234,321,207,552,000
BBKP 4,898,587,563,460
467 Code 2014
BBNI 112,619,236,347,300
BBRI 284,521,779,927,000
BBTN 12,606,464,180,000
BDMN 42,936,806,112,775
PNBN 27,770,857,587,670
BMRI 248,902,499,989,225
BBCA 320,361,025,950,000
BBKP 6,746,815,671,000
BJBR 13,919,025,968,300
Table 1 shows 9 companies observed that were listed in KOMPAS100 Index at Indonesia Stock Exchange at the end of year 2010-2014.
TOTAL ASSET (TA)
Total assets are the sum of all current and noncurrent assets that a company owns. They are reported on the company balance sheet. The total asset figure is based on the purchase price of the listed assets, and not the fair market value. Table 2 shows the total asset each year, it shows
for year 2010-2014.
Tabel 2. Total Asset (TA)
Code
2010
BBNI
248,580,529,000,000
BBRI
404,285,602,000,000
BBTN
68,385,539,000,000
BDMN 118,206,573,000,000
PNBN
108,947,955,000,000
BMRI
449,774,551,000,000
BBCA
324,419,069,000,000
BBKP
47,489,366,000,000
BJBR
43,445,700,000,000
Code
2011
BBNI
299,058,161,000,000
BBRI
626,182,926,000,000
BBTN
89,121,459,000,000
BDMN 142,292,206,000,000
PNBN
124,755,428,000,000
BMRI
551,891,704,000,000
BBCA
381,908,353,000,000
BBKP
57,183,463,000,000
BJBR
54,448,658,000,000
Code
2012
BBNI
333,303,506,000,000
BBRI
801,955,021,000,000
BBTN
111,784,593,000,000
BDMN 155,791,308,000,000
PNBN
148,792,615,000,000
BMRI
635,618,708,000,000
BBCA
442,994,197,000,000
BBKP
65,689,830,000,000
BJBR
70,840,878,000,000
Code
2013
BBNI
386,654,815,000,000
BBRI
469,899,284,000,000
BBTN
131,169,730,000,000
BDMN 184,237,348,000,000
PNBN
164,055,578,000,000
BMRI
733,099,762,000,000
BBCA
496,304,573,000,000
BBKP
69,457,663,000,000
BJBR
70,958,233,000,000
Code
2014
BBNI
416,573,708,000,000
BBRI
551,336,790,000,000
BBTN
144,575,961,000,000
BDMN 195,708,593,000,000
PNBN
172,581,667,000,000
BMRI
855,039,673,000,000
BBCA
552,423,892,000,000
BBKP
79,051,268,000,000
BJBR
75,836,537,000,000
TOBIN’S Q RATIO ANALYSIS (Q
)
468
reproduction cost: the price in the market for the newly produced commodities. The ratio can useful as the nexus between financial markets and markets for goods and services. Q in this study using market value and total asset calculation derived from KOMPAS100 index.
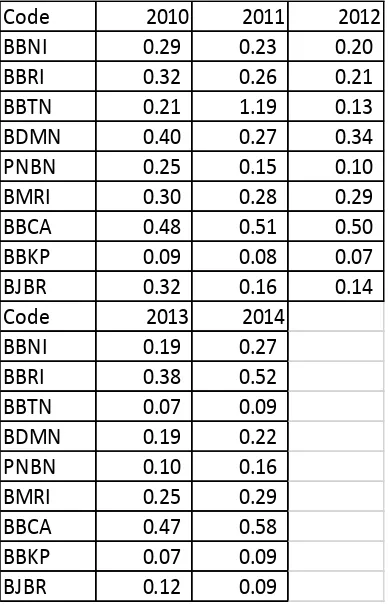
Table 4: Q Ratio Analysis
Based on the table above, the results shows the companies that have undervalued of market value shows in their Q 0 - 1, such as BBNI (0,29; 0,23; 0,20; 0,19; 0,27), BBRI (0,32; 0,26; 0,21; 0,38; 052), BBTN (0,21; 0,13; 0,07, 0,09), BDMN (0,40; 0,27; 0,34; 0,19; 0,22), PNBN (0,25; 0,15; 0,10; 0,10; 0,16), BMRI (0,30; 0,28; 0,29; 0,25; 0,29), BBCA (0,48; 0,51; 0,50; 0,47; 0,58), BBKP (0,09; 0,08; 0,07; 0,07; 0,09), BJBR (0,32; 0,16; 0,14; 0,12; 0,09). Q that is undervalued shows that it costs more to replace a firm's assets than the firm is worth. On the other hand, the results also show companies that have overvalued type of company as shown in their Q > 1, such as:
BBTN (1,19) at the year of 2011. Q that is overvalued shows that the firm is worth more than
the cost of its assets.
V. Conclusion
Based on the results of the study and after measuring and analyzing the KOMPAS100 bank of companies listed in the Indonesian Stock Exchange using Tobin’Q ratio analysis, the Q ratio shows that companies that is undervalued tend to a lot more
valued than the fim’s asset. It means that the firms
asset is less valued than what the market valued the company, such as BBNI, BBRI, BBTN, BDMN, PNBN, BMRI, BBCA, BBKP, BJBR from the year 2010-2014. And companies with overvalued type of market value tend to have more value from the asset than what the market value shows from the
outstanding share with the closing price., like BBTN at the year of 2011. It is recommended for further research to look on other method or perspective such as S-score and Z score in analyzing these data.
References
Anoraga, P., and P.
Pakarti. (2003). Pengantar Pasar Modal. Jakarta: Rineka Cipta.
Brainard, W., and J. Tobin. (1968). Pittfalls in Financial Model Building. American Economic Review, Vol. 58(2), pp. 99-122.
Fiakas, D. (2005). Tobins’q: Valuing Small
Capitalization Companies. Crystal Equity Research, April 2005.
Nasarudin, M. I., and
I. Surya. (2004). Aspek Hukum Pasar Modal Indonesia. Jakarta: Prenada Media.
Siamat, D. (2004). Manajemen Lembaga Keuangan. Edisi Keempat. Jakarta:
Lembaga Penerbit Fakultas Ekonomi Universitas Indonesia.
Tandelilin, E. (2010). Portofolio dan Investasi: Teori dan Aplikasi. Yogyakarta: Kanisius.
Code 2010 2011 2012
BBNI 0.29 0.23 0.20 BBRI 0.32 0.26 0.21 BBTN 0.21 1.19 0.13 BDMN 0.40 0.27 0.34 PNBN 0.25 0.15 0.10 BMRI 0.30 0.28 0.29 BBCA 0.48 0.51 0.50 BBKP 0.09 0.08 0.07 BJBR 0.32 0.16 0.14
Code 2013 2014
469
Brigham, E. F. dan Houston, J. F (2010). Dasar-Dasar Manajemen Keuangan. Jakarta: Salemba Empat.
Fahmi, I. (2014). Analisis Kinerja Keuangan. Bandung: Penerbit Alfabeta.
Fahmi, I. (2014). Analisis Laporan Keuangan. Bandung: Penerbit Alfabeta.
Harahap, S.S. (2015). Analisa Kritis atas Laporan Keuangan. Jakarta: PT. RajaGrafindo Persada.
Hery. (2015) Analisis Laporan Keuangan. Jakarta: CAPS (Center for Academic Publishing Service)
Kartikahadi, H; Sinaga, R.U;Syamsul,M. dan Siregar, S.V. (2012). Akuntansi Keuangan berdasarkan SAK berbasis IFRS.Buku 1. Jakarta Selatan: Salemba Empat.
Sawir, A. (2003). Analisis Kinerja Keuangan dan Perencanaan Keuangan Perusahaan. Jakarta: PT Gramedia Pustaka Utama.
Sawir, A. (2004). Kebijakan Pendanaan dan Restrukturisasi Perusahaan. Jakarta: PT. Gramedia Pustaka Utama.
Suad, H. (2005). Dasar-Dasar Teori Portofolio dan Analisis Sekuritas. Yogyakarta: BPFE.
Sudiyatno, B., and E. Puspitasari. (2010).
Tobins’Q dan Altman Z-Score Sebagai
Sebagai Indikator Pengukuran Kinerja Perusahaan. Kajian Akuntansi, Vol. 2 No. 1, Februari 2010, pp. 9-21.
Tobin, J. (1969). A General Equilibrium Approach to Monetary Theory. Journal of Money, Credit and Banking (February), pp. 12-29.
Weston, J. F., and T. E. Copeland. (1997).
Manajemen Keuangan. Jakarta: Binarupa Aksara.
Wolfe, J., and A. C. Sauaia. (2003). The Tobin q as a Company Performance Indcator.