Paleo-coastline of the Central Eastern Adriatic Sea,
and Paleo-Channels of the Cetina and Neretva rivers during
the last glacial maximum
Marjan SIKORA
1*, Hrvoje MIHANOVIĆ
2, Ivica VILIBIĆ
31Faculty of Electrical Engineering, Mechanical Engineering and Naval Architecture,
University of Split, Croatia
2 Hydrographic Institute of the Republic of Croatia, Split, Croatia 3 Institute of Oceanography and Fisheries, Split, Croatia
*Corresponding author, e-mail: sikora@fesb.hr
The paper documents the use of a Digital Elevation Model (DEM) method to reconstruct paleo-channels and the paleo-coastline during the Last Glacial Maximum (LGM) in the Central Eastern Adriatic area. We focused on the paleo-coastline and paleo-channels of the Neretva and the Cetina rivers, which were estimated from the 15’’ bathymetry available for the Adriatic Sea. While being aware of the limitations of the method and the resolution of the bathymetry grid, we successfully reproduced the paleo-channels of both rivers. Results for the Cetina River indicate the presence of depressions that were filled with water along its flow. The configurations of existing seabeds in the vicinity of the Cetina and Neretva River mouths indicate morphologies, similar to river mouths. The vertical profiles suggest that during the LGM the sea level was about 115 m lower than today. The total length of the Neretva riverbed was longer for about 136 km than today, and the Cetina River was approximately 154 km longer.
Key words: paleo-coastline, paleo-riverbed, the Adriatic Sea, LGM, DEM, river network computation
INTRoDuCTIoN
The last glacial maximum (LGM) happened from 26500 to 20000 years ago (cLARK, 2009; WOODWARD, 2009). It’s most prominent
charac-teristic was that the sea level was significantly lower than today. Different authors claim differ-ent sea levels (cLARK, 2009; LAMBEcK & BARD, 2000; PELTIER et al., 2006; RABINEAU et al., 2006; WOODWARD, 2009), with sea level as low as -135
m relative to the present sea level. The majority of authors conclude that that the LGM sea level
in the Mediterranean was 120±5 m lower than the present one. This conclusion was achieved using geomorphological, biostratigraphical and radiographical methods. Similar methods were used to derive local LGM sea level for the Adri-atic Sea (LAMBEcK & BARD, 2000; SURIĆ et al., 2005). The local research confirmed the global
LGM sea level, but some differences may arise because of the local tectonic activity (DI DONATO
et al., 1999; LAMBEcK & PURcELL, 2005).
Given that during the LGM the sea level was lower than today, the paleo-coastal line
gener-ally differed from the present one, including an extended course of rivers till their reach of the paleo-coastline. Some paleo-riverbeds in central Eastern Adriatic, such as the river Krka paleo-riverbed, are pronounced and deep. On the contrary, other paleo-riverbeds are not recogniz-able as they have flowed in flat paleo-valleys, or have brought lot of sediments, thus filling their paleo-canyons. Therefore, various methods have been used to detect the exact position of paleo-riverbeds, of which Digital Elevation Models (DEM) were widely utilized. DEM is applied in science and research community for various pur-poses, such as mapping contemporary magnetic mineral concentrations in peat soils (ROTHWELL & LINDSAY, 2007), glaciology (RAcOVITEANU et al., 2007), regional soil mapping (DOBOS et al., 2000), volcanic topographic mapping (STEVENS
et al., 2004) and others. A typical application of
the DEM is in hydrology, for the automatic generation of river networks (BIRKINSHAW, 2010, JENSON, 1988). Both Triangulated Irregular
Net-works (TIN) and grid DEMs can be used for this purpose. Most authors use grid DEMs, although there are some benefits of using TIN, such as its adaptive resolution (MAREcHAL et al., 2010).
Still, grid DEMs are widely applied because of their simplicity and the ease of computer imple-mentation.
This paper attempts to reconstruct paleo-riv-erbeds and paleo-river mouths of the cetina and Neretva Rivers, as well as the paleo-coastline, by applying DEM method on the bathymetry available for the central Eastern Adriatic area. This research is important for better understand-ing of the influence that the vicinity of the sea and rivers had on people that lived in this area during the LGM. The location of human settle-ments and eventual sea transport routes from the time of the LGM (FORENBAHER 1999, STRASSER
et al. 2010), have lacked the wider insight that our
research tries to bring.
The second section of the paper describes models and methods used in this work, as well as their limitations. The third section presents results of the computer method, while the last section brings discussion and conclusions, as well as introducing possibilities for the future research.
MoDElS AND METhoDS
Input dataThis paper analyses the central part of the eastern coast of the Adriatic Sea (Fig. 1, see inset in the upper right corner). Numerous islands are situated in this part of Adriatic, and the largest one is Brač (395 km2). The largest
rivers in this part of Adriatic are the cetina and Neretva Rivers. Today, the river cetina has length of about 104 km and mean discharge around 100 m3/s. The cetina river is a typical
karst river that flows on the karstified terrain and carries predominantly dissolved matter. It is relatively short and the altitude of its source is low. The Neretva River is approximately 215 km long. Its average inflow to the Adriatic Sea is 300 m3/s. The Neretva river is so called
allogenic river on the karst terrain, it is long and its source has relatively high altitude. It flows through clastic deposits and carries sub-stantial amount of clastic, suspended particles (especially before the dams were built). Due to differences between cetina and Neretva rivers, river mouths of cetina and Neretva differ a lot, and it is to be expected that the same situation has been in the past.
The input data for our model were the bathymetric data for the Adriatic Sea available through a public website (SIGNELL, 2006). These
data were introduced to a digital elevation model (DEM) of the seafloor, with 15 seconds resolu-tion in latitude and longitude. Fig. 1 presents the contour plot of the input data for the Adriatic Sea, including the analyzed area.
The bathymetric data were used to produce the position of paleo-riverbeds of the cetina and Neretva Rivers during the LGM, as well as their paleo-river mouths. The next part of this section explains the method used to calculate these two outputs.
The method
The LGM paleo-riverbeds of the cetina and Neretva Rivers were firstly determined through three phases, using the most common
single-direction method - the D8 algorithm (MAREcHAL et al., 2010; NARDI et al., 2011; WU et al., 2008): (1) the removal of pits from the DEM,
(2) the generation of flow directions for each grid element, and (3) the use of flow directions to generate the river network. In addition, we added the fourth phase in order to account for eventual depressions which may be present in a karstic area. Therefore, the phases used in this paper are:
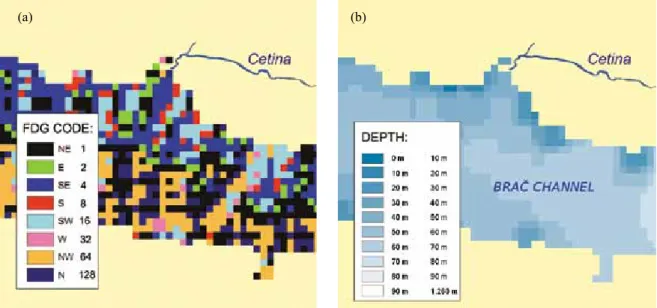
a) Filling depressions in DEM - This phase ensures that small depressions, which exist due to processing errors, don’t influence the calculation of the river DEM network. b) calculating Flow Directions Grid (FDG)
from the DEM - This is done by using the procedure presented by GREENLEE (1987) and JENSON & DOMINGUE (1988). The flow
direc-tion of each DEM element is the direcdirec-tion in which the water would flow out from that element. This direction is determined by the orientation of the element, and each element is coded according to the Table 1. The code entered into the element contains the infor-mation into which one of eight surrounding elements water will flow out of the element. The flow direction encoding is done by using powers of two, to ensure that surround-ing conditions correspond to unique values when the powers of two are summed for any unique set of neighbors.
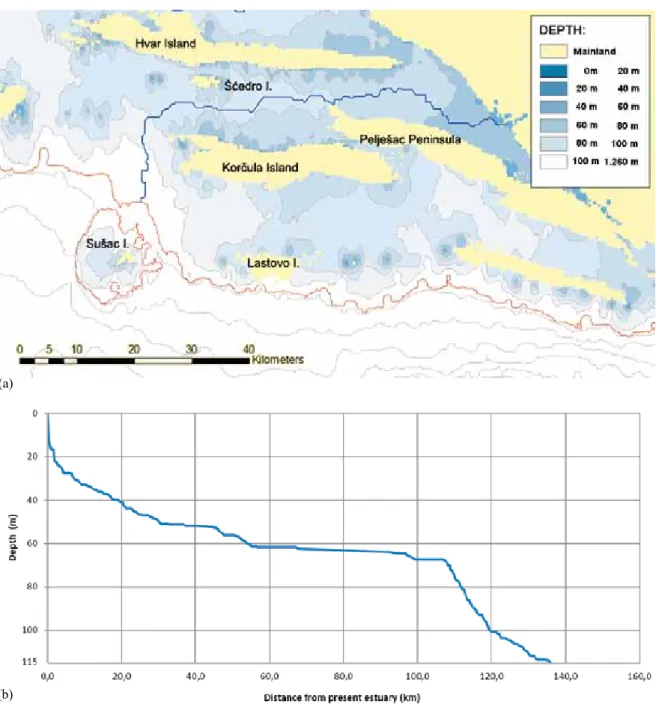
Fig. 1. DEM of the Adriatic Sea, with a close-up of the area analyzed in this paper in the upper right corner, and the orientation map in the lower left corner
Table 1. Flow direction codes
64 (NW) 128 (N) 1 (NE)
32 (W) x 2 (E)
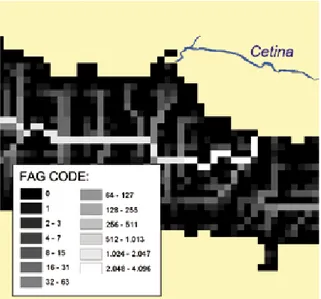
c) calculating Flow Accumulation Grid (FAG) from the FDG - The third step of the method is the creation of the FAG. The FAG is cre-ated using the procedure described by JEN-SON % DOMINGUE (1988) and MONTGOMERY (1993). Every cell of the DEM is filled with
the cumulative number of cells that flow into it. The cells which flow into the target cells are identified using the FDG. The resulting FAG is the table where main water flows are depicted with cells having values higher than some threshold. An example is shown in Table 2, where elements with FAG value higher than 10 are bolded and one can clearly see the path of the water.
d) Defining depressions of the DEM - We added the fourth phase because we detected that several larger depressions remained in the path of the cetina River. This happened even after we repeatedly used the algorithm for filling depressions in DEM during the first phase. The depressions that remained had a sink in which the course of the river would end if three-step D8 method was strictly applied. Although it is possible that these sinks really existed due to karst terrain, we have assumed that the cetina continued its surface flow all the way to the paleo-shoreline, based on its present topographical characteristics. In order to define depressions that were filled with water, we didn’t use
Table 2. - An example of calculation of the FAG (b) from the FDG (a).
a) b) # 1 2 3 4 5 6 7 8 9 10 11 12 => # 1 2 3 4 5 6 7 8 9 10 11 12 1 32 128 128 128 128 128 128 128 128 128 128 128 1 0 0 0 0 0 0 0 0 2 1 0 0 2 32 2 2 4 8 16 16 32 32 64 64 2 2 0 0 1 2 0 0 3 2 1 1 0 0 3 32 2 2 4 8 32 16 32 32 64 64 2 3 0 0 1 2 10 4 2 1 0 0 0 0 4 32 2 2 2 8 32 16 16 16 8 16 2 4 0 0 1 2 21 3 0 0 0 0 0 0 5 32 2 2 2 4 8 32 16 16 16 16 2 5 0 0 1 5 35 3 1 1 0 2 0 0 6 32 2 1 2 128 4 8 32 16 16 32 2 6 0 0 2 2 6 44 4 1 3 2 0 0 7 32 1 1 1 2 128 8 32 32 32 32 2 7 0 0 1 2 1 3 62 11 6 2 0 0 8 32 1 1 1 1 2 8 8 32 16 64 2 8 0 0 1 0 0 0 64 1 0 0 0 0 9 32 1 2 2 2 2 4 8 32 16 16 2 9 0 0 0 1 7 10 76 4 1 0 0 0 10 32 2 2 1 1 2 2 4 32 16 16 2 10 0 0 2 4 1 1 3 90 1 1 0 0 11 32 1 1 1 1 1 2 128 4 32 16 2 11 0 0 0 0 0 0 0 1 95 1 0 0 12 32 8 8 8 8 8 8 8 8 8 8 2 12 0 0 0 0 0 0 0 0 97 0 0 0
Fig. 2. - The DEM (a) and the FDG (b) of the part of the Brač channel near the present river mouth of the Cetina River
the published methods (e.g., JENSON, 1988; PLANcHON & DARBOUX, 2001; JONES, 2002), as
they were developed to fill small depressions that occur from digitalization errors in flat areas. Instead, we developed a proprietary algorithm that uses contours and the FAG to define depressions and the subsequent river path.
An example of the method application for the part of the Brač channel is shown in the Fig. 2. Fig. 2a shows the DEM of this area, with different depths shown in different shades of blue, while Fig. 2b shows the FDG for the area. Different flow directions are shown in different colors. Finally, the FAG map is created for the whole area (Fig. 3). cells with no accumulation (0-1) are displayed in black, and cells that have high accumulation (>2048) are shown in white.
Using the FAG shown in Fig. 3 one can determine the starting part of the paleo-riverbed of the cetina River. The paleo-riverbed starts in the place just south of the present river mouth, and then continues southwards. This part of the paleo-riverbed is displayed in gray, because the flow accumulation is still rather low. When it reaches the middle of the Brač channel, it turns eastward. The course continues eastwards until it finally turns northwards, where it stops. This second part of the paleo-riverbed is displayed
in light gray and white colors, because the flow accumulation here is rather high.
The path of the paleo-riverbed stops in a sink (depicted with the red arrow in Fig. 3), which is a result of the local depression in the DEM, and none of neighboring cells have higher flow accumulation values. Since the aim of the method is to determine the path of the river all the way to the place where it flows into the sea, here we apply the fourth phase of our method - an algorithm that defines a water accumulation (a lake) around the sink, from which the river continues its course.
This is the pseudo-code of the algorithm which defines the extent of the accumulation:
- select contour i that first contains the sink
- repeat
o push i on the processed contour stack (PCS)
o select neighbor contour si with depth smaller than i and that contains i
o if si contains other contours besides ones from PCS
exit the loop
o else
let si be new i
- set i as the accumulation boundary
After the algorithm ends, the water filled accumulation is defined with the contour i. Fig. 4 shows an example of this algorithm.
The contour closest to the sink in Fig. 4 is one with the depth of 69 m (green color). This contour is selected as the first i contour in the algorithm. The algorithm enters the loop, and the next contour - the one with the depth of 68 m (light green color) is selected as the first si. The loop is then repeated several times, until
si becomes the contour with the depth of 65 m (red color). This contour surrounds not only the contours that have been processed previously (which contain the sink), but also other con-tours. The loop stops here, and the contour from the previous iteration, becomes the boundary of the depression. This contour has the depth of 66 m, and it is shown in orange. Finally, the paleo-riverbed of the cetina River (blue line) is computed from the present river mouth, includ-ing the depression (Fig. 4b).
Fig. 3. The FAG of the part of the Brač channel near the river mouth of the Cetina River. The red arrow shows the position of the sink
The LGM paleo-coastline was computed using the contour lines for the Adriatic seabed. contour lines were generated from the DEM using the method presented by MORSE (1968),
which is similar to the one used by MAREcHAL
et al. (2010) to determine the paleo-shoreline of
canada. The equidistance of contours was 1 m. From the shape of the relief at the paleo-river mouths, at depths corresponding to the LGM sea level in the Mediterranean (120±5 m below present sea level), clinoform similar to those presented by LIUA et al. (2004) and PRATSON et al.
(2004) was detected. This clinoform was possibly
produced by the sedimentation, which leads to the conclusion that the level of the sea during the LGM was around 115 m lower than today. This estimate was used to reconstruct the paleo-coastline, which was generated by compiling all contours with the estimated depth of the LGM sea level.
limitations of the method
The method presented in the previous sec-tion has several limitasec-tions. The first one is the resolution of the DEM, which has an important influence on the hydrological analysis (WU et al., 2008). The resolution used in this paper is 15
seconds (approximately 350 m), which is rather coarse. This resolution doesn’t enable the detec-tion of narrow canyons and gorges, which rivers eventually carved in the terrain. For example, the present canyon of the cetina River, which extends from the town of Blato na cetini to the town Zadvarje, has the maximum width of 300 m (BAUČIĆ, 1967), and that couldn’t be
detected with the DEM used in this paper. This means that the size and the location, and maybe even the presence of accumulations (depressions filled with water) generated with this method is somewhat questionable, because there may be canyons and gorges, through which the river would continue to flow without accumulating.
Research presented in this paper is based on the raster-based topography, which is the most relevant approach in hydrological modeling (WU et al., 2008). Nevertheless, the eastern coast of the Adriatic Sea is a tectonically very active region (SURIĆ, 2009) and there is high
probability that parts of the terrain that we ana-lyzed have gone through tectonic changes since the LGM. Also, our method assumes that the bedrock in the area is not porous. This assump-tion is a rigid one, since present riverbeds of the cetina and Neretva Rivers are stretched through the karst terrain, with several known sinks and
Fig. 4. - An example of use of the algorithm for defining depressions: contours used during algorithm execution (a) and the depression boundary as a result (b)
subterranean hydrological links (BAUČIĆ, 1967),
and also with potential post-LGM deposition and hydro-isostatic rebound.
RESulTS
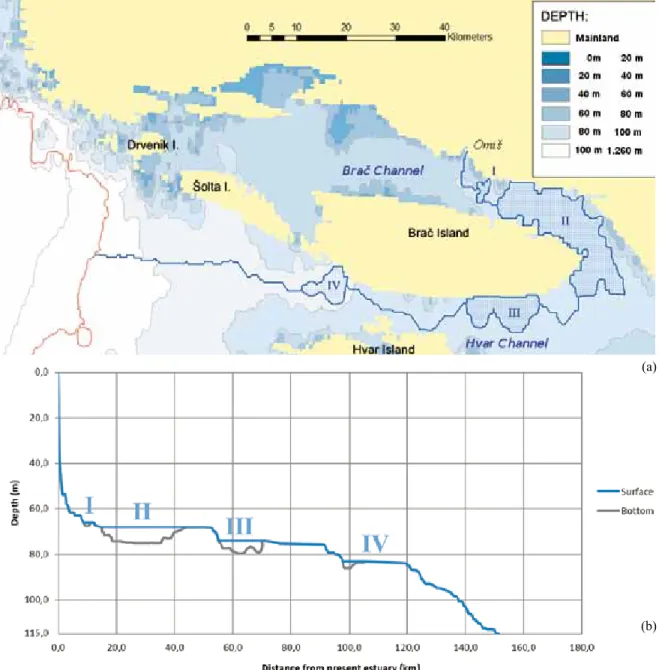
The Cetina RiverFig. 5 shows the result of our method for the cetina River. The figure displays the paleo-riv-erbed of the cetina, from present river mouth to
the paleo-river mouth, in blue color. Depressions are displayed as polygons with blue outline and filled with dotted pattern. The equidistance of contours is 20 m. The paleo-coastline is shown in red color.
The paleo-riverbed of the cetina starts in the place of the present river mouth, near the town of Omiš. It then continues south till it reaches the middle of the Brač channel. At this point the cetina River turned eastwards, and after 8 km formed the first depression, with the maximum
Fig. 5. - The map with (a) and the vertical profile of the paleo-riverbed (b) of the Cetina River. The paleo-riverbed is displayed as line in blue color. Depressions are displayed as polygons with blue outline, filled with dotted pattern, and labeled with roman literals. The equidistance of contours is 20 m. The paleo-coastline is shown in red color
(a)
depth of 3 m, and the area of 5 km2. The river
then flowed through the middle of the Brač channel, and then formed the second and the largest depression. It had an area of 155 km2 and
was 9 m deep, covering the eastern part of the present-day Brač channel. Then the paleo-river-bed of the cetina continued westward through the present-day Hvar channel for about 5 km. Then it formed the third accumulation, which had the area of 52 km2 and the maximum depth
of 11 m. After 27 km of the westward flow, the cetina created the last depression, with the area of 25 km2 and the maximum depth of 3 m. The
course continued westwards for about 35 km, reaching the paleo-river mouth south of the island of Drvenik.
The total length of the cetina, from the present river mouth to the paleo-river mouth was 154 km. Four paleo-accumulations that were generated by our model might not exist, because the present-day cetina hasn’t formed any accumulations. The present path has several deep canyons, such as the canyon that stretches from the town of Blato na cetini to the town of Zadvarje. This canyon is 13 km long, with average width of 200 m, and average depth of 20 m. Furthermore, the cetina formed a gorge in the place of present-day river mouth, 400 m wide and 190 m deep. Depressions resolved by our method have depths that are much smaller than depths of present canyons and gorges, so it is reasonable to assume that similar canyons and gorges might have been formed during the LGM instead of accumulations that resulted from our method.
Fig. 5b displays the vertical profile of the cetina, which starts with a steep fall close to the present river mouth at the town of Omiš.
BAUČIĆ (1967) documents a 60 m deep sediment
layer that has accumulated presently over the rocky riverbed at the cetina river mouth.
conse-quently, the gorge of the cetina River near Omiš was presumably much deeper during the LGM than today. This indicates that the slope of the first few kilometers of the paleo-riverbed (Fig. 5b) during the LGM was gentler than the slope obtained by our model.
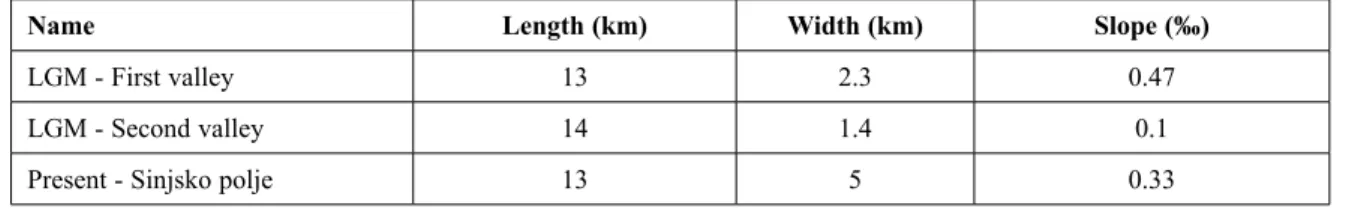
The second depression in the paleo-riverbed of the cetina has an almost flat bottom, with present depths around 75 m. The bottom falls only 0.8 m over 17 km, and its average width is about 2.3 km. It is possible that this accumula-tion was a fertile river valley during the LGM, which might have ended with a canyon through which river flowed downstream. Besides, the second river valley might have existed in the narrowest part of the Hvar channel, between the third and the fourth depressions. The cetina paleo-flow had a fall of only 2 m over 21 km there, with an average width of about 1.4 km. Table 3 shows the dimensions of two eventual river valleys we mentioned above, in respect to the largest existing fertile valley on the present cetina, called Sinjsko polje, which is 13 km long, and 5 km wide.
The Neretva River
According to our calculations, the Neretva River had a more simple and steady flow (Figs 6 and 7). From the present river mouth near the town of Ploče, the river flowed westwards for about 110 km. The first part of this section was between the peninsula of Pelješac and the mainland, the second part was between Pelješac and the island of Hvar, and the third part was between the Hvar and the island of Korčula (south of the island of Šćedro). The Neretva then turned south, passing by the western tip of the Korčula Island, and flowed southwards for about 25 km. The paleo-river mouth of the Neretva was to the north of the island of Sušac,
Table 3. - The comparison between two possible LGM river valleys and the largest existing valley of the Cetina River (Sinjsko polje)
Name length (km) Width (km) Slope (‰)
LGM - First valley 13 2.3 0.47
LGM - Second valley 14 1.4 0.1
and the total length of the Neretva, from the present river mouth to the paleo-river mouth, was 136 km.
The vertical profile of the Neretva (Fig. 6b) shows that our method didn’t produce any accu-mulation in its paleo-riverbed. In the first part of the profile, near the present river mouth, there is a steep fall, presumably the product of the present river mouth sedimentation. In the middle
of the profile there is a distinct, flat part, which stretches from the tip of Pelješac to the eastern tip of the Šćedro Island. The bottom of this part of the Neretva falls only 3 m over 40 km (slope of 0.075‰). The surrounding flat terrain is 40 km long and 5 km wide on average. It is possible that this was the fertile river valley, like similar areas mentioned above for the cetina River.
Fig. 6. - The map (a) and the vertical profile of the paleo-riverbed (b) of the Neretva River. The paleo-riverbed is displayed as line in blue color. Depressions are displayed as polygons with blue outline and filled with dotted pattern. The equidistance of contours is 20 m. The paleo-coastline is shown in red color
(a)
River Mouths
Fig. 8a shows the area of the paleo-river mouth of the cetina in detail. contours with
equidistance of 1 m are shown in light grey and contours with equidistance of 10 m are shown in dark grey. The paleo-riverbed of the cetina River is shown with thick blue line, and it ends
Fig. 7. - Perspective view: paleo-riverbeds are shown with thick blue line; paleo-shoreline is shown with thin black line
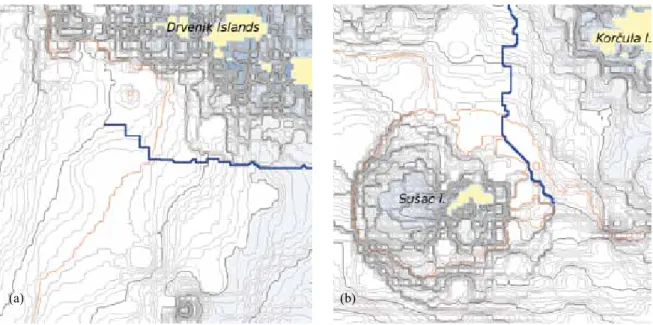
Fig. 8. - The paleo-river mouths of the Cetina (a) and Neretva (b) Rivers. The 115 m isobath is shown in red, and the paleorierbed in blue
with the 120 m contour. contours with depths between 116 and 119 m, in the area to the south of the end of the blue line have an unusual con-vex form. contours before and after them (115 m and 120 m) are straighter, in accordance with the surrounding terrain. The convex form of con-tours indicates the possible sedimentation in that area, like rivers form on the sea bottom near the river mouth. Similar clinoforms were detected in the place of paleo-river mouths of Yellow River in the North Yellow sea, china (LIUA et al., 2004),
Waiapoa river in the Poverty Bay, New Zealand (GERBER et al., 2010) and Gargano river in the
Western Adriatic (cATTANEO et al., 2003). If the
convex form of contours we have detected indi-cates the clinoform caused by the sedimentation of the cetina River, then the paleo-river mouth of the cetina was on the contour with the depth of 115 m (the contour shown in red). According to this hypothesis, this contour was used to rep-resent the paleo-coastline in this study.
The paleo-river mouth of the Neretva River (Fig. 8b) confirms the findings for the cetina River. This figure displays the flat plane with the depth of 116 m, north-northeast of the island of Sušac. The terrain on all other sides of the island of Sušac is different – it has steep slopes reaching much larger depths. This fact suggests that the flat plane might be generated by the sediment that the Neretva deposited at its paleo-river mouth and filled the gap between the island of Sušac and the mainland. Such deposit sup-ports the conclusion that the coastline during the LGM was about 115 meters lower than today.
The Coastline
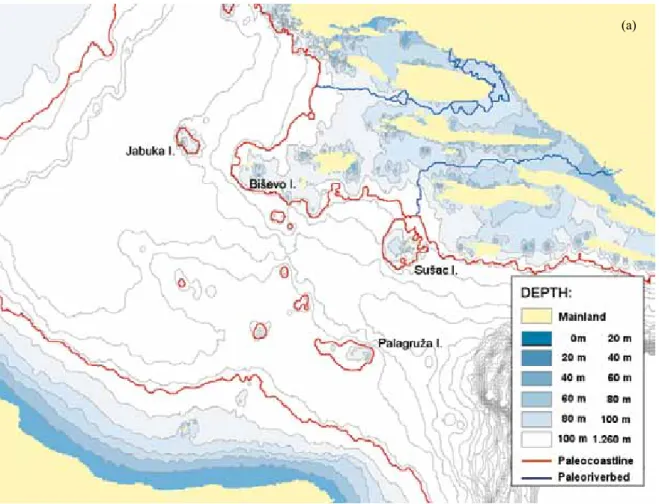
Fig. 9a shows the present coastline of the central part of the Adriatic Sea. The paleo-coast-line that was estimated by our method (having present depth of around 115 m) is shown in Fig. 9b. All present-day islands, except Palagruža,
Fig. 9. – Central part of the Adriatic Sea today (a) and during the LGM (b)
Jabuka and Sušac, were a part of the mainland during the LGM. Also, one can see that a number of smaller islands existed in the LGM between present islands of Biševo and Palagruža. Their heights were small, less than 25 m. According to the results of our method, the width of the Adriatic Sea in the central part during the LGM was only 65 km.
DISCuSSIoN AND CoNCluSIoNS
This paper presents the reconstruction of paleo-riverbeds of the cetina and Neretva Riv-ers and the paleo-coastline of the central Eastern Adriatic during the LGM. The reconstruction is done from the 15’’ resolution bathymetry by the modified D8 algorithm, with added module for the determination of eventual depressions on the paleo-river course.
The reconstruction of the paleo-riverbeds of the Neretva and cetina shows that these two karstic rivers had different nature, regardless the
fact that their paleo-riverbeds were as close as 20 km at some sections. The model indicated that the cetina formed several accumulations along its way to the Adriatic Sea, which in real-ity might be a chain of fertile valleys in the case that narrow canyons were present along the riverbed. In contrary, the Neretva paleo-riverbed did not form accumulations, and the river had a steady course towards the sea. These results indicate a complexity of karstic systems along the eastern Adriatic basin and Dinarides, which may have a strong influence of the exact topography of the paleo-riverbeds and their canyons and gorges, which are relatively hard to capture by the models and the bathymetry reso-lution which we applied here. Besides diverse characteristics of the course of two rivers, the other major difference is the fact that the cetina River outpoured into the Jabuka basin, while the Neretva River flowed into the South-Adriatic basin.
The paleo-river mouths which we found for both paleo-rivers are in agreement with findings documented for other Adriatic and worldwide paleo-rivers. For example, Yellow River in the North Yellow Sea has a Holocene subaqueous river mouth (LIUA et al., 2004). This river mouth
is indicated with the clinoform that was formed from Yellow River sedimentation, influenced by the sea circulation. The clinoform was iden-tified, and its development explained using sub-bottom profiles, which in the case of paleo-river mouths of the cetina and Neretva are not available. A subaqueous sedimentation was dis-covered for Waipaoa River, New Zealand ( GER-BER, 2010), which is of similar size as cetina/
Neretva. Southwest of present river mouth of Waipaoa River in the Poverty Bay, a subaque-ous clinoform was discovered with the shape similar to the one near the paleo-river mouth of the cetina. Furthermore, the present river mouth of the largest river flowing into the Adriatic Sea – the Po River, has a shape similar to the paleo-river mouth of the cetina. The simulation of the paleo-river mouth development done for the Po River (PRETSON, 2004) and research conducted
for the Gargano subaqueous delta (cATTANEO et al., 2003; NIEDORODA et al., 2005) indicates vertical
and horizontal shapes of the clinoform similar to shapes of paleo-river mouth of the cetina presented here.
The form of the sea bottom relief near the paleo-river mouths leads to the conclusion that sedimentation was present both in the case of cetina and Neretva River. The cetina River formed a clinoform near the river mouth, while
the Neretva River filled the gap between the island of Sušac and the mainland with the sedi-ment. Following to these findings we concluded that the sea level during the LGM was about 115 m lower than today. The paleo-coastline shows that during the LGM, all present islands in the croatian part of the central Adriatic Sea, except islands of Jabuka, Palagruža and Sušac, were a part of the continent. We hope these conclusions will help better understand how the vicinity of the sea and rivers had influenced people that lived in this area during the LGM. The location of human settlements and sea transport routes from the time of the LGM, have until now lacked the wider insight that our research brings.
Apart from the fact that the DEM used for our model had limited resolution, other impor-tant factors such as tectonics and hydro-geology of the research area in this paper couldn’t be taken into account within the modified D8 algo-rithm. The existing watersheds of the cetina and Neretva Rivers have numerous karst features such as karst plains, sources, sinks and caves, which define specific surface and underground flows. Also, to confirm our conclusions about the position of paleo-river mouths of two rivers, the sub-bottom profiling should be performed in the future (LIUA et al., 2004; GERBER, 2010; HIJMA, 2009). This method could confirm the existence
of the clinoform structures that exist in the place of river mouth sedimentations. Therefore, this paper should be considered as the beginning of the research which would define the paleo-riverbeds of the cetina and Neretva with more precision and certainty.
REfERENCES
BAUČIĆ I. 1967. cetina – razvoj reljefa i
cirkulac-ije vode u kršu (cetina – the development of the relief and the circulation of the water in karst terrain), Radovi Geografskog instituta Sveučilišta u Zagrebu, 6, 161.
BIRKINSHAW S. J. 2010. Technical Note -
Automat-ic river network generation for a physAutomat-ically- physically-based river catchment model, Hydrology and Earth System Sciences, 14, 1767–1771.
cATTANEO A., A. cORREGGIARI, L. LANGONE & F. TRINcARDI 2003. The late-Holocene Gargano
subaqueous delta, Adriatic shelf: Sediment pathways and supply fluctuations, Marine Geology, 193, pp. 61 – 91.
cLARK P.U., A.S. DYKE, J.D. SHAKUN, A.E. cARL-SON, J. cLARK, B. WOHLFARTH, J.X. MITRO-VIcA, S.W. HOSTETLER, A.M. MccABE 2009.
The Last Glacial Maximum, Science, 325, 710-714
DI DONATO G., A.M NEGREDO., R. SABADINI & L. L. A. VARMEERSEN 1999. Multiple processes
Mediter-ranean, Geophysical Research Letters, 26, 1769-1772.
DOBOS E., E. MIcHELI, M.F. BAUMGARDNER, L. BIEHL & T. HELT 2000. Use of combined
dig-ital elevation model and satellite radiometric data for regional soil mapping, Geoderma, 97, 367 – 391.
FORENBAHER S. 1999. The Earliest Islanders of
the Eastern Adriatic, collegium Antropologi-cum, 23, 2, 521 - 530
GERBER T. P., L. F. PRATSON, S. KUEHL, J.P. WALSH, c. ALEXANDER & A. PALMER 2010. The
influ-ence of sea level and tectonics on Late Pleis-tocene through Holocene sediment storage along the high-sediment supply Waipaoa continental shelf, Marine Geology, 270, 1, 139 – 159.
GREENLEE D. D. 1987. Raster and Vector
Process-ing for Scanned Linework, Photogrammetric Engineering and Remote Sensing, 53, 10, 1383 – 1387.
HIJMA M. P. 2009. From river valley to estuary:
the early-mid Holocene transgression of the Rhine-Meuse valley, The Netherlands, Ph.D. Thesis, Utrecht University.
JENSON S. K. & J. O. DOMINGUE 1988. Extracting
Topographic Structure from Digital Eleva-tion Data for Geographic InformaEleva-tion Sys-tem Analysis, Photogrammetric Engineering and Remote Sensing, 54, 11, 1593 - 1600.
JONES R. 2002. Algorithms for using a DEM for
mapping catchment areas of stream sedi-ment samples, computers & Geosciences, 28, 1051-1060.
LAMBEcK K. & E. BARD 2000. Sea-level change
along the French Mediterranean coast for the past 30 000 years, Earth and Planetary Sci-ence Letters, 175, 203-222.
LAMBEcK K. & A. PURcELL 2005. Sea-level change
in the Mediterranean Sea since the LGM: model predictions for tectonically sw areas, Quaternary Science Reviews, 24, 1969-1988.
LIUA J.P., J. MILLIMAN, S. GAOc & P. cHENG 2004.
Holocene development of the Yellow River’s subaqueous delta, North Yellow Sea, Marine Geology, 209, 45 – 67.
MARÉcHAL D., J. BAILLY, c. PUEcH, P. AYRAL, D. SALZE & S. SAUVAGNARGUES-LESAGE 2010.
ExtracTIN: An original algorithm for auto-matic extraction of hydrographic network using elevation data, Proceedings of the BALWOIS conference - Water Observation and Information System for Balkan coun-tries, 25.-29. 05. 2010.
MONTGOMERY D. R. 1993. channel Network
Source Representation Using Digital Eleva-tion Models, Water Resources Research, 29, 12, 3925 – 3934.
MORSE S. P. 1968. “computer storage of
contour-map data”, Proceedings of the 1968 23rd AcM national conference, 45 – 51.
NARDI F., S. GRIMALDI, M. SANTINIc, A. PET-ROSELLI & S. UBERTINI 2011.
Hydrogeomor-phic properties of simulated drainage pat-terns using digital elevation models: the flat area issue, Hydrological Sciences Journal, 53, 6, 1176 – 1193.
NIEDORODA A.W., c.W. REED, H. DAS, S. FAGH-ERAZZI, J.F. DONOGHUE & A. cATTANEO 2005.
Analyses of a large-scale depositional clino-formal wedge along the Italian Adriatic coast, Marine Geology, 222, 179 – 192.
PELTIER, W.R. & FAIRBANKS, R.G. 2006, Global
glacial ice volume and Last Glacial Maxi-mum duration from an extended Barbados sea level record, Quaternary Science, 25, 3322–3337
PLANcHON O. & F. DARBOUX 2001. A fast, simple
and versatile algorithm to fill the depressions of digital elevation models, catena, 46, 159 – 176.
PRATSON L., J. SWENSON, A. KETTNER, J. FEDELE, G. POSTMA, A. NIEDORODA, c. FRIEDRIcHS, J. SYVITSKI, c. PAOLA & M. STEcKLER 2004.
Modeling continental Shelf Formation in the Adriatic Sea and Elsewhere, Oceanography, 17, 4, 118 – 131.
RABINEAU M., S. BERNE, J.L. OLIVET, D. ASLANI-AN, F. GUILLOcHEAU & P. JOSEPH 2006. Paleo
sea levels reconsidered from direct observa-tion of paleoshoreline posiobserva-tion during Glacial Maxima (for the last 500,000 yr), Earth and Planetary Science Letters, 252, 119 – 137.
RAcOVITEANU A.E., W.F. MANLEY, Y. ARNAUD & M.W. WILLIAMS 2007. Evaluating digital
An example from Nevado coropuna, Peru-vian Andes, Global and Planetary change, 59, 110 – 125.
ROTHWELL J.J. & J.B. LINDSAY 2007. Mapping
contemporary magnetic mineral concentra-tions in peat soils using fine-resolution dig-ital terrain data, catena, 70, 465 – 474.
SIGNELL R. 2006. http:// woodshole.er.usgs.gov / staffpages /rsignell /rps /share /adria_bathy_15sec. nc, United States Geological Survey, Woods Hole Science center, USA
STEVENS N.F., H. GARBEIL & P.J. MOUGINIS-MARK 2004. NASA EOS Terra ASTER:
Volcan-ic topographVolcan-ic mapping and capability Remote Sensing of Environment, 90, 405 – 414.
STRASSER T.F., N. THOMPSON, E. PANAGOPOULOU, P. KARKANAS, c.N. RUNNELS, F.W. MccOY, P.M. MURRAY & K.W. WEGMANN 2010. Stone age
seafaring in the Mediterranean: Evidence from the Plakias region for Lower
Pal-aeolithic and Mesolithic habitation of crete, Hesperia, 72, 2, 145-190
SURIĆ M. 2009. Rekonstruiranje promjena morske
razine na istočnoj obali jadrana (Hrvatska) – pregled (The reconstruction of the variation of the sea level in the croatian eastern Adri-atic – review), Geoadria, 14, 2, 181 – 199.
SURIĆ M., M. JURAČIĆ, N. HORVATINČIĆ & N. KRAJcAR-BRONIĆ 2005. Late Pleistocene–
Holocene sea-level rise and the pattern of coastal karst inundation: records from sub-merged speleothems along the Eastern Adri-atic coast (croatia), Marine Geology, 214, 163 – 175.
WOODWARD J. 2009. The physical geography of
the Mediteranean, Oxford University Press.
WU S., J. LIB & G. HUANG 2008.: A study on
DEM-derived primary topographic attributes for hydrologic applications: Sensitivity to ele-vation data resolution, Applied Geography (Elsevier), 28, 210-223.
Received: 05 February 2013 Accepted: 24 May 2014
Istočna obala srednjeg Jadrana i tokovi rijeka Cetine i Neretve
za vrijeme posljednjeg glacijalnog maksimuma
Marjan SIKORA1*, Hrvoje MIHANOVIĆ2 i Ivica VILIBIĆ3
1Fakultet elektrotehnike, strojarstva i brodogradnje, Sveučilište u Splitu 2 Hrvatski hidrografski institut, Split
3 Institut za oceanografiju i ribarstvo, Split
*Kontakt adresa, e-mail: sikora@fesb.hr SAžETAK
U ovom radu prikazana je rekonstrukcija istočne obale srednjeg Jadrana i tokova rijeka cetine i Neretve za vrijeme posljednjeg glacijalnog maksimuma. Rekonstrukcija je izvršena korištenjem digitalnog modela reljefa Jadranskog mora rezolucije 15’’. Prilikom razmatranja rezultata rekon-strukcije, potrebno je uzeti u obzir ograničenja proizašla iz rezolucije modela reljefa, te ograničenja same metode. Rekonstruirani tok rijeke cetine upućuje da su na više mjesta postojale depresije ispunjene vodom. Oblik dna u blizini tadašnjih ušća Neretve i cetine podsjeća na nanose koje rijeke donose svojim ulijevanjem u more. Iz vertikalnog profila dna u blizini ušća proizlazi da je u doba zadnjeg glacijalnog maksimuma razina mora bila na današnjoj dubini od oko 115 m. Prema rekon-strukciji, duljina toka rijeke Neretve bila je tada duža za 136 km, a duljina toka rijeke cetine je bila duža za 154 km.