Asian Journal of
Food and Agro-Industry
ISSN 1906-3040Available online at www.ajofai.info
Research Article
Chemical composition, colour and linear expansion properties of Malaysian
commercial fish cracker (keropok)
Nurul Huda*, Ang Li Leng, Chung Xian Yee and Herpandi
Fish and Meat Processing Laboratory, Food Technology Division, School of Industrial Technology, Universiti Sains Malaysia, Minden 11800 Malaysia.
*Author to whom correspondence should be addressed, email: [email protected]
Abstract
The objective of this study was to compare and contrast the physicochemical properties of fish crackers from different producers in Malaysia. About 28 samples of fish crackers from several states in Malaysia were purchased and analyzed. The results showed that the samples were significantly different (p<0.05) in their chemical composition, colour and linear expansion. The moisture content ranged between 9.37 and 13.83%, whereas fat and ash content ranged from 0.85 to 3.38% and 3.39 to 5.94%, respectively. However, the protein content, which was 5.53-15.80%, differentiates products with high fish content and those with low fish content. The carbohydrate content varied between 53.62 and 80.43%, reflecting high use of starch in the formulation. The calcium (Ca) content in fish crackers varied between 9.75 and 381.50 mg/100 g, indicating that a small amount of fish was used or that bony fish were used in the crackers. Furthermore, sodium (Na) content was between 1183 and 1888 mg/100 g. The L*, a* and b* values of fish crackers ranged from 18.69-47.99, 1.03-5.89 and 7.77-20.62, respectively. The linear expansion of samples varied between 37.55 and 145.95%, which is inversely proportional to the protein content but linearly correlated with the carbohydrate content. These results showed that Malaysian fish crackers produced by different manufacturers were significantly different in chemical
composition, colour and linear expansionproperties.
Introduction
Fish crackers or `keropok' are a popular snack food in Malaysia and other Asian countries [1]. More than 100 small-scale processors are engaged in this business. The crackers are made by mixing minced fish meat with sago flour, tapioca flour, salt and monosodium glutamate. The
mixture is then molded into cylinders, steamed, cooled, sliced and sun-dried [2]. The sliced, dried
product is fried in cooking oil before it is eaten as a snack food or together with rice and other daily dishes [3].
Unfortunately, the fish cracker industry still follows traditional manufacturing practices, which may lead to variations in the quality of product produced. Many studies have developed new
technologies to improve the quality of fish cracker production. Yu [4], Kyaw et al. [5] and King
[6] studied the effect of the fish to starch ratio on fish cracker properties, whereas Peranginangin
[7] and Jamilah et al. [8] studied the effects of food additives to fish crackers. Furthermore, Huda
et al. [9] studied fish crackers with surimi powder substitution for flour to improve the nutritional value of the crackers. The objective of this study was to identify the physicochemical properties of fish crackers from different producers in Malaysia.
Materials and Methods Fish crackers
The fish crackers were purchased from various sources from several states in Malaysia. Altogether, 28 samples from different manufacturers from different states in Malaysia were collected. However, only 14 samples, which were selected randomly by state, were analyzed for the chemical composition and mineral analysis.
Chemical composition
The chemical composition was determined according to AOAC [10] methods. The carbohydrate
content was estimated by subtracting the sum of percentage of moisture, crude fat, crude protein and ash contents from 100%.
Calcium
To determine the Ca using Atomic Absorption Spectrometer (Analyst 100, Perkin Elmer), the sample must be digested first. First, 50 mL of deionized water was added to 58.64 g of lanthanum
oxide (La2O3). Then, 250 mL of HCl was added, and the mixture was topped up to 1 L using
deionized water in a volumetric flask. Six milliliters of HNO3 and 1 mL of 30% (v/v) H2O2 were
added to 1 g of ground sample. Then, this mixture was digested in a microwave digester for 15 minutes. After digestion, 20 mL of lanthanum oxide solution was added to each sample and was diluted to 100 mL with deionized water. A series of calcium standard solutions with concentrations of 0, 1, 2, 3, 4 or 5 ppm were made from the calcium stock of 100 ppm. By using AAS, the absorbance for the standards and samples were measured. If the absorbance was too high for the sample, then the sample was diluted again.
Sodium
For Na content, the samples were also digested first. To about 1 g of ground sample, 6 mL of
HNO3 and 1 mL of 30% (v/v) H2O2 were added. Then, they were digested in a microwave digester
of sodium standard solutions with concentrations of 0, 02, 0.4, 0.6, 0.8 or 1 ppm were made from a stock of 100 ppm sodium. If the absorbance was too high for the sample, then the sample was diluted again (5x) in 50-mL volumetric flask.
Linear expansion
The percentage linear expansion was measured according to the method of Yu (4) as follows:
Length after puffing – length before puffing
LE (%) = --- x 100
Length before puffing
Colour
The colour of ground, fried cracker samples was measured using a colorimeter (Minolta spectrophotometer CM 3500d, Japan). The colour reading includes lightness (L*), redness (a*) and yellowness (b*). The equipment was standardized with a white colour standard.
Statistical analysis
Data obtained from all the tests were analyzed by using one-way analysis of variance (ANOVA) and followed by Duncan multiple range test of the Statistical Package for Social Science version 12.0 (SPSS inc., Chicago, Illinois, U.S.A). Statistical significance was indicated at the 95% confidence level.
Results and Discussion
The chemical composition of fish crackers are listed in Table 1. As a dried product, fish crackers are expected to have low moisture content. Commercial fish crackers studied had moisture
contents between 9.37 and 13.83%. Yu [4], King [6] and Nurul et al. [3] reported moisture content
of fish crackers of 12, 12 and 9%, respectively. Control of moisture in crackers is necessary to optimize the quality of the product and the production process. Mohamed [11] concluded that insufficient water may lead to incomplete gelatinization of starch during the steaming process. Thus, fish crackers do not expand well. Furthermore, excess water causes a decrease in expansion and results in thinner fish crackers after drying. In addition, too much moisture also results in dough that is too soft and difficult to slice.
From the results, samples 3, 4, 15 and 20 were found to contain significantly (P<0.05) higher protein content than the other samples (> 15%). This finding is in agreement with regulation No. 168 in the Malaysian Food Regulations 1985, which requires 15% as the minimum amount of
protein. According to Yu [4], King [6] and Nurul et al. [3], the more fish used in fish crackers, the
higher the protein content of fish crackers. Thus, the low content of protein indicates low fish content in the formulation.
King [6] found that fish crackers prepared from 40% fish with 60% starch yielded crackers with a protein content of 10%. This finding suggests that those crackers containing protein of more than 10% were probably made with more than 40% fish in their formulation. However, different
producers may use different types of fish with different protein contents. Furthermore, Nurul et al.
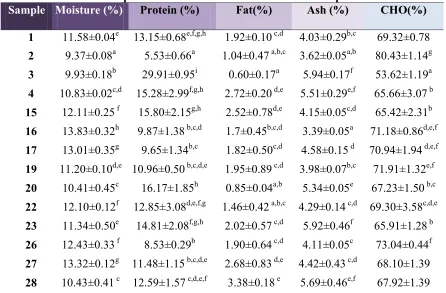
Table 1. Chemical Composition of Fish Crackers for Selected Samples
Sample Moisture (%) Protein (%) Fat(%) Ash (%) CHO(%)
1 11.58±0.04e 13.15±0.68e,f,g,h 1.92±0.10c,d 4.03±0.29b,c 69.32±0.78
2 9.37±0.08a 5.53±0.66a 1.04±0.47a,b,c 3.62±0.05a,b 80.43±1.14g
3 9.93±0.18b 29.91±0.95i 0.60±0.17a 5.94±0.17f 53.62±1.19a
4 10.83±0.02c,d 15.28±2.99f,g,h 2.72±0.20d,e 5.51±0.29e,f 65.66±3.07 b
15 12.11±0.25f 15.80±2.15g,h 2.52±0.78d,e 4.15±0.05c,d 65.42±2.31b
16 13.83±0.32h 9.87±1.38b,c,d 1.7±0.45b,c,d 3.39±0.05a 71.18±0.86d,e,f
17 13.01±0.35g 9.65±1.34b,c 1.82±0.50c,d 4.58±0.15d 70.94±1.94 d,e,f
19 11.20±0.10d,e 10.96±0.50b,c,d,e 1.95±0.89c,d 3.98±0.07b,c 71.91±1.32e,f
20 10.41±0.45c 16.17±1.85h 0.85±0.04a,b 5.34±0.05e 67.23±1.50 b,c
22 12.10±0.12f 12.85±3.08d,e,f,g 1.46±0.42a,b,c 4.29±0.14c,d 69.30±3.58c,d,e
23 11.34±0.50e 14.81±2.08f,g,h 2.02±0.57c,d 5.92±0.46f 65.91±1.28 b
26 12.43±0.33f 8.53±0.29b 1.90±0.64c,d 4.11±0.05c 73.04±0.44f
27 13.32±0.12g 11.48±1.15b,c,d,e 2.68±0.83d,e 4.42±0.43c,d 68.10±1.39
28 10.43±0.41c 12.59±1.57c,d,e,f 3.38±0.18e 5.69±0.46e,f 67.92±1.39
*Means within a column with different letters are significantly different (P < 0.05).
The fat content in the fish crackers ranged between 0.85 and 3.38%. The fat content in fish crackers may depend on the amount, fat content or the particular parts of fish or raw materials used. This result is in agreement with the findings of Yu [4], who reported that the higher the fish meat ratio used, the higher the fat content of the fish crackers. King [6] also reported fat content of 0.5-1.9% for fish meat contents from 40-60%. The fat content of the crackers may increase after frying as a consequence of oil absorption during frying; thus, the final fat composition of the crackers is probably higher than that estimated by the composition analysis of the dry crackers.
The ash content observed ranged between 3.39 and 5.94%, which was similar to the 4.2% reported
by Tee et.al. [12].Samples 3, 4, 15, 17, 20, 22, 23, 26, 27 and 28 exhibited significantly higher
ash content compared to the other samples (P <0.05). The variation in the ash content is most probably due to the difference in the amount and type of fish used. The higher the amount of fish used, the higher the ash content is. King [6] found that ash content increased linearly with an increase in fish content.
From the results obtained, some samples were found to have a carbohydrate content of more than 70%: samples 2, 16, 17, 19, and 26. Some reported values of carbohydrate are 66% (12) and 64 to 68.3% (9).
Samples which are high in ash content are also high in calcium and sodium contents (Table 2). The samples analyzed had calcium content ranging between 9.75 and 381.50 mg/100 g. The samples with calcium content greater than 200 mg/100 g were samples 3, 4, 20, 22, 23, 27 and 28. Tee et.al. [12] reported a higher content of calcium in fish crackers (329 mg/100 g) than the fish crackers studied. The variations in calcium content among the samples may be due to differences in fish species and in the amounts of fish used. The variation may also be due to the variable use of bony fish, whole fish, only the fish meat or deboned fish. The calcium content of the samples was found to have a linear relationship with the protein content. This linear relationship may be due to the use of whole fish rather than the deboned fish. However, for samples 1 and 15, although they had low calcium contents, they had relatively high protein contents. These differences might be due to the use of non-bony fish or only the fish meat. Chemical composition of fish crackers depends on formulation [15].
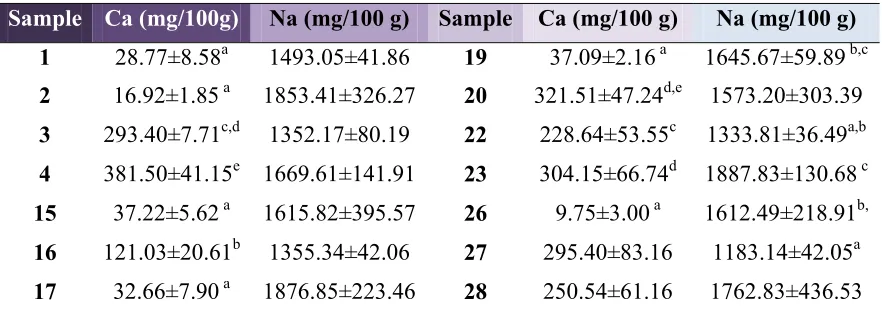
Table 2. Sodium and Calcium Content of Fish Crackers
Sample Ca (mg/100g) Na (mg/100 g) Sample Ca (mg/100 g) Na (mg/100 g)
1 28.77±8.58a 1493.05±41.86 19 37.09±2.16a 1645.67±59.89 b,c
2 16.92±1.85a 1853.41±326.27 20 321.51±47.24d,e 1573.20±303.39
3 293.40±7.71c,d 1352.17±80.19 22 228.64±53.55c 1333.81±36.49a,b
4 381.50±41.15e 1669.61±141.91 23 304.15±66.74d 1887.83±130.68c
15 37.22±5.62a 1615.82±395.57 26 9.75±3.00a 1612.49±218.91b,
16 121.03±20.61b 1355.34±42.06 27 295.40±83.16 1183.14±42.05a
17 32.66±7.90a 1876.85±223.46 28 250.54±61.16 1762.83±436.53
*Means within a column with different letters are significantly different (P < 0.05).
The ranges of sodium content among the samples are 1183.14-1887.83 mg/100 g, which is slightly higher than a previous report of 1047 mg/100 g [12]. The addition of salt and monosodium glutamate during the manufacturing process probably contributed to the sodium content in the fish crackers. Both salt and MSG are frequently added to the product. Sample labels that state the use of MSG include samples 4, 5, 8, 14, 16, 20, 24 and 26.
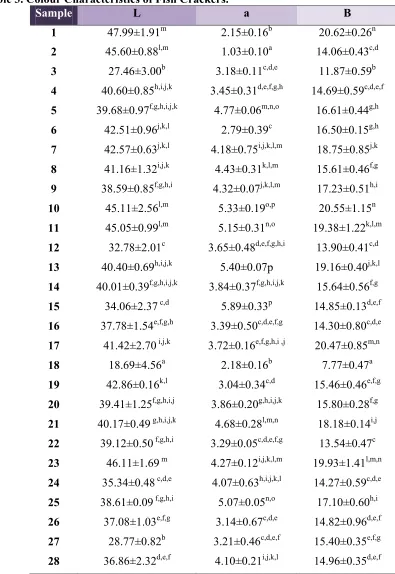
Colour measurements were obtained for 28 samples using the Minolta spectrophotometer. L*, a* and b* values were taken. The L*, a*, and b* values for the samples are shown in Table 3. There are many factors affecting the colour of the fish crackers, such as the amount and type of fish used
or the amount and type of starch added [9]. Nurul et al. [3] found that the lightness and redness
(L* and a* values) tend to decrease with an increase in the ratio of fish meat to tapioca flour, whereas, yellowness (b* value) tends to be higher in samples with low amounts of fish meat.
Rosmawaty et al. [16] reported that the types of additives used and the thickness of the crackers
can also influence the colour of the crackers. Rosmawaty et.al. [16] also reported that the species
Table 3. Colour Characteristics of Fish Crackers.
Sample L a B
1 47.99±1.91m 2.15±0.16b 20.62±0.26n
2 45.60±0.88l,m 1.03±0.10a 14.06±0.43c,d
3 27.46±3.00b 3.18±0.11c,d,e 11.87±0.59b
4 40.60±0.85h,i,j,k 3.45±0.31d,e,f,g,h 14.69±0.59c,d,e,f
5 39.68±0.97f,g,h,i,j,k 4.77±0.06m,n,o 16.61±0.44g,h
6 42.51±0.96j,k,l 2.79±0.39c 16.50±0.15g,h
7 42.57±0.63j,k,l 4.18±0.75i,j,k,l,m 18.75±0.85j,k
8 41.16±1.32i,j,k 4.43±0.31k,l,m 15.61±0.46f,g
9 38.59±0.85f,g,h,i 4.32±0.07j,k,l,m 17.23±0.51h,i
10 45.11±2.56l,m 5.33±0.19o,p 20.55±1.15n
11 45.05±0.99l,m 5.15±0.31n,o 19.38±1.22k,l,m
12 32.78±2.01c 3.65±0.48d,e,f,g,h,i 13.90±0.41c,d
13 40.40±0.69h,i,j,k 5.40±0.07p 19.16±0.40j,k,l
14 40.01±0.39f,g,h,i,j,k 3.84±0.37f,g,h,i,j,k 15.64±0.56f,g
15 34.06±2.37 c,d 5.89±0.33p 14.85±0.13d,e,f
16 37.78±1.54e,f,g,h 3.39±0.50c,d,e,f,g 14.30±0.80c,d,e
17 41.42±2.70 i,j,k 3.72±0.16e,f,g,h,i ,j 20.47±0.85m,n
18 18.69±4.56a 2.18±0.16b 7.77±0.47a
19 42.86±0.16k,l 3.04±0.34c,d 15.46±0.46e,f,g
20 39.41±1.25f,g,h,i,j 3.86±0.20g,h,i,j,k 15.80±0.28f,g
21 40.17±0.49 g,h,i,j,k 4.68±0.28l,m,n 18.18±0.14i,j
22 39.12±0.50 f,g,h,i 3.29±0.05c,d,e,f,g 13.54±0.47c
23 46.11±1.69 m 4.27±0.12i,j,k,l,m 19.93±1.41l,m,n
24 35.34±0.48 c,d,e 4.07±0.63h,i,j,k,l 14.27±0.59c,d,e
25 38.61±0.09 f,g,h,i 5.07±0.05n,o 17.10±0.60h,i
26 37.08±1.03e,f,g 3.14±0.67c,d,e 14.82±0.96d,e,f
27 28.77±0.82b 3.21±0.46c,d,e,f 15.40±0.35e,f,g
28 36.86±2.32d,e,f 4.10±0.21i,j,k,l 14.96±0.35d,e,f
fish crackers. This finding also in agreement with Yu [4] who reported that the type of fish did not influence acceptability although there was a preference for the lighter colour of jewfish cracker compared to sardine cracker.
Mohamed et al. [11] found that the type of flour used in fish crackers affected the clarity of the
fish crackers, which in turn affected the colour of the product. Another factor that may also contribute to the colour of fish crackers is the Maillard reaction because some producers do include sugar in the production of fish crackers.
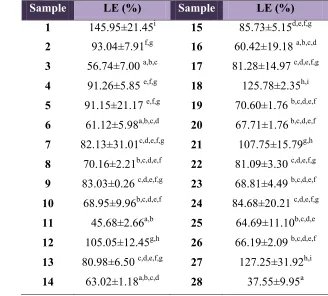
The measurement of linear expansion obtained for 28 samples are shown in Table 4. Yu [4] proposed that linear expansion of fish crackers should be greater than 77% for crispiness. Fifteen out of twenty-eight fish cracker samples in this study showed linear expansion values higher than 77%.
Table 4. Linear Expansion of Fish Crackers
The amount and type of fish and flour used contribute to the linear expansion of fish crackers (4; 6;
7; 11). Huda et al. [9] reported that increasing the amount of fish used to make the crackers
resulted in a decrease in the linear expansion of traditional crackers, indicating a negative correlation between protein content and linear expansion of crackers. This result is also in
agreement with a report by Cheow et al. [17], who found that linear expansion was significantly
(P<0.05) reduced with an increase in fish content from 300 to 800 gkg-1; however, there was also a
slight increase in linear expansion of `keropok' from 200 to 300 gkg-1 fish content due to the
available water provided by wet fish for starch gelatinization or due to sufficient protein, which, when heat denatured, may be able to resist collapse during starch expansion. According to
Sample LE (%) Sample LE (%)
1 145.95±21.45i 15 85.73±5.15d,e,f,g
2 93.04±7.91f,g 16 60.42±19.18 a,b,c,d
3 56.74±7.00 a,b,c 17 81.28±14.97 c,d,e,f,g
4 91.26±5.85 e,f,g 18 125.78±2.35h,i
5 91.15±21.17 e,f,g 19 70.60±1.76 b,c,d,e,f
6 61.12±5.98a,b,c,d 20 67.71±1.76b,c,d,e,f
7 82.13±31.01c,d,e,f,g 21 107.75±15.79g,h
8 70.16±2.21b,c,d,e,f 22 81.09±3.30 c,d,e,f,g
9 83.03±0.26 c,d,e,f,g 23 68.81±4.49 b,c,d,e,f
10 68.95±9.96b,c,d,e,f 24 84.68±20.21 c,d,e,f,g
11 45.68±2.66a,b 25 64.69±11.10b,c,d,e
12 105.05±12.45g,h 26 66.19±2.09 b,c,d,e,f
13 80.98±6.50 c,d,e,f,g 27 127.25±31.92h,i
Mohamed et al. [11], sufficient available water is needed for optimum linear expansion. Insufficient water causes incomplete gelatinization of the starch during steaming. Additionally, excess water reduces the solid content of fish crackers that have been sliced consistently at a certain thickness. These circumstances prevent the fish crackers from expanding properly. Yu [4] also reported that the type of flour used was the controlling factor in the expansion of fish crackers and found negative and positive correlations between linear expansion and the protein and carbohydrate contents, respectively. Most of the producers use sago flour as one of the fish cracker
ingredients. The rest do not mention what types of flour were used. According to Mohamed et al.
[11], the crackers with the highest linear expansion are those that were made with glutinous rice flour, followed by rice flour, tapioca, corn, sago, wheat and mungbean.
One other factor that may contribute to linear expansion of fish crackers is steaming time. Kyaw et
al. [5] concluded that a steaming time of 20-30 minutes is sufficient to cook the gel and that
excessive steaming time will result in a poor-quality product due to excess water trapped inside the swollen granules. The various linear expansion values of Malaysian commercial fish crackers are probably due to the variable types of ingredients and processing methods used.
Conclusion
The Malaysian commercial fish crackers studied were significantly different (p<0.05) in their chemical composition, colour and linear expansion. These physicochemical properties of fish crackers were affected by the type and amount of each ingredient used. The method of manufacturing process used also contributed to the various values of each parameter studied.
Acknowledgement
The authors acknowledge with gratitude the support given by Universiti Sains Malaysia for our research in this area.
References
1. Cheow, C.S and Yu, S.Y, (1997). Effect of fish protein, salt, sugar and monosodium
glutamate on the gelatinization of starch in fish-starch mixtures. Journal of Food
Processing and Preservation, 21: 161-177.
2. Food and Fertilizer Technology Centre for the Asian and Pacific Region. (2010).
Small-Scale Food Processing Enterprises in Malaysia. Retrieved from: www.agnet.org (Accessed date: August 9 2010).
3. Nurul, H., Boni, I. and Noryati, I. (2009). The effect of different ratios of Dory fish to
tapioca flour on the linear expansion, oil absorption, colour and hardness of fish crackers.
International Food Research Journal, 16: 159-165.
4. Yu, S.Y. (1991). Acceptability of fish crackers (keropok) made from different types of
5. Kyaw, Z.Y., Yu, S.Y., Cheow, C.S., Dzulkifly, M.H. and Howell, N.K. (2001). Effect of fish to starch ratio on viscoelastic properties and microstructure of fish cracker (‘keropok’)
dough. International Journal of Food Science and Technology, 36:741-747.
6. King, M.A. 2002. Development and sensory acceptability of crackers made from the
Big-eye fish (Brachydeuterus auritus), Food and Nutrition Bulletin, 23 (3): 317-320.
7. Peranginangin, R., Fawzya, Y.N., Sugiyono, I.J. and Muljanah, I. (1996). Food additives
and effect of thickness on fish crackers quality. Proceedings of the seminar on the advances in fish processing technology in Southeast Asia in relationship to quality management. Marine Fisheries Research Department Southeast Asian Fisheries Development Centre in collaboration with the government of Japan, Oct 29-Nov 1, pp: 106-114.
8. Jamilah, B., Yaakob B.C.M. and Thean L.C. (1998). Antioxidant activity of citrus hystrix
peel extract in red palm olein during frying of fish crackers. Journal of Food Lipids, 5:
149-157.
9. Huda, N, Abdullah, A. and Babji, A.S. (2001). Substitution of tapioca flour with surimi
powder in traditional crackers (keropok Palembang). 16th Scientific Conference of
Nutrition Society of Malaysia, Kuala Lumpur.
10. AOAC., (2000). Official Methods of Analysis. Association Official Analytical Chemists.
Washington D.C.
11. Mohamed, S., Abdullah, N. and Muthu, M. K. (1988). Expansion, oil adsorption, elasticity
and crunchiness of keropok (fried crisps) in relation to the physico-chemical nature starch flours. In: Maneepun, S., Varangoon, P. and Phithakpol, B. (Eds.). Food Science and Technology in Industrial Development, pp. 108-113. Bangkok, Institute of Food Research and Product Development.
12. Tee, E.S., Noor, M.I., Azudin, M.N. and Idris, K. (1997). Nutrient composition of
Malaysian foods: 4th Edition. Malaysian Food Composition Database Programme.
Institute for Medical Research, Kuala Lumpur.
13. Serdaroglu, M. and Degırmencioglu, O. (2004). Effects of fat level (5%, 10%, 20%) and
corn flour (0%, 2%, 4%) on some properties of Turkish type meatballs (koefte). Meat
Science, 68, 291–296.
14. Crosland A.R., Ronald, L.S.P. Rosemary-Catriona A. S. and Kevin, D.H. (1994).
Investigation of methods to detect mechanically recovered meat in meat products-I:
chemical composition, Meat Science, 40, 289-302.
15. Siaw, C.L., Idrus, A.Z. and Yu, S.Y. (1985). Intermediate technology for fish cracker
16. Rosmawaty P., Yusro, N.F. and Sugiyono, I.J. (1996). Food additives and effect of thickness on fish crackers quality. In: Kuang, H.K., Kim, L.L. and Yong L.P. (Eds.). Proceedings of the seminar on the advances in fish processing technology in Southeast
Asia in relation to quality management, pp. 106-114, Indonesian Marine Fisheries
Research Department and Southeast Asian Fisheries Development Centre.
17. Cheow, C.S., Yu, S.Y, Howell, N.K., Che Man, Y. and Muhammad K. (1999). Effect of
fish, starch and salt contents on the microstructure and expansion of fish crackers