Siloam Hospitals
Company Focus
Patricia GabrielaInitiate coverage on SILO with BUY
We initiate SILO with a Buy rating as company has been able to deliver a strong double-digit top line growth. Supported with its network across Indonesia (20 hospitals and 17 clinics in total), we believe SILO will have more upside in terms of patient volume that translates to a prom-ising top line growth. The industry is still underpenetrated; and with MIKA already priced in, we think that SILO might catch up the laggard.
Aggressive hospital development: 4 hospitals per year
SILO managed to add 4-5 hospitals per year in last four years to its hospital group through greenfield and acquisition. We forecast SILO to add another 4 hospitals/year (lower than company’s guidance of 8-10 hospitals), but only 1 hospital for 2015F due to delay in permit. We view that our hospital expansion forecast is still realistic considering the his-torical data and construction progress of some hospitals.
Positive growth from BPJS program
SILO has recorded robust patient volume growth with 18% CAGR 2012-14. In 2014, patient from BPJS program contributes 6% to total patient volume albeit only 7 hospitals registered. Given hospital business’ high operating leverage and SILO’s currently low occupancy rate, enrolling in BPJS program makes sense as it should improve asset turnover and therefore ROE (ROE to rise from 7% in 2015 to 11% in 2017).
Asset-light business model
In order to be able to ramp up its expansion plan, SILO uses light-asset business model for its greenfield expansion. SILO does not own majority of land and building of its hospitals. Of 20 hospitals, 12 is rented, 4 is owned, and 4 is rented from 3rd parties. SILO’s rental expense is ~3% of net revenue.
Valuation: BUY with TP of Rp 15,500
We recommend SILO at Rp 15,500 using DCF method (WACC of 10%, LTG of 3%). Our TP implies 2016-17F EV/EBITDA of 28.1x and 23.8x respectively.
Siloam Hospital Group is the leader of in-tegrated healthcare services in Indone-sia. It operates 20 hospitals in total with more than 3,900 bed capacity.
Share Price Rp 12,300
Reuters Code SILO.JK
Bloomberg Code SILO.IJ
Issued Shares 1,156
Mkt Cap. (Rpbn) 14,220
Avg. Value Daily 6
Month (Rpbn) 49.1
52-Wk range 17100 / 11275
PT Megapratama Karya Persada 60.5%
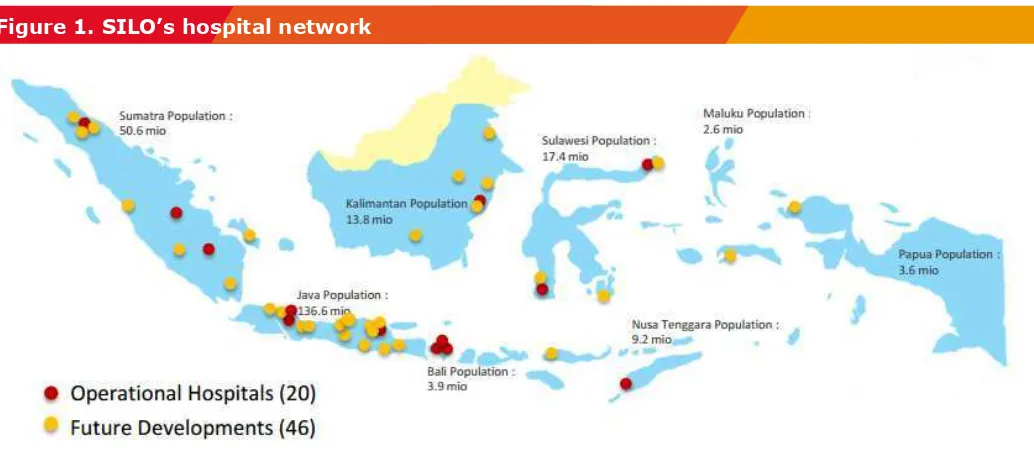
Hospital network across Indonesia
In 1H15, SILO operates 20 hospitals across Indonesia. Management targets to have more than 50 hospitals by 2017F with 8-10 hospital expansion per year. However, we are being realistic as we forecast company to add 4 hospitals per year. In 2015F, we assume SILO to add only 1 hospitals as management confirmed that they’re lagging in hospital development due to problem in license. Once license has released, company is ready to open its hospital in Yogyakarta. Aside from hospitals, SILO also operates 17 clinics that serves as a feeder for BPJS patients.
Figure 2. SILO’s operational beds Figure 1. SILO’s hospital network
In order to differentiate its hospital from others, SILO established center of excellence in each of its hospitals. Moreover, SILO acquired BIMC Kuta and BIMC Nusa Dua in 2013 to achieve medical tourism. These hospitals are well known with Australian tourists, thus can support SILO’s vision. In 1H15, distinct market segment (incl. BIMC Kuta and BIMC Nusa Dua) contributes 14% to SILO’s total patient volume.
As of now, SILO has the biggest number of operational bed in Indonesia with 29% CAGR 2011-14.
Source: TRIM Research
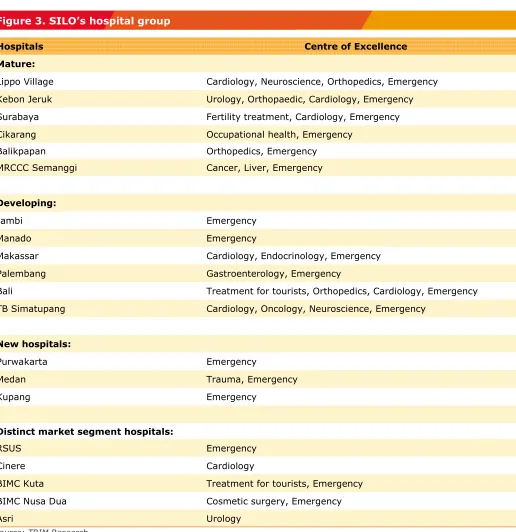
Figure 3. SILO’s hospital group
Source: TRIM Research
Hospitals Centre of Excellence
Mature:
Lippo Village Cardiology, Neuroscience, Orthopedics, Emergency
Kebon Jeruk Urology, Orthopaedic, Cardiology, Emergency
Surabaya Fertility treatment, Cardiology, Emergency
Cikarang Occupational health, Emergency
Balikpapan Orthopedics, Emergency
MRCCC Semanggi Cancer, Liver, Emergency
Developing:
Jambi Emergency
Manado Emergency
Makassar Cardiology, Endocrinology, Emergency
Palembang Gastroenterology, Emergency
Bali Treatment for tourists, Orthopedics, Cardiology, Emergency
TB Simatupang Cardiology, Oncology, Neuroscience, Emergency
New hospitals:
Purwakarta Emergency
Medan Trauma, Emergency
Kupang Emergency
Distinct market segment hospitals:
RSUS Emergency
Cinere Cardiology
BIMC Kuta Treatment for tourists, Emergency
BIMC Nusa Dua Cosmetic surgery, Emergency
One stop care for primary, secondary, tertiary, and quaternary levels
By primary, means SILO provides clinics for corporate clients and gateway to Indonesia’s “Universal Healthcare Coverage” as well as Government Health Insurance Program. As in 1H15, 11 of SILO’s hospitals participates in BPJS program. SILO eagers to be best in class through rapid expansion of hospital network, attracting and re-taining best doctors, and equip hospitals with latest technology. On top of that, SILO also develops integrated centers of excellence and Digital Tele-Medicine.
As SILO serves all class levels, SILO has a higher revenue per patient compared to MIKA. We expect SILO to hike its price by 2% CAGR 2015-20F (vs historical 2-6% CAGR 2012-14). The price increase is expected from a more complex services. In 2011-12, SILO opened comprehensive cancer center and Indonesia’s first Gamma Knife.
Regarding BPJS program, management stated that there is no problem in terms of payment. Once BPJS patient has checked out from hospital, the documents related are collected and checked by verifiers. Management con-firmed that the money can be received ~15 days after the document is verified.
Figure 4. Number of operational beds comparison
Source: TRIM Research
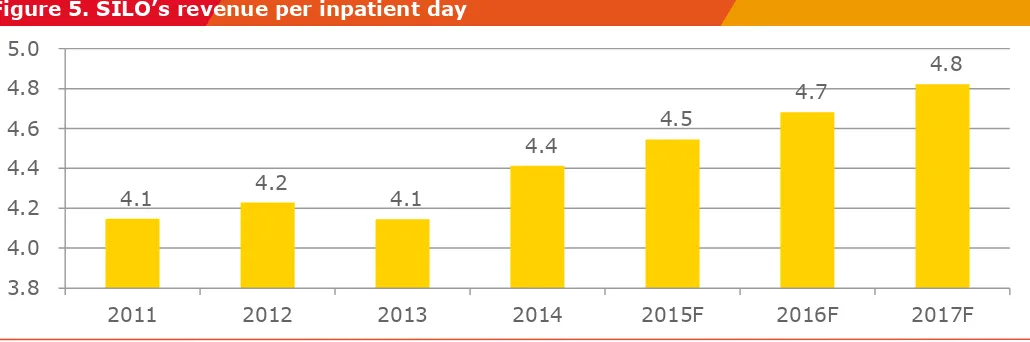
Figure 5. SILO’s revenue per inpatient day
- 500 1,000 1,500 2,000 2,500 3,000 SILO
MIKA Awal Bros Group Sari Asih Group Ramsay Sime Darby Health Care
4.4
4.5
4.7
4.8
Lower occupancy rate due to new and developing hospitals
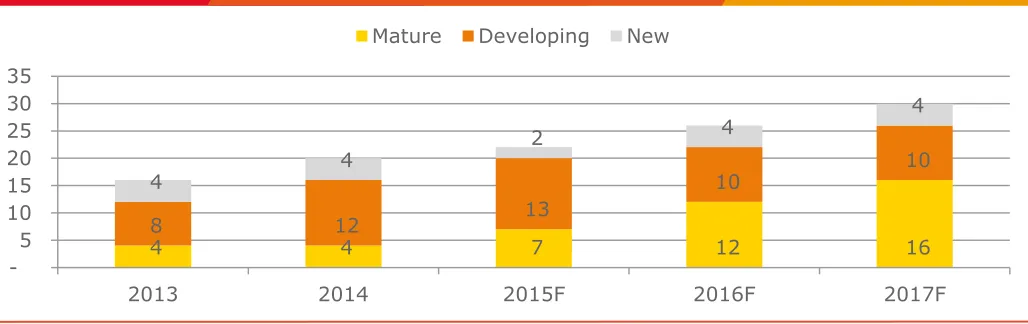
SILO has a slight lower occupancy rate at 53.9%, compared to MIKA at 63.6% in FY14. Need to remind that SI-LO has 4 mature hospitals, 12 developing, and 4 new; while majority of MIKA’s hospitals are considered as ma-ture hospitals. (We base our mama-ture assumption with >3 years of commencing).
A mature hospital tends to have higher occupancy rate; hence, better efficiency. We expect SILO to be able to raise its occupancy rate overtime and a robust patient volume growth of 22% CAGR 2015-20F on the back of more mature hospitals.
Figure 6. SILO’s revenue per outpatient
Source: TRIM Research
Figure 7. SILO’s hospital breakdown
Source: TRIM Research
2011 2012 2013 2014 2015F 2016F 2017F
4 4 7 12 16
2013 2014 2015F 2016F 2017F
Financials
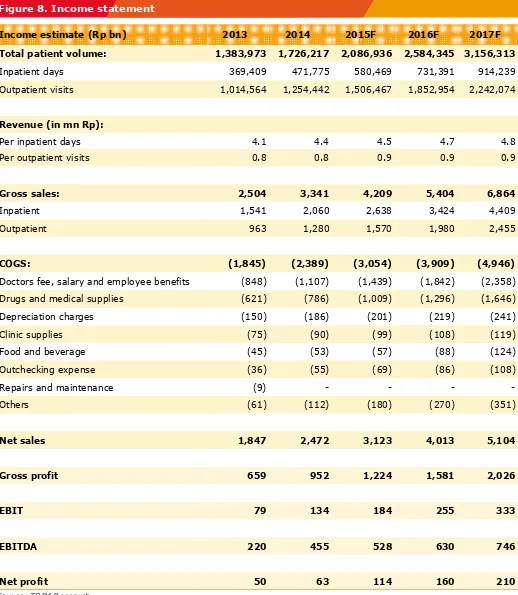
Figure 8. Income statement
Income estimate (Rp bn) 2013 2014 2015F 2016F 2017F
Total patient volume: 1,383,973 1,726,217 2,086,936 2,584,345 3,156,313
Inpatient days 369,409 471,775 580,469 731,391 914,239
Outpatient visits 1,014,564 1,254,442 1,506,467 1,852,954 2,242,074
Revenue (in mn Rp):
Per inpatient days 4.1 4.4 4.5 4.7 4.8
Per outpatient visits 0.8 0.8 0.9 0.9 0.9
Gross sales: 2,504 3,341 4,209 5,404 6,864
Inpatient 1,541 2,060 2,638 3,424 4,409
Outpatient 963 1,280 1,570 1,980 2,455
COGS: (1,845) (2,389) (3,054) (3,909) (4,946)
Doctors fee, salary and employee benefits (848) (1,107) (1,439) (1,842) (2,358)
Drugs and medical supplies (621) (786) (1,009) (1,296) (1,646)
Depreciation charges (150) (186) (201) (219) (241)
Clinic supplies (75) (90) (99) (108) (119)
Food and beverage (45) (53) (57) (88) (124)
Outchecking expense (36) (55) (69) (86) (108)
Repairs and maintenance (9) - - - -
Gross profit 659 952 1,224 1,581 2,026
Others (61) (112) (180) (270) (351)
We forecast SILO to post 25% net profit CAGR in 2015-18F as the group’s hospitals maturing. Note that we as-sume BPJS business will not hurt SILO’s margin (BPJS business is 8% of revenue). Company has assigned a case manager to keep track of BPJS patient in order to manage their ALoS (Average Length of Stay) low. Management stated that they will suffer no loss as long as ALoS for BPJS patient under 4 days.
Source: TRIM Research
Figure 9. Margin outlook (%)
2013 2014 2015F 2016F 2017F
Gross profit 35.7% 38.5% 39.2% 39.4% 39.7%
Operating profit 4.1% 6.8% 7.0% 7.2% 7.2%
EBITDA 11.9% 18.4% 16.9% 15.7% 14.6%
Pretax profit 3.9% 3.8% 5.6% 6.1% 6.4%
Net profit 2.7% 2.5% 3.7% 4.0% 4.1%
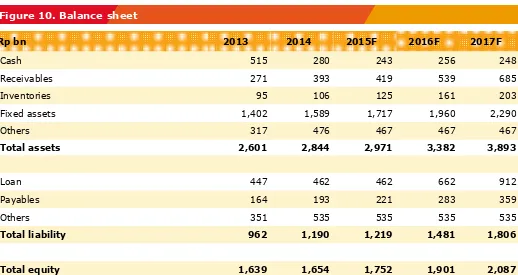
Figure 10. Balance sheet
Source: TRIM Research
Rp bn 2013 2014 2015F 2016F 2017F
Cash 515 280 243 256 248
Receivables 271 393 419 539 685
Inventories 95 106 125 161 203
Fixed assets 1,402 1,589 1,717 1,960 2,290
Others 317 476 467 467 467
Total assets 2,601 2,844 2,971 3,382 3,893
Loan 447 462 462 662 912
Payables 164 193 221 283 359
Others 351 535 535 535 535
Total liability 962 1,190 1,219 1,481 1,806
Valuation
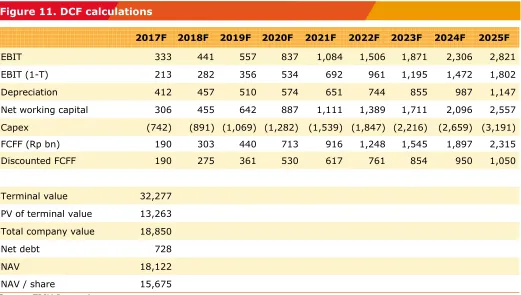
We initiate SILO with a BUY rating at target price of Rp 15,500, +26% upside from current price. We like SILO as company managed to deliver double digit top line growth and continue to serve a strong growth on the back of its aggressive hospital development and participation in BPJS program. We derive our target price using DCF method assuming a WACC of 10% and LT growth rate of 3%.
Our TP implies 2016-17F EV/EBITDA of 28.1x and 23.8x. This is a 38% discount to MIKA (SILO’s only actively traded peer in JCI), respectively. We view the discount should narrow as SILO delivers on its growth promise.
Figure 11. DCF calculations
Source: TRIM Research
2017F 2018F 2019F 2020F 2021F 2022F 2023F 2024F 2025F
EBIT 333 441 557 837 1,084 1,506 1,871 2,306 2,821
EBIT (1-T) 213 282 356 534 692 961 1,195 1,472 1,802
Depreciation 412 457 510 574 651 744 855 987 1,147
Net working capital 306 455 642 887 1,111 1,389 1,711 2,096 2,557
Capex (742) (891) (1,069) (1,282) (1,539) (1,847) (2,216) (2,659) (3,191)
FCFF (Rp bn) 190 303 440 713 916 1,248 1,545 1,897 2,315
Discounted FCFF 190 275 361 530 617 761 854 950 1,050
Terminal value 32,277
PV of terminal value 13,263
Total company value 18,850
Net debt 728
NAV 18,122