ACCA Paper F5
Performance
Management
Class Notes
© The Accountancy College Ltd, July 2009
Contents
PAGE
INTRODUCTION TO THE PAPER 5
CHAPTER 1: COST ACCOUNTING AND NEW DEVELOPMENTS 7
CHAPTER 2: DECISION MAKING AND LINEAR PROGRAMMING 25
CHAPTER 3: PRICING 41
CHAPTER 4: DECISION MAKING UNDER UNCERTAINTY 53
CHAPTER 5: BUDGETING TYPES 59
CHAPTER 6: BUDGETARY CONTROL 67
CHAPTER 7: BEHAVIOURAL ASPECTS OF BUDGETING 73
CHAPTER 8: QUANTITATIVE AIDS TO BUDGETING 77
CHAPTER 9: STANDARD COSTING 89
CHAPTER 10: BASIC VARIANCES 93
CHAPTER 11: ADVANCED VARIANCE ANALYSIS 107
CHAPTER 12: PERFORMANCE EVALUATION 117
CHAPTER 13: NON-FINANCIAL PERFORMANCE INDICATORS 125
AIM OF THE PAPER
To develop knowledge and skills in the application of management accounting techniques to quantitative and qualitative information for planning, decision-making, performance evaluation and control.
OUTLINE OF THE SYLLABUS
1. Cost accounting techniques.
2. Decision-making techniques including risk and uncertainty.
3. Budgeting techniques and methods.
4. Standard costing systems.
5. Performance appraisal including financial and non-financial measures.
FORMAT OF THE EXAM PAPER
The syllabus is assessed by a three hour paper-based examination.
The examination consists of 5 questions of 20 marks each. All questions are compulsory.
FAQs
How does the new syllabus relate to the papers in the
previous syllabus?
Chapter 1
FORMULAE SHEET
Learning curve
Y = ax
bWhere: y = average cost per batch
a = cost of first batch
x = total number of batches produced
b = learning factor (log LR/log 2)
LR = the learning rate as a decimal
Regression analysis
y=a+bx
b=
nΣxy
-
ΣxΣy
nΣx
2-
(Σx)
2a=
Σy
bΣx
n
n
Correlation coefficient
r=
nΣxy
-
ΣxΣy
√(nΣx
2-
(Σx)
2)(nΣy
2-
(Σy)
2)
Demand curve
P = a
–
bQ
b = change in price/change in quantity
CHAPTER CONTENT DIAGRAM
Throughput
accounting
Backflush
accounting
Return per factory hour
Cost per factory hour
Throughput accounting ratio
(TPAR)
Decision making
JIT perspective
Reasons for use
Costing methods
Absorption
costing
Activity based
costing
Other costing
methods
Full cost per unit
Issue: Arbitrary cost allocation
Solution: Activity based costing
Accurate product costs
Swap cost units with cost pools
Swap OARs with cost driver rates
Life cycle costing
CHAPTER CONTENTS
ABSORPTION COSTING
–
REMINDER --- 11
ABSORPTION COSTING --- 11
ACTIVITY BASED COSTING --- 12
ACTIVITY BASED BUDGETING (ABB) --- 17
LIFE CYCLE COSTING --- 18
TARGET COSTING --- 19
JUST IN TIME (JIT) --- 20
THE JIT CONCEPT 20 CHARACTERISTICS OF JIT SYSTEM 20 BOTTLENECKS 20 TREATMENT OF BOTTLENECKS 20
THROUGHPUT ACCOUNTING --- 21
ABSORPTION COSTING
–
REMINDER
The linking of all costs to the cost unit to prepare a full cost per unit.
Uses
1. Stock Valuation
2. Pricing decisions
3. Budgeting
ABSORPTION COSTING
Overhead absorption is achieved by means of a predetermined Overhead Absorption Rate.
Overhead Absorption Rate
=
Activity of Level Budgeted Overheads Budgeted
Example 1
A company produces 2 products in 3 departments. Relevant product information is:
Product A Product B
Direct material cost (£) 20 35
Direct labour cost in Department X (£) 20 30
Direct labour cost in Department Y (£) 25 25
Direct labour cost in Department Z (£) 10 0*
Budgeted number of units 2,000 1,600
* Product B does not pass through department Z.
The labour rate is £6 per hour in each department.
The Budgeted Departmental Overheads are:
Department X £11,000
Department Y £5,400
Department Z £40,000
Required
Calculate the cost/unit using:
(a) Separate OARs for each department, based on labour hours.
(b) An overall OAR, based on labour hours.
ACTIVITY BASED COSTING
A response to the difficulties in applying absorption costing in complex manufacturing environments. Use of absorption costing is likely to lead to inaccurate product costs per unit in such circumstances and hence reduce the usefulness of the information to the management accountant.
Traditional overhead analysis
Recent changes in manufacturing
The reason for the increasing inaccuracy of absorption costing is due to two basic issues:
1. Increased production complexity.
2. Increased proportion of overhead costs.
Production complexity
A wide variety of production processes have become more complex in recent years in a number of ways:
1. Flexible manufacturing systems allow for a number of widely differing products to be produced on the same machinery. Absorbing overhead on a simple volume base is unlikely to reflect the differing overhead costs incurred by each product.
2. Fast product development may mean that a number of differing iterations of the same product may be produced in quick order. With such products having differing production volumes again a volume base is unlikely to work.
3. Wider product ranges lead to a more complex cost analysis.
Increased proportion of overhead costs
Overheads have increased in importance as a percentage of total costs due to both the substitution of direct labour with indirect labour as companies mechanise to a greater degree. Also the increased production complexity outlined above has given rise to increased costs for such disciplines as production planning and logistics.
A revised analysis - ABC
Overhead Cost Item
Cost Unit Cost
Example 2
–
Hensau Ltd
Hensau Ltd has a single production process for which the following costs have been estimated for the period ending 31 December 20X1:
£
Material receipt and inspection costs 15,600
Power costs 19,500
Material handling costs 13,650
Three products - X, Y, and Z are produced by workers who perform a number of operations on material blanks using hand held electrically powered drills. The workers are paid £4 per hour.
The following budgeted information has been obtained for the period ending 31 December 20X1:
Product X Product Y Product Z
Production quantity (units) 2,000 1,500 800
Batches of Material 10 5 16
Data per product unit:
Direct material (square metres) 4 6 3
Direct material cost (£) 5 3 6
Direct labour (minutes) 24 40 60
No. of power drill operations 6 3 2
Overhead costs for material receipt and inspection, process power and material handling are presently each absorbed by product units using rates per direct labour hour.
An activity based costing investigation has revealed that the cost drivers for the overhead costs are as follows:
Material receipt and inspection: Number of batches of material
Process power: Number of power drill operations
Material handling: Quantity of material (square metres)
handled
Required:
(a) Prepare a summary which shows the budgeted product cost per unit for each
product of X, Y, and Z for the period ending 31 December 20X1 detailing the unit costs for each cost element using:
(i) the existing method for the absorption of overhead costs and
(ii) an approach which recognises the cost drivers revealed in the activity based costing investigation.
(22 marks)
(b) Explain the relevance of cost drivers in activity based costing. Make use of figures from the summary statement prepared in (a) to illustrate your answer.
(8 marks)
Classification of activities
Cooper classified activities into three major categories that drive expenses. They are:
1. unit-level
2. batch-related
3. product-sustaining.
Benefits and limitations
Benefits
1. More accurate product costing.
2. Is flexible enough to analyse costs by activity providing more useful costing data.
3. Provides a reliable indication of long-run variable product cost.
4. Helps understanding of cost.
5. Provides a more logical basis for costing of overhead.
Limitations
1. Cost vs benefit.
2. ABC information is historic and internally.
3. Difficult to apply in practice.
Exercise 3
The following budgeted information relates to Brunti plc for the forthcoming period.
Products XYI (000s) YZT (000s) ABW (000s)
Sales and production (units) 50 40 30
£ £ £
Selling Price (per unit) 45 95 73
Prime cost (per units) 32 84 65
Hours Hours Hours
Machine department (machine hours per unit) 2 5 4
Assembly department (direct labour hours per unit)
7 3 2
Overheads allocated and apportioned to production departments (including service cost centre costs) were to be recovered in product costs as follows.
● Machine department at £1.20 per machine hour
● Assembly department at £0.825 per direct labour hour
You ascertain that the above overheads could be re-analysed into 'cost pools' as follows:
Cost pool £000 Cost driver Quantity for the period
Machining services 357 Machine hours 420,000
Assembly services 318 Direct labour hours 530,000
Set-up costs 26 Set-ups 520
Order processing 156 Customer orders 32,000
Purchasing 84 Suppliers' orders 11,200
941
You have also been provided with the following estimates for the period:
Products
XYI YZT ABW
Number of set-ups 120 200 200
Customer orders 8,000 8,000 16,000
Suppliers' orders 3,000 4,000 4,200
Required
(a) Prepare and present profit statements using:
(i) conventional absorption costing, and (7 marks)
(ii) activity based costing (12 marks)
(b) Comment on why activity based costing is considered to present a fairer
valuation of the product cost per unit. (5 marks)
Total 25 marks
ACTIVITY BASED BUDGETING (ABB)
● Activity based budgeting extends the use of ABC from individual product
costing , for pricing and output decisions, to the overall planning and control systems of the business.
● The basic principle of ABB is that the work of each department for which a budget is to be prepared is analysed by its major activities, for which cost drivers may be identified. The budgeted cost of resources used by each activity is determined (from recent historical data) and, where appropriate, cost per unit of activity is calculated.
LIFE CYCLE COSTING
A new form of costing developed to confront two increasingly important problems associated with modern competitive pressures. They are:
1. Shorter product life-cycles.
2. Increased product development costs.
Life-cycle costing is where costs are totalled for the whole life of the project and
„spread‟ equitably over the products expected life volume.
Total life costs for product
Life Cost per Unit =
Total expected life volumes
Companies operating in an advanced manufacturing environment are finding that about 90 - 95% of a product‟s life-cycle cost is determined by decisions made at
the inception of the product‟s life.
This may include costs incurred on product design, development, programming, process design and asset acquisition. This has created a need to ensure that the tightest controls are at the design stage, because most costs are committed or
“locked-in” at this point in time.
Key considerations arising from life-cycle costing are:
● maximize the life of the product
● design cost reduction of the product
● accelerate the time to market.
Management accounting systems
The key to successful application of life-cycle costing is to ensure that the systems developed to provide the costing information in the design stage are consistent with
the systems that are subsequently used to „value‟ the product in production. This
should lead to the following:
1. Ensuring as much as possible that product costs are recouped over the life of
the product.
2. A better understanding of the significance of the life of a product on overall profitability of the business.
TARGET COSTING
Traditional costing systems:
1. Calculate unit cost.
2. Add profit margin.
3. Equals Selling price.
This means that a product is designed, the unit costs calculated and price set without reference to the market, or what the customer is prepared to pay.
Target costing steps:
1. Determine possible selling price – with reference to the market/customer and taking into consideration the specification of the product.
2. Establish the required profit margin – this is based upon the overall required return of the business and the level of perceived risk of the product
3. Calculate the target cost – ie the cost that the company must produce at in order to be able to achieve the required profit level (Selling price – profit margin)
4. Close the gap – reduce the cost from the original expected cost to the target cost.
Close the gap
The target cost will usually be very much lower than the initial cost estimates for a product. In target costing the emphasis is on 'closing the gap' between the two. This can only be done at the design stage. Once the product is in production the cost base is already determined and difficult to reduce materially.
Design stage
Significant cost savings can only be made prior to commencing production and hence the primary use of target costing is at the design stage where by iterative design the cost base can be progressively reduced.
Although there are many ways this can be achieved, two in particular can dramatically reduce product costs:
● Reduce component count – attempt to produce the same specification but
using fewer individual material inputs.
● Reduce production complexity – try to produce the same product but in a
simpler manner.
The very act of reducing the component count is likely to reduce the complexity associated with producing the product. Any reductions in cost must be made without damaging the quality of the product.
JUST IN TIME (JIT)
The JIT concept
● This is defined as the workflow organisation technique to allow rapid, high quality, flexible production whilst minimising stock levels and manufacturing waste. (Bromwich & Bhimani)
● In practice, this means producing components only when they are needed and
in the quantity that is need. This shortens lead times and virtually eliminates work in progress and finished goods inventories.
Characteristics of JIT system
Elimination of waste (in the form of time and defects), reduced set-up time, reduced lot-size, and a smaller pool of suppliers. Use of non domestic suppliers can possibly hinder efforts at JIT implementation of materials procurement.
Bottlenecks
● A bottleneck resource is a limiting factor that constraints production. It is therefore also known as a key resource. If a bottleneck cannot be eliminated, it should be used to 100% of its availability.
● Steps to maximise the output within a JIT process
● Identify the bottleneck ie the process that limits the level of activity that the
overall operation can sustain
● Maximise output of the bottleneck resource
● Scale back production of all other process to avoid stock-building and possibly
make cost savings
● Attempt to ease the bottleneck either through internal processes by
investment or changing the manner in which the process is done or using an external provider
● Start again by identifying the next bottleneck
Treatment of bottlenecks
● Bottlenecks can be identified by profiling capacity usage through the system.
Usually they will be areas of most heavy usage. Thus monitoring build ups of inventory and traditional idle time and waiting time will indicate actual or impending bottlenecks.
● Traditional efficiency measures will be important bottlenecks. Changes in
THROUGHPUT ACCOUNTING
In throughput accounting, only material costs are variable. Direct labour is treated as a fixed cost and is combined with all other operating expenses and included as a period cost. Therefore, inventory is valued at material cost only.
Throughput accounting is designed for use in JIT manufacturing environment.
Throughput can be maximised when minimising materials cost and maximising selling price per unit and sales volume.
In throughput accounting profitability is determined by the rate at which revenue is generated and also by the rate at which goods are produced to meet customer demand.
Key Terminology (Please note the similarity to marginal costing terminology that we already know)
Marginal costing
Throughput accounting
Variable Cost = Direct Material Cost
Fixed Cost = Total Factory Cost
(Including labour cost)
Contribution
(Sales – Variable Cost)
= Throughput
(Sales – Direct Material Cost)
Measures
Return per Factory Hour = Throughput per unit
Factory hours per unit
Cost per Factory Hour = Total factory cost
Total factory hours
Throughput Accounting Ratio
(TPAR)
= Return per factory hour
Limitations of throughput accounting
● Selling price could be uncompetitive
● Material suppliers may not be reliable
● Product quality is low
● Need to deliver on time
● Very little attention is paid to overhead costs
● Ignores market developments, product developments and the stage the
BACKFLUSH ACCOUNTING
Backflush accounting is a product costing approach, used in a Just-In-Time (JIT) operating environment, in which costing is delayed until goods are finished.
Backflush accounting focuses on the output of an organisation and then works backwards when allocating costs between cost of goods sold and inventories. Therefore, backflush accounting simplifies costing since it ignores both labour variances and in-progress. In practice there will be a small amount of work-in-progress in the system at any point in time.
In backflush accounting, costs are applied to products at a very late stage of the production cycle. Standard costs are then flushed backward through the system to assign costs to products. Therefore backflush accounting eliminates the need for tracking of costs. Standard costs are used to assign costs to units and to flush costs back to the points at which inventories remain.
In situations where inventory levels remain low, most of tha manufacturing costs will form part of cost of sales rather than being deferred into inventory. As a consequence, there is little benefit in tracking the costs of stock movements through work-in-progress, cost of sales, and finished goods inventory. Therefore backflush accounting reduces the volume of accounting transactions which would be recorded in a conventional costing system. In keeping with a just-in-time philosophy the recording of such transactions can be regarded as a non-value added activity.
Backflush accounting is employed where the overall cycle time is relatively short and inventory levels are low.
Backflush accounting is suitable for companies operating a JIT system and companies who have low inventory levels and in which the majority of the manufacturing costs are part of cost of sales rather than being deferred to inventory.
Chapter 2
CHAPTER CONTENT DIAGRAM
Decision Making
Contribution
Analysis
Relevant Cost
Analysis
Limitations and
Constraints
Make or buy decision
Shutdown decision
Limiting factor decision
Further processing decision
CVP Analysis
Relevant costs
Opportunity cost
Material analysis
Labour analysis
Objective function
Constraints
Graphical solution
Interpretation
CHAPTER CONTENTS
DECISION MAKING --- 28
CONTRIBUTION ANALYSIS 28
RELEVANT COST 32
LINEAR PROGRAMMING --- 36
DECISION MAKING
The choice between two or more alternatives, decision making normally considers only the short term consideration of maximising profitability. We base our decisions on relevant costs.
Contribution analysis
One aspect of decision making is closely linked to the impact of a change in the level of activity. In these situations the decision is based upon the variable costs or contributions generated. Fixed costs are not affected by activity and hence can be ignored.
Make or buy decision
The decision to make a component or product „in-house‟ or to buy from an outside supplier. The underlying assumption of this decision is that all fixed costs of manufacture are general to the organisation as a whole and hence only the marginal cost of making the component is relevant.
Decision criteria : Compare marginal cost of making to the purchase price (the marginal cost of buying).
Example 1
Clemence Ltd produces a number of components, two of which he is considering buying in, components X and Y.
Cost of making (£) X Y
Variable 14 28
Fixed 4 4
Total 18 32
Purchase price 17 25
(from outside supplier)
Required
Should we make or buy in?
Shutdown (discontinuance) decisions
The decision whether to shut down a part or segment of a business. The focus of the question is the impact of the shutdown on the cost base. Revenue will be foregone but which costs will be affected.
The avoidable costs include variable costs and specific fixed costs. Specific fixed costs are those costs specific to the part or segment of the business to be shutdown. General fixed costs will not be relevant.
Example 2
Jones Ltd operates three divisions within a larger company. The CEO has been shown the latest profit statements and is concerned that division C is losing money.
You are required to advise her whether or not to close down division C.
Division A B C
(000s)
Sales 100 80 40
Variable costs 60 50 30
Fixed costs 20 20 20
Profit/(loss) 20 10 (10)
You are also informed that 40% of the fixed cost is product specific, the remainder being allocated arbitrarily to the divisions from head office.
Required:
Should division C be shut down?
Limiting factor decision
Where there is a factor of production that is limited in some way
1. Scarce raw materials.
2. Shortage of skilled labour.
3. Limited machine capacity.
4. Finance (see capital rationing in FM).
Aim : Maximise the contribution per unit of limiting factor
Steps: 1. Contribution per unit of sale.
2. Contribution per unit of scarce resource.
3. Rank in order of 2 - highest first.
4. Use up the resource in order of the ranking.
Example 3
Neal Ltd produces two products using the same machinery. The hours available on this machine are limited to 5000. Information regarding the two products is detailed below:
Products (per unit data) M N
Selling price (£) 40 30
Variable cost (£) 16 15
Fixed cost (£) 10 8
Profit (£) 14 7
Machine hours 8 3
Bud. sales (units) 600 500
Required:
Example 3 (b)
Using the previous example the company is now able to buy in the products at the following costs
Products (per unit data) M N
Purchase price(£) 24 21
Required:
What is the revised production schedule and the maximum profit earned.
Further processing decisions
Aim: Compare incremental costs and revenues
Example 4
Heighway Ltd operates a joint process from which four products arise. The products may be sold at the separation point of the process or can be refined further and be sold at a premium. Information regarding the products and the refining process can be found below:
Product E F G H
Selling price –
at the split-off point 12 16 15 18
After further processing 20 23 25 22
Costs
Joint process cost per unit 8 8 8 8
Refining cost per unit 5 5 5 5
Specific fixed cost (total) 1,000 2,000 3,000 4,000
General fixed cost (total) 20,000
Budgeted units 2,000 500 5,000 6,000
Required
Which products should be further processed?
CVP analysis (breakeven analysis)
An understanding of the relationship between the level of activity and costs and revenues.
Terminology
Marginal Cost
The sum of the variable costs
Contribution
Either 1. the net of sales and variable costs.
Or 2. the contribution towards covering fixed costs and making a profit.
Breakeven
The level of activity at which neither a profit nor a loss is made.
Key idea.
SALES - VARIABLE COSTS = CONTRIBUTION = FIXED COSTS +
PROFIT
Group Task
Given the following information calculate the breakeven point and the level of activity at which profits are £20,000.
Hughes Smith
Variable cost per unit £20 £300
Selling price £40 £350
Fixed cost £10,000 £5,000
Relevant cost
There are 3 components to a relevant cost:
1. Future
2. Cash flow
3. Arising as a direct result of the decision
Relevant costs Non-relevant costs
Opportunity cost Sunk cost
Incremental cost Committed cost
Variable cost Fixed O/H absorbed
Avoidable cost Depreciation (non cash flows)
Opportunity cost
The benefit foregone by choosing one alternative in preference to the next best alternative.
Example 5
A lecturer is being timetabled for the coming year, she has expressed a desire to teach in London. The courses she alone can do, in a specific week, generate the following contributions:
£
London 1200
Croatia 1500
Moscow 2100
Required
What is the opportunity cost of working in:
(a) London?
(b) Croatia?
(c) Moscow?
Avoidable costs
Variable costs
Those costs which vary proportionately with the level of activity. As seen above the variable nature of the cost often makes it more likely to be relevant. We should already know that the variable cost is useful for break-even analysis or any other form of contribution analysis.
Incremental costs
Those additional costs (or revenues) which arise as a result of the decision. This classification is particularly useful for further processing decisions, but may be used as a basis for tackling any relevant cost analysis.
Material costs flow chart
Next question
Purchase price is
relevant
Replacement cost
is relevant
Next question
Opportunity cost
is relevant
Nil value with
possible disposal
cost
Is the
material in
stock?
YES
NO
Is the material in
constant use?
YES
NO
Is the material
scarce?
Example 6 Tricks
You are the management accountant of Tricks an organisation which has been asked to quote for the production of a pamphlet for an event. The work could be carried out in addition to the normal work of the company. Due to existing commitments, some overtime working would be required to complete the printing of the pamphlet. A trainee has produced the following cost estimate based upon the resources required as specified by the operations manager:
£ Direct materials:
- paper (book value) 4,000
- inks (purchase price 2,400
Direct labour: - highly skilled 250 hours @ £4.00 1,000
- semi-skilled 100 hours @ £3.50 350
Variable overhead 350 hours @ £4.00 1,400
Printing press depreciation 200 hours @ £2.50 500
Fixed production costs 350 hours @ £6.00 2,100
Estimating department costs 400
______
12,150
YES
Next question
Hourly rate is
relevant
Next question
Nil value
Overtime rate is
relevant
Opportunity cost
is relevant
Is the labour
in permanent
employment?
YES
NO
Is the labour fully
utilised?
YES
NO
Overtime
You are aware that considerable publicity could be obtained for the company if you are able to win this order and the price quoted must be very competitive.
The following notes are relevant to the cost estimate above:
(1) The paper to be used is currently in stock at a value of £5,000. It is of an unusual specification (texture and weight) and has not been used for some time. The replacement price of the paper is £9,000, whilst the scrap value of that in stock is £2,500. The stores manager does not foresee any alternative use for the paper if it is not used on the pamphlet.
(2) The inks required are presently not held in stock. They would have to be purchased in bulk at a cost of £3,000. 80% of the ink purchased would be used in producing the pamphlet. There is no foreseeable alternative use for the remaining unused ink.
(3) Highly skilled direct labour is in short supply, and to accommodate the production of the pamphlet, 50% of the time required would be worked at weekends for which a premium of 25% above the normal hourly rate is paid. The normal hourly rate is £4.00 per hour.
(4) Semi-skilled labour is presently under-utilised, and 200 hours per week are currently recorded as idle time. If the printing work is carried out, 25 unskilled hours would have to occur during the weekend, but the employees concerned would be given two hours time off during the week in lieu of each hour worked at the weekend.
(5) Variable overhead represents the cost of operating the printing press and binding machines.
(6) When not being used by the company, the printing press is hired to outside companies for £6.00 per hour. This earns a contribution of £3.00 per hour. There is unlimited demand for this facility.
(7) Fixed production costs are those incurred by and absorbed into production, using an hourly rate based on budgeted activity.
(8) The cost of the estimating department represents time spent in discussions with the organisation concerning the printing of its pamphlet.
Required:
Prepare a revised cost estimate using the opportunity cost approach, showing clearly the minimum price that the company should accept for the order. Give
LINEAR PROGRAMMING
The aim of decision making is to maximise profit, assuming that the fixed cost does not change, this would mean that we must maximise contribution. Alternatively the aim may be minimise cost to subsequently maximise profit.
Steps
1. Define the problem
2. Objective function
3. Constraints
4. Graph
5. Optimal solution
6. Shadow prices
Illustration
A company makes two products (R and S), within three departments (X, Y and Z). Production times per unit, contribution per unit and the hours available in each department are shown below:
Product R Product S Capacity (hours)
Contribution/unit £4 £8
Hours/unit8 Hours/unit
Department X 8 10 11000
Department Y 4 10 9000
Department Z 12 6 12000
Required
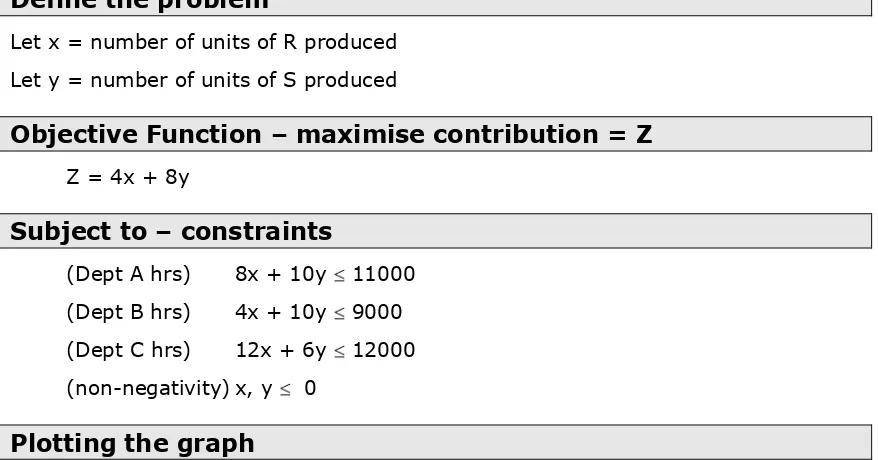
Define the problem
Let x = number of units of R produced
Let y = number of units of S produced
Objective Function
–
maximise contribution = Z
Z = 4x + 8y
Subject to
–
constraints
(Dept A hrs) 8x + 10y 11000
(Dept B hrs) 4x + 10y 9000
(Dept C hrs) 12x + 6y 12000
(non-negativity) x, y 0
Plotting the graph
If we know the constraints we are able to plot the limitations on a graph identifying feasible and non-feasible regions. The linearity of the problem means that we need only identify two points on each constraint boundary or line. The easiest to identify will be the intersections with the x and y-axes.
For example
Dept A hrs – equating the formula 8x + 10y = 11000
If x = O then y =- 1100 Co-ordinates (0, 1100)
If y = 0 then x = 1375 (1375, 0)
And hence
Dept B hrs – 4x + 10y = 9000 (0, 900) (2250, 0)
Dept C hrs – 12x + 6y = 12000 (0, 2000) (1000, 0)
By plotting the individual constraints we build up an area of what is possible within all the constraints ie the FEASIBLE REGION.
Identifying the optimal solution
1. The Iso-contribution (IC line) line is plotted identifying points of equal contribution. The linear nature of the problem means that this line will be a straight line identifying an inverse relationship between the two products.
The IC line is of importance because the relationship of the contribution earned by each product is constant (ie £4 for R against £8 for S). This means that the gradient of the line will remain constant as the total contribution figure gets larger or smaller.
If we „push out‟ the IC line to the point where it leaves the feasible region,
Steps
(i) Choose an arbitrary contribution figure (preferably one that can be easily plotted on the graph just drawn).
Example contribution = Z = £3200
(ii) What are the objective function values?
4x + 8y = 3200
(iii) Translate those values into co-ordinates for plotting on the graph
Co-ordinates (0, 400) and (800, 0)
2. The optimal solution can now be found by interrogating the point at which the
IC line leaves the feasible region to identify the co-ordinates and hence the product mix and maximum contribution.
The intersection or VERTEX identified is where two constraints meet, those constraints can be solved simultaneously to identify the product mix.
a 8x + 10y = 11000
b 4x + 10y = 9000
(a – b) 4x = 2000
x = 500
y = 700
Therefore the optimal product mix is to make and sell 500 units of X and 700 units of Y. The maximum contribution is (500 x 4 + 700 x 8) = £7600.
We can check this point by seeing how much of the constraints are used up:
Dept hours used hours available
A 500 x 8 + 700 x 10 = 11,000 hours 11,000 hours
B 500 x 4 + 700 x 10 = 9,000 hours 9,000 hours
B 500 x 12 + 700 x 6 = 10,200 hours 12,000 hours
SENSITIVITY ANALYSIS
An investigation to identify how the optimum solution will change with changes to individual variables.
The SHADOW PRICE or dual price is the amount by which the total optimal contribution would rise if an additional unit of input (hour) was made available.
Department X
–
shadow price of one hour
If one more hour was available (ie 11,001 hours now), the constraint of department A will relax outward slightly which should improve the overall optimum solution.
Solve the new constraint equations
Dept X 8x + 10y = 11001
Dept Y 4x + 10y = 9000
Revised solution
Revised contribution
Shadow price
Effects – As A increases by 1:
1. x
2. y
3. Contribution
4. Dept Z
Department Y
–
shadow price of one hour
If one more hour was available (ie 9,001 hours now), the constraint of department B will relax outward slightly which should improve the overall optimum solution.
Solve the new constraint equations
Dept X 8x + 10y = 11000
Dept Y 4x + 10y = 9001
4x + 0 = 1999
Revised solution x = 499.75, y = 700.2
Revised contribution 499.75 x 4 + 700.2 x 8 = £7600.6
Shadow price £7600.6 - £7600.0 = £0.6/hour of dept Y
Effects – As Y increases by 1:
1 x decreases by 0.25
2 y increases by 0.2
3 Contribution increases by £0.6
Department Z
–
shadow price of one hour
Chapter 3
CHAPTER CONTENTS
PRICING --- 43
COST-PLUS PRICING --- 44
MARGINAL COST PLUS PRICING --- 45
MARKETING APPROACHES --- 46
PRODUCT LIFE CYCLE 46
PRICING TECHNIQUES 47
FOR NEW MARKETS – MONOPOLY POSITION 47 EXISTING MARKET – NO MONOPOLY POSITION 48
DEMAND BASED PRICING--- 50
DERIVING THE DEMAND CURVE 50
PRICING
The pricing of products or services is one of the more difficult and more important for the organisation. The prices adopted by a company are going to have an immediate effect on the profitability of an organisation and longer term implications on the marketing of the product. There are three ways in which we may calculate the price of the cost unit:
1. Cost-plus pricing - marginal cost or full cost as a base.
2. Marketing based pricing - the aim to generate profit maximisation in the longer term.
COST-PLUS PRICING
The simplest form of pricing, it is still widely used particularly in the retail industry and in specific order costing situations. The price is based on the cost plus a margin.
Cost-plus pricing may be based on:
1. full cost (calculated using absorption costing) or
2. marginal cost.
The rationale behind this method is that if the price is greater than the cost then a profit must be made (providing that the expected volumes are achieved).
Advantages of full cost plus pricing strategy:
● It is believed easy to calculate once the company has made a policy as to whether to use marginal or absorption costing.
● Ensures that all costs are covered and that the company makes a profit
provided that the budgeted figures used in the calculation are reasonably accurate.
● Ensures that selling price is greater than cost of producing the product, so that a firm can generate profits and survive in the future.
● Avoids costs of collecting market information on demand and competitor
activity.
Disadvantages of full cost plus pricing strategy:
● Based on the assumption that demand for the company‟s product is inelastic
and that a change in price will not lead to a significant change in demand. If demand is inelastic firms should increase their price and earn higher revenue and profits because increasing prices will not lead to a fall in demand.
● The absorption basis used to calculate the full cost is often determined
arbitrarily. Depending on the absorption basis used in calculating the total cost, the strategy will produce different selling prices.
● Takes no account of market conditions since its focus is entirely internal. This
means that the selling price of companies adopting this strategy have no resemblance to the prices of competitors.
MARGINAL COST PLUS PRICING
Pricing strategy in which a profit margin is added to the budgeted marginal or variable l cost of the product.
Advantages
● This strategy ensures that fixed costs are covered.
● The size of the mark up can be adjusted to reflect demand.
Disadvantages
● Ignore profit maximisation.
● Ignores fixed overheads. The price may not be high enough to ensure that a
MARKETING APPROACHES
The aim is to maximise the profit over the length of the products life.
Product life cycle
Team task
What are the implications on profitability, cash flow and strategy of each stage in the product life cycle?
Phase
Introduction
Growth
Maturity Decline
Profitability
Cash flow
Strategy
Time Introduction
Growth
Maturity
Decline Level of
Pricing techniques
For new markets
–
monopoly position
Market skimming
The price is set at a high level to generate maximum return per unit in the early units. The aim is to sell to only that small part of the market which is not price sensitive. For market skimming to be effective the company must have a barrier to entry in the form of a patent, brand, technological innovation or other.
Features
1 Low volume, high price
2 Low initial investment in production capacity
3 Low risk, if strategy fails price can be dropped.
Limitations of market skimming strategy
● It is only effective when the firm is facing an inelastic demand curve. If the
long run demand schedule is elastic, market equilibrium will be achieved by quantity changes rather than price changes. Penetration pricing is a more suitable strategy in this case.
● Price changes by any one firm will be matched by other firms resulting in a rapid growth in industry volume. Dominant market share will typically be obtained by a low cost producer that pursues a penetration strategy.
● Skimming encourages the entry of competitors. When other firms see the
high margins available in the industry, they will quickly enter.
● Skimming results in a slow rate of diffusion and adaptation. This results in a
high level of untapped demand. This gives competitors time to either imitate the product or leap frog it with a new innovation.
Penetration pricing
The price is set at a level which should generate demand from the whole market and by so doing encourage an acceleration of the life cycle quickly into growth and maturity phases. Necessary if the market skimming approach is not possible because of a lack of barriers to entry or high initial development costs.
Features
1 Low price, mass market
2 Substantial investment required
3 High risk, the low price is used to deter other competitors
Penetration pricing strategy is appropriate when:
● Product demand is highly price elastic so that demand responds to price
changes.
● The product is suitable for a mass market and there is sufficient demand.
● The product will face competition soon after introduction.
● There is inadequate demand in the low elasticity market segment for price
skimming.
Existing market
–
no monopoly position
Penetration pricing - see above
May also be used in an existing market.
Going rate pricing or average pricing
Where the product is a leading brand (in market share terms) and any change in price made that company will lead to a change by other competitors. Competition will continue in other forms.
Team task
Identify three industries/companies who use going rate pricing.
Premium pricing
The product is able to command a premium due to specific and identifiable features of the product. The premium may be payable for a number of differing reasons such as:
1. Prestige
2. Reliability
3. Longevity
4. Technology
5. Style
Team task
Identify the car manufacturers which use each feature to command a premium for their product.
Discount pricing
The product is sold at a discount to encourage higher sales. This often has the effect of reducing the image of the product because customers equate price with quality.
Team task
Complementary product pricing
Complementary products are products that are goods that tend to be bought and used together. For example computers and software. If sales of one increase, demand for the other will also increase. Also referred to as joint demand.
Captive product pricing
Where products have complements, companies will charge a premium price where the consumer is captured.
Product line pricing
A product line is a group of products that are related to each other.
Product line pricing strategies include setting prices that are proportional to full or marginal cost with the same profit margin for all products in the product line. Alternatively, prices can be set to reflect demand relationships between products in the line so that an overall return is achieved.
Volume discounting
A volume discount is a reduction in price given for purchases of large volume. The objective is to increase sales from large customers. The discount differentiates between wholesale and retail customers. The reduced cost of a large order will compensate for the loss of revenues from offering the discount.
Price discrimination
DEMAND BASED PRICING
The preparation of a price in relation to the demand for a product. This technique considers the demand for a product at a given price by developing a demand curve. Note that this is as far as the F5 paper goes, there is no need to further calculate profit maximising solutions.
Deriving the demand curve
Formula sheet extract
Demand curve
P = a
–
bQ
b = change in price/change in quantity
a = price when Q = 0
Example 1
Biscan
A product sells 500 units at a price of £25 and 700 units at a price of £20.
Required
Assuming a unitary demand curve what is the formula for the demand curve.
Example 2
Mellor
A company presently sells 20,000 units at £12.50 each, the managing director believes that they will be more profitable if they sell 20% more unit at a price of £11 each.
Required
(a) Derive the demand curve.
(b) Calculate the total revenue in each circumstance.
Is the managing director necessarily correct in her assumption?
The demand for a particular company‟s goods will be influenced by 3 main factors:- 1. The Product Life Cycle (PLC). If life cycle is short, a high price strategy is
adopted.
2. Quality of the product. High quality of product can support a high price.
Price elasticity of demand
Price elasticity of demand is the measure of the extent of change in market demand for a good in response to a change in its price. When a small change in price results in more than a proportionate change in demand, the product is said to be elastic, where a change in price results in less than proportionate change in demand, we have price inelastic (e.g. salt). However, where a change in price results in an equal change in demand, we have unitary elastic demand.
Elasticity of demand (Ped) = % change in demand of good X / % change in price of good X.
If the PED is greater than one, the good is price elastic. Demand is responsive to
a change in price. If for example a 15% fall in price leads to a 30% increase in quantity demanded, the price elasticity = 2.0.
If the PED is less than one, the good is inelastic. Demand is not very responsive
to changes in price. If for example a 20% increase in price leads to a 5% fall in quantity demanded, the price elasticity = 0.25.
If the PED is equal to one, the good has unit elasticity. The percentage change in
quantity demanded is equal to the percentage change in price. Demand changes proportionately to a price change.
If the PED is equal to zero, the good is perfectly inelastic. A change in price will have no influence on quantity demanded. The demand curve for such a product will be vertical.
If the PED is infinity, the good is perfectly elastic. Any change in price will see quantity demanded fall to zero. This demand curve is associated with firms operating in perfectly competitive markets.
Other factors affecting elasticity
● Availability of substitutes.
● Complementary products.
● Disposable income.
● Necessities.
Chapter 4
CHAPTER CONTENTS
WHAT IS RISK AND UNCERTAINTY? --- 55
PROBABILITY 55
EXPECTED VALUES 55
DECISION-MAKING CRITERIA 56
WHAT IS RISK AND UNCERTAINTY?
Uncertainty simply reflects that there is more than one possible outcome for a given event.
Risk is where that uncertainty can be quantified in some way. It is normal to quantify the risk in terms of a probability distribution.
Probability
The measurement of the outcomes in terms of their estimated likelihood of occurring.
Overall probability of an event must sum to 1.0 (or if you wish 100%). For example if you toss a coin there is a 0.5 (50%) probability of a head or a tail. Adding both outcomes to total 1.0 (100%)
Expected values
A weighted average value of all the possible outcomes. It does not reflect the degree of risk, but simply what the average outcome would be if the event were repeated a number of times.
Expected value formula
EV = Σ
px
P = probability of an outcome
X = value of an outcome
Example 1
A company expects the following monthly profits:
Monthly profit Probability
£50,000 0.6
£35,000 0.4
Calculate the expected value of monthly profit.
Limitations of expected values
(a) The EV shows a long term average, so that the EV will not be reached in the short term and is therefore not very suitable for one-off decisions.
(b) The accuracy of the results depends on the accuracy of the probability distribution used.
Decision-making criteria
Maximax
The best of the best, a risk taker‟s decision criteria that focuses on maximising the
value of the best possible outcome.
Maximin
The best of the worst, a risk averse decision criteria that focuses on maximising the value of the worst possible outcome.
Minimax regret
A decision criteria that focuses on the opportunity cost. It can be described as the
„sore loser‟ criteria because the comparison of the outcome is against the best possible outcome that could have occurred.
Expected value
The expected value ignores the degree of risk and focuses solely on the average return of the event given repetition of the event.
Example 2
Mr Byornbye is a greengrocer (food seller). He buys a product for £20 per case. He can sell the product for £40 per case on his stall. The product is perishable and it is not possible to store any food, instead any cases unsold at the end of the day can be sold off as scrap for £2 per case.
Purchase orders must be made before the number of sales is known. He has kept records of demand over the last 150 days.
Demand / day Number of days
10 45
20 75
30 30
Required
(a) Prepare a summary of possible net daily margins using a payoff table.
(b) Advise him:
(i) How many cases to purchase if he uses expected values.
(ii) How many cases to purchase if he uses maximin / maximax.
Risk attitudes
Risk seeker
This is where the strategy with the best possible outcome is selected irrespective of the likelihood of it occurring. The maximax criterion will apply in such a situation.
Risk averse
This is where the decision maker will consider the worst outcome each time. The maximin criterion will apply in such a situation.
Risk neutral
Chapter 5
CHAPTER CONTENTS
BUDGETING --- 61
BUDGET 61
FUNCTIONS OF BUDGETING 61
BUDGET PREPARATION 61
TYPES OF BUDGET --- 63
ZERO BASED BUDGETING 63
CONTINUOUS BUDGETING 64
NON-PARTICIPATORY BUDGETING 65
BUDGETING
Budget
A quantitative plan prepared for specific time period. It is normally expressed in financial terms and prepared for one year.
Functions of budgeting
(PCCCEMA)
We can identify the aims of a budget in six ways:
1.
Planning
2.
Control
3.
Communication
4.
Co-ordination
5.
Evaluation
6.
Motivation
7.
Authorisation
Budget preparation
Steps
Budget aims
Strategic aims.
Key assumptions.
Identify the principal budget factor.
1. Sales demand for production environment.
2. Cash resource for non profit making organisation.
Prepare the sales budget
Start with the principal budget factor:
1. Marketing department function.
Prepare all other functional budgets
Prepare each functional budget separately.
Participatory process
1. Local knowledge.
2. Promotes ownership.
Negotiation
Meeting between junior management and senior managers to ensure that the budget is a realistic target. In particular the aim is to eliminate budgetary slack.
Review
Bring all individual functional budgets together to form a master budget, an overall budget for the whole organization.
Budget assessed for:
1. Feasibility
2. Acceptability
Once completed budgeted financial statements and cash flow statements can be prepared.
Acceptance
TYPES OF BUDGET
When looking at differing types of budgeting we are concerned with the benefits or otherwise to the more traditional budget techniques. We would normally expect a budget to be:
1.
Incremental
2.
Periodic
3.
Participatory
In comparison to this we will look at four alternative budgeting types:
1.
Zero based budgeting (ZBB)
2.
Continuous (or rolling) budgets
3.
Non-participatory budgets
4.
Activity based budgeting
Zero based budgeting
A simple idea of preparing a budget from a „zero base‟ each time ie as though there is no expectation of current activities to continue from one period to the next. ZBB
is normally found in service industries where costs are more likely to be
discretionary. A form of ZBB is used in local government. There are four basic steps to follow:
1.
Prepare decision packages
Identify all possible services (and levels of service) that may be provided and then cost each service or level of service, these are known individually as decision packages.
2.
Rank
Rank the decision packages in order of importance, starting with the mandatory requirements of a department. This forces the management to consider carefully what their aims are for the coming year.
3.
Funding
Identify the level of funding that will be allocated to the department.
4.
Utilise
Advantages (as opposed to incremental budgeting)
1. Emphasis on future need not past actions.
2. Eliminates past errors that may be perpetuated in an incremental analysis.
3. A positive disincentive for management to introduce slack into their budget.
4. A considered allocation of resources.
5. Encourages cost reduction.
Disadvantages
1. Can be costly and time consuming.
2. May lead to increased stress for management.
3. Only really applicable to a service environment.
4. May „re-invent‟ the wheel each year.
5. May lead to lost continuity of action and short term planning.
Continuous budgeting
In a periodic budgeting system the budget is normally prepared for one year, a totally separate budget will then be prepared for the following year. In continuous
budgeting the budget from one period is „rolled on‟ from one year to the next.
Typically the budget is prepared for one year, only the first quarter in detail, the remainder in outline. After the first quarter is revised for the following three
quarters based on the actual results and a further quarter is budgeted for.
This means that the budget will again be prepared for 12 months in advance. This process is repeated each quarter (or month or half year).
Advantages (as opposed to periodic budgeting)
1. The budgeting process should be more accurate.
2. Much better information upon which to appraise the performance of
management.
3. The budget will be much more „relevant‟ by the end of the traditional
budgeting period.
4. It forces management to take the budgeting process more seriously.
Disadvantages
1. More costly and time consuming.
Non-participatory budgeting
Some organisations may not require junior management to participate in the budgetary process. This may be because of security or more likely due to centralised nature of the company.
Disadvantages
1. Saves time and money.
2. Individual wishes of senior management will not be diluted by others‟ plans. 3. Reduces the likelihood of information „leaking‟ from the company.
Activity based budgeting
Use of activity based costing principles to provide better overhead cost data for budgeting purposes. The advantages of using such a technique accrue from better cost allocation.
Exam questions will be closely related to the ABC questions we looked at earlier on in the course.
Applicability of ABB
Used in an environment with the following criteria:
1. Complex manufacturing environment.
2. Wide range of products.
3. High proportion of overhead costs.
4. Competitive market.
Benefits of ABB
1. Better understanding of overhead costs.
2. Identifies the accurate relationship between product and activity.
3. Each activity more accurately describes where costs are incurred.
Each and every benefit allows for better control of costs together with the opportunity to reduce the costs using other management accounting techniques.
Key point
Chapter 6
CHAPTER CONTENTS
BUDGETARY CONTROL --- 69
FIXED BUDGET 70
BUDGETARY CONTROL
The use of budgeted data for control purposes. The budget is used as the comparator against which the actual results may be compared. Any differences can then be investigated and appropriate action taken. Budgetary control may also be
called responsibility accounting because it gives individual managers the
responsibility to achieve results.
Example 1 Ogrisovic
A company has the following budgeted and actual information
Units Cost
Budget 1,000 £20,000
Actual 1,200 £22,500
Required
Has the company done better or worse than expected?
If we are now told that £10,000 of budgeted costs are variable, the remainder being fixed: are we able to tell whether the company has done better or worse than expected?
Analyse the
differences
Take action
Revise the
actual
Receive
actual results
Compare to
budget
Fixed budget
A budget prepared at a single (budgeted) level of activity.
Flexible budget
A budget prepared with the costs classified as either fixed or variable. The budget
may be prepared at any activity level and can be „flexed‟ or changed to the actual
level of activity for budgetary control purposes.
Exercise 2
Complete a budgetary control statement using a flexible budgeting approach
Original Budget
Actual Results
Sales Units 1000 1200
£ £
Variable Costs:
Direct Material 10,000 12,500
Direct Labour 15,000 17,000
Variable Overheads
25,000 27,000
Sub-Total 50,000 56,500
Fixed overheads 25,000 33,500
Total Cost 75,000 90,000
Example 3
You have been provided with the following operating statement, which represents an attempt to compare the actual performance for the quarter that has just ended with the budget.
Budget Actual Variance
Number of units sold (000) 640 720 80
____ ____ ____
£000 £000 £000
Cost of sales (all variable)
Materials 168 144 24
Labour 240 288 (48)
Overheads 32 36 (4)
____ ____ ____
440 468 (28)
Fixed Labour cost 100 94 6
Selling and distribution costs
Fixed 72 83 (11)
Variable 144 153 (9)
Administration costs
Fixed 184 176 8
Variable 48 54 (6)
____ ____ ____
548 560 (12)
____ ____ ____
Total Costs 988 1,028 (40)
Sales 1,024 1,071 47
______ ______ ____
Net Profit 36 43 7
______ ______ ____
Required:
(a) Using a flexible budgeting approach, redraft the operating statement so as to
provide a more realistic indication of the variances, and comment briefly on the possible reasons (other than inflation) why they have occurred.
(12 marks)
(b) Explain why the original operating statement was of little use to management.
(2 marks)
(c) (i) Discuss the problems associated with the forecasting of figures which
are to be used in flexible budgeting. (7 marks)
(ii) Further analysis has indicated that the 'variable' overheads for cost of sales are, in fact, only semi-variable. Whilst the budgeted overheads for 640,000 units is indicated to be £32,000, it is felt that the budget for 760,000 units would be £37,000. Included in this later cost is £1,000 incurred when the activity reached 750,000 units due to extra hiring capacity.
Produce a revised flexed budget for the overheads contained in cost of
sales for an activity level of 720,000 units. (4 marks)
(Total 25 marks)
Chapter 7
CHAPTER CONTENTS
BEHAVIOURAL ASPECTS OF BUDGETING --- 75
BEHAVIOURAL ASPECTS OF BUDGETING
It is very easy for the budgetary process to cause dysfunctional activity. For example, if junior management believe that a budget imposed upon them is unattainable, their aim may well be to ensure that the budget is not achieved, thereby proving themselves to be correct.
Otley Illustration
Team task
Identify as many examples of dysfunctional behaviour as you can in the time provided.
Participation
Behaviour studies have shown relationships between budget levels and performance
Top-down budgeting
A budget that is set without allowing the ultimate budget holder to have the
opportunity to participate in the budgeting process. Also called “imposed” budget,
or non-participative.
Bottom-up budgeting
A system