Ground Penetrating Radar And 2-D Geoelectricity Application
For Detecting Landslide In Abang District, Karangasem Regency,
Bali
Rahmat Nawi Siregar
a*, I Ngenah Sinarta
b, Mohammad Ervan
c, Sismanto
da Department of Physics, University of Bangka Belitung, Babel, Indonesia
bDepartment of Civil and Environmental Engineering, Gadjah Mada University, Indonesia c
Geological Survey Center, Bandung, Indonesia
dDepartment of Physics, Gadjah Mada University, Sekip Utara BLS 21 Yogyakarta, Indonesia
ABSTRACT
The potential of landslide in some area in Abang district, Karangasem Regency, Bali, has been identified by using ground penetrating radar and geoelectricity with dipole – dipole configuration. The Research has been conducted in 6 sites. The interpretations of GPR and Geoelectricity revealed the presence of clay (8.52 cm/ns and 11.8 – 18.6 m), saturated sand (12.11 cm/ns and 216 m) and water penetration (3.23 – 4.27 cm/ns and 7.5 – 60 m) at 2 – 5 meter below the subsurface. The slip surface is detected at 5 – 8 m depth. The result of sample laboratory test show high plasticity limit (27.13 – 24.51) and liquid limit (34.50 - 30.00) which leads to landslide phenomenon.
Keywords:
Landslide, Ground Penetrating Radar, Geoelectricity, Plasticity, Liquid limit
I.
INTRODUCTION
Landslide is a phenomenon whereby the driving forces (which is influenced by slope angle, rainfall, mass and spesific weight of mass) are bigger than the resisting forces. The resisting forces are controlled by rock strength, mass compactness and shear force between bedrock and weathering soil. The boundary between bedrock and weathering soil is defined as slip surface[1]. Types of landslide include rotational and translational are triggered by the geometry of slip surface. Curved slip surface produce rotational landslide [2] and both flat and incline slip surface produce translational slide [3]. Although the action of driving forces and resisting forces is the primary factor for a landslide to occur, earthquake has a big contribution for the mass movement [4].
Bali Island has high seismicity level in Indonesia and classified as vulnerable to earthquake [5]. Seismic activity in southern Bali is controlled by subduction of Australia plate and Eurasia plate. Meanwhile, shallow seismicity activity on land is controlled by local faults in north and northeast of Bali Island as a result back arc thrusting which produce Bali basin. The hipocenter is more shallow in the northern Bali [6]. Thats why, northern Bali is vulnerable to geological disaster, especially landslide which is frequently occurs in Karangasem Regency and indicated as landslide high potential risk.
The geology of Karangasem regency is generally controlled by Agung volcano and Seraya
volcano activities. By the northern Karangasem, Quarter formation is produced from Agung volcano products such as agglomerate, tuff, lava and ignimbrite. As a result of Seraya volcano products in the eastern Karangasem regency – Abang district – the geology is mainly volcanic breccia alternating with lava [7]. Seraya volcano has different characteristics with Agung volcano. Since it is not an active volcano for a very long time, so denudation process is more dominant in forming erosion slope which consist of clay, sandy and silt which are easily to pass the water. If the soil is located above the impermeable rock at a specific slope, the incoming water will be retained and the soil at a certain slope will potentially slip to be a landslide [8]
Over the last decade, Landslide observations have been frequently identified by some geophysical methods [9] such as ground penetrating radar (GPR) and geoelectricity [3][1]. Geoelectricity method uses potential difference from electric current which is injected to the earth through two current electrodes. This potential difference provides subsurface information about type and characteristics of electricity from each nonhomogeneous layer [10]. A weathered slip surface is usually shown by lower resistivity than the underlying bedrock [11]. However, the main problem in geoelectricity method is that the resistivity of geological units are overlapping each other. The resistivity is different based porosity and water content of material. This problem can be solved by using another high resolution method,
such as GPR Method. GPR is a well known non destructive geophysical method in providing high resolution image of shallow subsurface (0-10 m). The propogation of radar wave (1-1000 MHz) is based on electromagnetic wave reflection principle. A higher antenna frequency produce a higher resolution of data, but the shallower penetration. The signal is emitted to the ground by transmitting antenna and dielectric constant difference between subsurface will reflect or/and refract the signal. The two way time reflected wave, waveform, antenna position and intensity of signal which is recorded by receiver antenna will give the characteristic of subsurface structure
II.
THE METHOD
Ground Penetrating Radar and geoelectricity with dipole – dipole’s configuration were applied in 6 sites around Abang district in Karangasem Regency.
GPR measurements had been conducted by using GSSI (Geophysical Survey System Inc) SIR – 20 with transducer 200 MHz. The output was line scan wiggle and processed with GSSI RADAN software 5. Furthermore, radagram profile is processed by Reflexwave software. Georadar data processing is started by change radagram display from gray 1 to rainbow 2, and then shows the amplitude’s bar. In order to put arrival time of first wave, static correction was applied. Henceforth, data is filtered by subtract mean (dewow) 1 D filtering. reduce noises after gain processing,. Frequency range of noises are sorted and eliminated, while signal frequency is kept. The next filtering is background removal 2 D or known as background subtraction. Noises which appear in profile are then reduced. Next, traces stack is applied to increase signal to noise ratio (S/N). These tracing steps will enbrighten signal and decreasing signal’s amplitude. The last processing step is F-K filter. This process will filter temporal and spatial frequency, then gives outcome in frequency (F) - wavenumber (k) function. Generally, F-K filter is used to eliminate coherent noise (noise from trace to trace along profile). Radagram interpretation is based on Bares and Haeni diagram as shown in Figure 1 [12]. Geoelectricity measurement had been conducted by using multichannel Super String R8/IP with resistivity output in *stg digital format.
Fig. 1. Subsurface interpretation based on radagram profile [12].
Processing step is started by converting data from *stg as a raw data from resistivity multichannel Super String R8/IP instrumentation, to *dat format by using AGGIS Admin. Henceforth, the data are combined with topography data which is acquired by GPS Garmin. These data will become input data for each research sites in *dat notepad extension. Then, run input data in to Earthimager 2DINV software, so resistivity’s profile of measurement and calculation are obtained.
III.
RESULTS AND INTERPRETATION
3.1. Ban Village SiteThe GPR results were affected by a strong attenuation of the radar waves. Thus, the penetration depth was restricted to 6 -10 m (200 MHz). Near surface sediment structures were detected at 2 – 3 m depth as shown in Figure 2. By the distance 25 – 40 m, radagram profile shows a hummocky reflection configuration with radar wave velocity range 3.33 – 4.21 cm/ns and high amplitude continuity, indicating the water trapped around sediment with velocity range 12.09 – 12.32 cm/ns which interpreted as saturated soil. The layer below it, shows a curved slip surface (At 40 -50 m in horizontal plane and 4 – 6 m depth) which leads to rotational slide.
is around 2783 m , since the upper material shows a weathered soil. The bedrock surface
obviously follows the topography of the landslide block.
Fig.2. Radagram profile of Ban site.
Fig.3. Resistivity profile of Ban site.
3.2. Banjar Buayang Site
Near surface sediment structures were detected at 5 –7 m depth as shown in Figure 4. By the distance 30 – 50 m, radagram profile shows a wavy reflection configuration with radar wave velocity range 3.23 – 4.27 cm/ns and high amplitude continuity, indicating the water trapped around saturated soil such as clay (8.32 – 9.21 cm/ns) and saturated sand (12.03 – 12.49 cm/ns). From 100 – 120 m distance and 3- 4 m depth, the profile indicate saturated soil (8.24 – 13.01 cm/ns) with high amplitude continuity. The layer below sediment structures, shows a linear incline slip surface (At 30 – 42 m in horizontal plane and 5 – 7 m depth) which leads to translational slide. Another slip surface is identified (at 98 – 160 m in horizontal plane and 6 – 8 m depth) which give an explanation for rotational slide possibility. The GPR
result of Banjar Buayang for slip surfaces is confirmed by geoelectricity profile (Figure 5) which shows resistivity range 7.5 – 46 m. At the distance 16 – 36 m, a very sharp boundary between displaced saturated clay (11.8 – 18.6 m) and water (7.5 m) can be recognized..The landslide material is divided into three areas of high resistivity. The position of slip surface (around 18.6 m) coincide with the observed rotation structures of the GPR profile. Another two slip surfaces (leads to rotational slide) can be recognized at 95 -150 m distance with resisivity around 29.3 – 46.0 m , since the upper material shows a weathered soil. The plasticities of soil are 27.13 and 24.51 which are classified as high.
3.3.Geotechnical Parameters
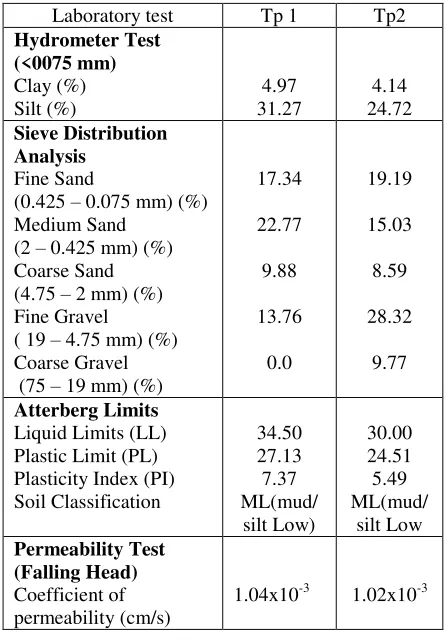
Based on size and characteristics of soil in Sega village as shown in Table 1, the laboratory test shows that clay has 4 – 5 % fines percentage, 24 – 31 % silt, 8 – 22% sand and 0 – 28% gravel with the average of permeability coefficient (kv) at 1.04 10-3 cm/s. The average of any angles of internal resistance and cohesion were 21.80˚ to 29.20˚ and 1kPa to 9 kPa respectively. Atterberg Limits show that liquid limits of soil are high, 34.50 and 30.00
IV.
Experiment and Discussion
Fig. 4. Radagram profile of Banjar Buayang site
Fig.5. Resistivity profile of Banjar Buayang site.
Table 1. The estimation of permeability and water saturation.
Laboratory test Tp 1 Tp2 Hydrometer Test
(<0075 mm) Clay (%) Silt (%)
4.97 31.27
4.14 24.72 Sieve Distribution
Analysis Fine Sand
(0.425 – 0.075 mm) (%) Medium Sand
(2 – 0.425 mm) (%) Coarse Sand (4.75 – 2 mm) (%) Fine Gravel ( 19 – 4.75 mm) (%) Coarse Gravel (75 – 19 mm) (%)
17.34
22.77
9.88
13.76
0.0
19.19
15.03
8.59
28.32
9.77
Atterberg Limits Liquid Limits (LL) Plastic Limit (PL) Plasticity Index (PI) Soil Classification
34.50 27.13 7.37 ML(mud/
silt Low)
30.00 24.51 5.49 ML(mud/
silt Low Permeability Test
(Falling Head) Coefficient of permeability (cm/s)
1.04x10⁻³ 1.02x10⁻³
V.
CONCLUSION
The combination of Ground Penetrating Radar and Geoelectricity for subsurface exploration provided very valuable information for landslide detection in Abang district, Karangasem Regency, Bali. The soil condition of study area is dominated by saturated soil such as clay (8.52 cm/ns and 11.8 – 18.6 m), saturated sand (12.11 cm/ns and 216
m) and water penetration (3.23 – 4.27 cm/ns and 7.5 – 60 m). The slip surface is characterized by higher resistivity at 5 – 8 m below the subsurface. The landslide possibility is confirmed by 698 mm rainfall rate, high plasticity limit (27.13 – 24.51) and liquid limit (34.50 - 30.00) from some soil examples.
ACKNOWLEDGEMENTS
REFERENCES
[1]. Dalimunthe, Y, K., 2014, Identifikasi Daerah Rawan Gerakan Tanah di Kota Liwa Lampung Barat Menggunakan Metode Georadar dan Geolistrik. Master Thesis, FMIPA, Universitas Gadjah Mada, Indonesia.
[2]. Lissak,C., Maquaire, O., Malet, J.P., Lavigne, F., Virmoux, C., Gomez, C., and Davidson, R., 2015, Nat. Hazards Earth Syst. Sci., Vol. 15, 1399 – 1406.
[3]. Sass, O., Bell, R., Glade, T., 2007, Comparison of GPR, 2D-resistivity and traditional techniqued for the subsurface exploration of the Oschingen Landslide, Swabian Alb(Germany), Geomorphology Journal, Vol. 93, 89 – 103.
[4]. Lee, C,T., Huang, C,C., Lee, J,F., Pan, K,L., Lin, M,L., and Dong, J,J., 2008, Statistical Approach to Earthquake-induced Landslide susceptibility, Engineering Geology, Vol. 100, 43 – 58.
[5]. Siregar, R,N., 2015, “Identifikasi Daerah Potensi Likuifaksi Pulau Bali Bagian Selatan Berdasarkan Data Ground Penetrating Radar (GPR), Geolistrik Resistivitas dan Pemboran Teknik”, Master Thesis, FMIPA, Universitas Gadjah Mada, Indonesia.
[6]. Daryono, 2011, “Identifikasi Sesar Naik
Belakang Busur (Back Arc Thrust) Daerah Bali Berdasarkan Seismisitas dan Solusi Bidang Sesar”, Artikel Kebumian, Badan Meteorologi dan Geofisika, Indonesia. [7]. Purbo-Hadiwidjojo,M,M., Samodra, H.,
and Amin, T., 1998, Geological Map Sheet Bali, Nusa Tenggara, Bandung : Geological Research and Development Center
[8]. Sinarta, I, N., Rifa’i, A., Fathani, T, F., and
Wilopo, W., 2015, “Geotechnical
Properties and Geology Age on Characteristics of Landslides Hazards of Volcanic Soil in Bali, Indonesia, International Journal of Geomate, Vol. 11, 2595 – 2599.
[9]. Supper, R., Romer, A., Jochum, B., Bieber, G., and Jaritz, W., 2007, A complex geo-scientific strategy for landslide hazard mitigation from airborne maaping to ground monitoring, Adv. Geosci, Vol. 14, 195 – 200
[10]. Sonkamble, S., Satishkumar, V., Amarender, B., and Sethurama, S., 2013, Combined Ground-Penetrating Radar (GPR) and Electrical Resistivity Applications Exploring Groundwater Potential Zones in Granitic Terrain, Arab Journal Geoscience, Vol. 7, 3109 – 3117.
[11]. Bogolovsky, V.A., Ogilvy, A.A., 1997. Geophysical Methods for the investigation of landslide. Geophysics, Vol. 42, 562 – 571.
[12]. Beres, M., and Haen, F.P., 1991,
![Fig. 1. Subsurface interpretation based on radagram profile [12].](https://thumb-ap.123doks.com/thumbv2/123dok/4013142.1956562/2.595.315.523.83.279/fig-subsurface-interpretation-based-on-radagram-profile.webp)