CHAPTER III
RESEARCH METHODOLOGY
3.1 Research Methodology
Research methodology is “the general approach the researcher
takes in carrying out the research project (Leedy & Ormrod (2001) as cited in (William, 2007)). The main purpose of this research is to know about prospective buyers‟ opinion about English words and quotation in business and in a prototypical product made by the writer which is an initial frame.. Therefore, the writer is going to use quantitative research method to
determine how to find, collect, process and analyze data in this research.
Quantitative research method is defined by Creswell (2003) cited in
(William, 2007) as the numeral or mathematical data collection so that the
data can be quantified into statistical form. The goal in quantitative
method is to determine the relationship between something and another
thing within a population. This method attempts to reduce observational
errors through experimental design such as survey to get the conclusions
by interpreting the existing problems. Thus, quantitative research is
objectively describing and explaining a phenomenon through numerical
3.2 Data Source
Data provided in this research is primary data. 3.2.1 Primary Data
Primary data is a data source obtained directly from the
individual or group who are related to the variable. It can be in the
form of interviews, polls of individuals or groups, or observations
result of an object or event. In this study, questionnaire given to the
respondents was the primary data in this research.
3.3 Data Collection Technique
Data collection techniques are methods used to obtain the data in a
research. Based on the research method used by the writer, data collection
technique in this research includes two instruments as follows:
3.3.1 Questionnaire
A questionnaire is a data collection instrument in the form of list of research questions to respondent, and designed to gain specific information needed (Stay, 2011). Some things need to be concerned in a questionnaire. First, an introduction and procedure should be written. Second, the questions should be using common and effective words. In this research, the writer spread questionnaires to the prospective buyers‟ of initial frame in
The scale measurement used in this research is Likert scale
using ordinal data. This scale is called the Likert scale, because it is
first developed by Rensis Likert, and is often referred to as the method of summated ratings which means that the value of each
answer or response was summed to achieve the total value
(Bertram, n.d.). Respondents were asked to answer questions with
the answer options as follows:
a. Strongly Agree (SA), which has a score of 5,
b. Agree (A), which has a score of 4,
c. Neither (N), which has a score of 3,
d. Disagree (D), which has a score of 2,
e. Strongly Disagree (SD), which has a score of 1.
3.4 The Surveyed Item
The respondents were surveyed as regard English usage in business and English words and quotations in a gift. The gift in the questionnaire as the item of survey is made by the writer as her business which is an initial frame. Initial frame is a custom preserved flowers arrangement in a 3D frame. Usually, the flowers will be arranged according to the first letter of the recipient‟s name or at customers‟ requests form. Inside the frame, there
Figure 3.1 Initial Frame C
Copy right: The Writer
Figure 3.2 Initial Frame J
Copy right: The Writer
Established in January 2018, the writer made an Instagram account
to promote and sell her product named @fleuristic_id. Flowers used in the
initial frame are processed by two different methods; regular and oshibana
method. Regular method is where the flowers are preserved by hanging up
one by one, while oshibana method is a flower preservation method by
Each preservation method has its pros and cons; regular method
has a 3D looks to the flowers since they are hung up to maintain the
shapes and they will be realistic, but for the reason of the oxidation
process, the colors of the flowers may be faded (will be repainted if
necessary). Oshibana method has a crumpled and flat looks since the
flowers are pressed, but the colors are because there is no oxidation
process.
3.5 Population and Sample 3.5.1 Population
Population is a generalization consisting of subjects or
objects that have a specific character set by the researcher to be
studied and drawn the conclusion (Sugiyono, 2011).
The other understanding about population as cited in
(Sugiyarbini, 2012) is from Sabar Rutoto (2007), that population is
all units that become the object of the research. From the
definitions above, the writer concluded that population is the whole
objects to be researched. Populations in this research were the
prospective buyers in Semarang.
3.5.2 Sample
Sample is the part or number and characteristic of the
research all the population – by the reason of money, energy, and
time, the researchers usually take samples from the population.
According to the Semarang Central Bureau of Statistic, the latest update of Semarang population (aged 15 – 35) by August 2017 is 590.798. Because the number of the population is too big and unlikely accessible by the writer, it is classified as infinite population.
3.5.2.1 Sampling Technique
3.6 Respondent Characteristic
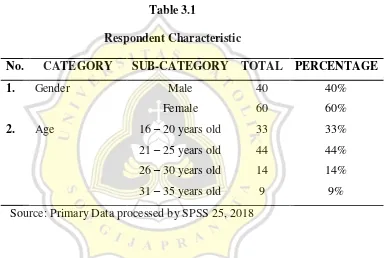
To find out the public opinion about English words and quotation in business and in a prototype product (initial frame), the writer collected the data by a questionnaire. The questionnaire consists of 15 statements and is distributed to 100 respondents. Below are the data of the respondent characteristics:
Table 3.1
Respondent Characteristic
No. CATEGORY SUB-CATEGORY TOTAL PERCENTAGE
1. Gender Male 40 40%
Source: Primary Data processed by SPSS 25, 2018
Table 3.1 shows that 40 or 40% respondents were male and 60 or 60% were female. 33% respondents were 16 – 25 years old, 44% were 21 – 25 years old, 14% were 26 – 30 years old, and 9% were 31 – years old.
3.7 Data Validity and Reliability
The writer has conducted a validity and reliability test before doing
samples. The tests are performed to people who have similar characteristic
to the real respondents.
3.7.1 Data Validity
According to Sugiyono (as cited in (Widi, 2011)), validity is “an index indicating that an instrument could actually measure
something to be measured”. The requirement of a good instrument
is that it is must be valid. An instrument which has high validity
will have a small error rate, so that the data collected are reliable.
In this research, the writer used SPSS (Statistical Product and
Service Solution version 25) to conduct the validity test. The
criteria used will refer to the formula df = total of sample -2 with a
significance level of 5%.
3.7.2 Data Reliability
According to Triton as cited in (Latif, 2014), an instrument
will be reliable if the instrument consistently gives the same result
or answer to the same phenomenon, even if used repeatedly.
Reliability means that the instrument is stable, dependable, and
consistent. The writer did the reliability test by calculating the
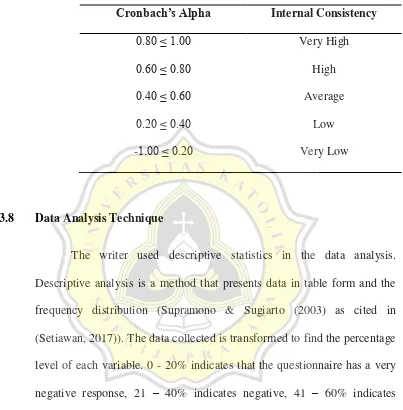
Cronbach‟s Alpha coefficient from each item in the variable. The
instrument is reliable if the value of Cronbach‟s Alpha > 0.6.
Table 3.2
Reliability Level Based on Cronbach’s Alpha
Cronbach’s Alpha Internal Consistency
0.80 ≤ 1.00 Very High
0.60 ≤ 0.80 High
0.40 ≤ 0.60 Average
0.20 ≤ 0.40 Low
-1.00 ≤ 0.20 Very Low
3.8 Data Analysis Technique
The writer used descriptive statistics in the data analysis.
Descriptive analysis is a method that presents data in table form and the
frequency distribution (Supramono & Sugiarto (2003) as cited in
(Setiawan, 2017)). The data collected is transformed to find the percentage
level of each variable. 0 - 20% indicates that the questionnaire has a very
negative response, 21 – 40% indicates negative, 41 – 60% indicates
average, 61 – 80% indicates positive, and 81 – 100% indicates very