EAST ASIAN DEVELOPMENT NETWORK
EADN WORKING PAPER No. 65 (2013)
Harnessing Indigenous and External Agricultural Knowledge Systems
Toward an Indonesian Economic Corridor
(December 2012)
Angelina Ika Rahutami MG. Westri Kekalih S
Ignatius Supriyanto
Faculty of Economics and Business Soegijapranata Catholic University
By
Angelina Ika Rahutami
MG. Westri Kekalih S
Ignatius Supriyanto
Faculty of Economics and Business
Soegijapranata Catholic University
Semarang, Indonesia
Final Report on an EADN Individual Research Grant Project
December 2012
HARNESSING INDIGENOUS AND EXTERNAL
AGRICULTURAL KNOWLEDGE SYSTEMS
ii
Content
CHAPTER 1. INTRODUCTION ... 2
1.1. Research Background and Issues ... 2
1.2. Research Problem and Objectives... 7
1.3. Research Contributions ... 8
CHAPTER 2. LITERATURE REVIEW ... 10
2. 1. Agribusiness ... 10
2. 2. Indigenous Knowledge, Information Diffusion, and Technology Adoption ... 11
2. 3. Factors that Affect Farmers’ Socioeconomic Conditions ... 16
2. 4. Findings from Earlier Research ... 17
CHAPTER 3. RESEARCH METHOD ... 20
3.1. Data and Samples ... 20
3.2. Operational Definitions and Measurement of Variables ... 22
3.3. Methods of Analysis ... 22
CHAPTER 4. ANALYSIS OF SOCIOECONOMIC CONDITIONs, indigenous knowledge, and techonology adoption in GORONTALO AND SOUTH SULAWESI ... 24
4.1. Agricultural Conditions and Policies ... 24
4.2. Overview of Sulawesi Economic Corridor ... 27
4.3. Socioeconomic Condition of the Agricultural Sector ... 30
4.4. Agricultural Development in Gorontalo and South Sulawesi: Issues and Concerns ... 36
4.4.1. Respondent Profile ... 36
4.4.2. Average Harvest and Monthly Spending ... 37
4.4.3. Ideal Natural Conditions for Good Crop Yields ... 40
Figure 4.7 Type of Land Cultivated by Farmer Respondents (Percentage) ... 40
4.4.4. Human Resources for Agriculture ... 41
Source: Statistics Indonesia, 2011 ... 43
4.4.5. Alternative Banking Systems for Farmers ... 43
4.4.6. Infrastructure ... 43
4.4.7. Local Government Policies on Agriculture ... 44
iii
CHAPTER 5. ConclusIon and policy recommendations ... 57
5.1. Discussion ... 57
5.2. Policy Recommendations ... 59
ii
Tables
Table 1.1 Volume and Value of Exports and Imports of Food Commodities
2004-2010 ... 2
Table 1.2 Percentage Distribution of Gross Domestic Product at 2000 Constant Market Prices By Industrial Origin Per Corridor, 2010 ... 5
Table 2. 1 Differentiation between Indigenous and Scientific Knowledge ... 11
Table 4.1 Growth and GDP of Agricultural Sector (excluding fishery and forestry), 2009-2011 ... 24
Table 4.2 Gross Domestic Regional Products Based on Constant Price 2000 Sulawesi Economic Corridor ... 28
Table 4.3 Value and Share of Gross Domestic Product, 2010 ... 30
Table 4.4 Contribution of Agriculture Sector to the Economy 2006-2010 (In Percent) 31 Table 4.5 Socioeconomic Conditions of Gorontalo, South Sulawesi, and Indonesia, 2010... 34
Table 4.6 Farmers’ Term of Trade (FTT) 2010 ... 35
Table 4.7 Respondents’ Profile Based on Sex ... 36
Table 4.8 Respondents’ Profile Based on Age ... 36
Table 4.9 Respondents’ Profile Based on Land Ownership in Gorontalo Provice ... 37
Table 4.10 Respondents’ Profile Based on Land Ownership in South Sulawesi Provice37 Table 4.11 Respondents’ Profile According to Frequency and Average Value of Harvests in Gorontalo Province ... 38
Table 4.12 Respondents’ Profile According to Frequency and Average Value of Harvest in South Sulawesi Province ... 38
Table 4.13 Respondents’ Profile According to Average Monthly Expenditure in Gorontalo Province ... 39
Table 4.14 Respondents’ Profile According to Average Monthly Expenditure in South Sulawesi Province ... 39
Table 4.15 Crops Planted by Respondents... 40
Table 4.16 Respondents’ Perceptions of Land Availability and Fertility in Gorontalo and South Sulawesi Province (percentage of total answers) ... 41
Table 4.17 Respondent Perception of Quality of Supporting Labor in their Areas (Percentage of total answers) ... 42
Table 4.18 Number of Students by Type of School, 2010 ... 43
Table 4.19 Matrix of agricultural Processing Cycle and Connection with Indigenous Knowledge ... 46
Table 4.20 Sources of Agricultural Knowledge (in percent) ... 50
1
Figures
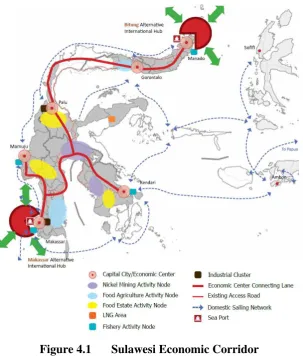
Figure 4.1 Sulawesi Economic Corridor ... 27
Figure 4.2 Contribution of Each Island to Rice Production, 2010 (In Percent) ... 28
Figure 4.3 Maize Production, 2010 (In Kg/Ha) ... 29
Figure 4.4 Harvested Areas and Production of Maize and Rice in Gorontalo, 2000-2011 ... 31
Figure 4.5 Harvested Area of Maize and Rice Production in South Sulawesi 2000-2011 ... 32
Figure 4.6 Productivity of Maize and Rice in Indonesia, South Sulawesi, and Gorontalo 2000-2011 (In Percent) ... 33
Figure 4.7 Type of Land Cultivated by Farmer Respondents (Percentage) ... 40
Figure 4.8 Alang-alang Leaves (Imperata cylindrical) ... 51
Figure 4.9 Hybrid Maize “Bima” Variety ... 52
Figure 4.10 Farmers make a jajar legowo planting line (left) and plants paddies using the jajar legowo system (right) ... 53
Figure 4.11 Jajar Legowo 2:1 (left) and 4:1 (right) ... 54
Figure 4.12 Singkal (left) and Plough (right) ... 54
Figure 4.13 Landak (left) and Gasrok (right picture) ... 55
2
CHAPTER 1.
INTRODUCTION
1.1. Research Background and Issues
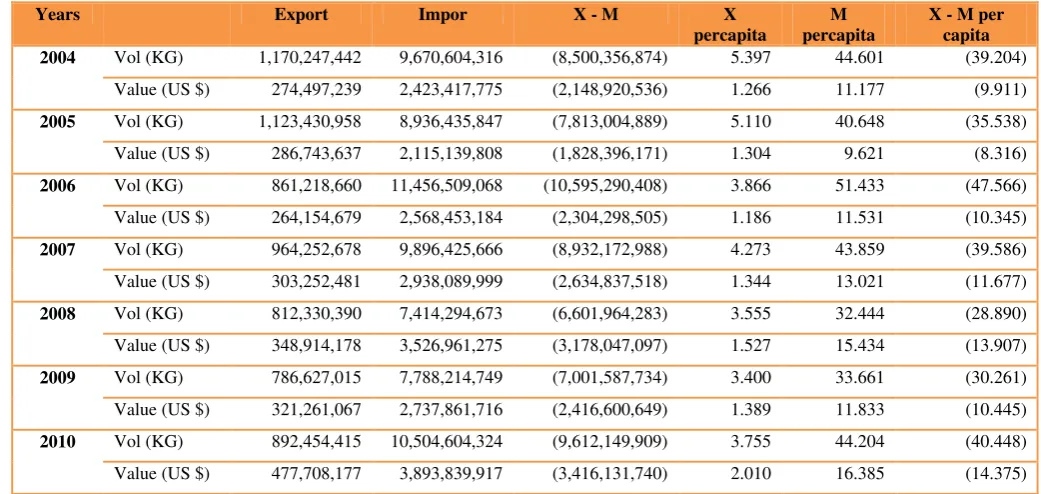
Indonesia has abundant natural resources, including agriculture, the main source of income of the majority of its people. Ironically, data show that Indonesia cannot fulfill its demand for food because it lacks supply. Data also show that Indonesia is a net importer of food commodities such as rice, maize, soybeans, sorghum, wheat, peanut vegetables, and fruits. Export per capita, both in volume and value for food commodities, remains constant, while the import per capita tends to fluctuate. This shows an inadequate food supply and high dependency on food imports.
Table 1.1 Volume and Value of Exports and Imports of Food Commodities
2004-2010
Years Export Impor X - M X
percapita
M percapita
X - M per capita
2004 Vol (KG) 1,170,247,442 9,670,604,316 (8,500,356,874) 5.397 44.601 (39.204)
Value (US $) 274,497,239 2,423,417,775 (2,148,920,536) 1.266 11.177 (9.911)
2005 Vol (KG) 1,123,430,958 8,936,435,847 (7,813,004,889) 5.110 40.648 (35.538)
Value (US $) 286,743,637 2,115,139,808 (1,828,396,171) 1.304 9.621 (8.316)
2006 Vol (KG) 861,218,660 11,456,509,068 (10,595,290,408) 3.866 51.433 (47.566)
Value (US $) 264,154,679 2,568,453,184 (2,304,298,505) 1.186 11.531 (10.345)
2007 Vol (KG) 964,252,678 9,896,425,666 (8,932,172,988) 4.273 43.859 (39.586)
Value (US $) 303,252,481 2,938,089,999 (2,634,837,518) 1.344 13.021 (11.677)
2008 Vol (KG) 812,330,390 7,414,294,673 (6,601,964,283) 3.555 32.444 (28.890)
Value (US $) 348,914,178 3,526,961,275 (3,178,047,097) 1.527 15.434 (13.907)
2009 Vol (KG) 786,627,015 7,788,214,749 (7,001,587,734) 3.400 33.661 (30.261)
Value (US $) 321,261,067 2,737,861,716 (2,416,600,649) 1.389 11.833 (10.445)
2010 Vol (KG) 892,454,415 10,504,604,324 (9,612,149,909) 3.755 44.204 (40.448)
Value (US $) 477,708,177 3,893,839,917 (3,416,131,740) 2.010 16.385 (14.375)
Source: Statistical Yearbook of Indonesia 2011, Statistics Indonesia, processed
3 To address the lack of food supply, Indonesia must increase its agricultural productivity. Increased agricultural productivity depends on many factors such as human resources, science and technology, appropriate knowledge systems for sustainable agricultural, agricultural machinery, irrigation networks, empowerment and institutional capacity building initiatives for farmers, and sound macroeconomic policies on agriculture. To raise agricultural productivity, government and other concerned sectors must design a comprehensive agricultural system.
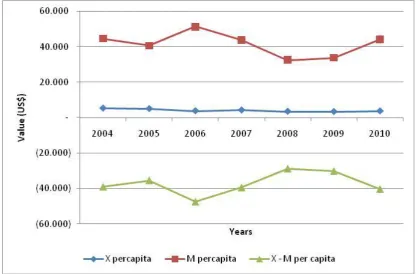
Source: Statistical Yearbook of Indonesia 2011, Statistics Indonesia, processed
Figure 1.1. Value of Exports and Imports of Food Commodities, 2004-2010
Design of the agricultural system cannot be separated from Indonesia’s long-term vision: To create a self-sufficient, advanced, just, and prosperous Indonesia. In this regard, the government has created a development platform called the Master Plan for the Acceleration and Expansion of Economic Development of Indonesia (or MP3EI in Bahasa Indonesia). The MP3EI provides the building blocks to transform Indonesia into one of the 10 major economies in the world by 2025.
4 its position in the global economy. Thus, the MP3EI is expected to boost Indonesia’s bid to become a highly competitive country.
The MP3EI has laid out the following general strategies to achieve its goals (as outlined by the Coordinating Ministry for Economic Affairs, 2011:
1. To strengthen the Indonesian economic corridor 2. To strengthen national connectivity
3. To strengthen human resources and national science and technology
To strengthen the country’s economic corridor, the government is mapping out the centers of economic growth based on the potential and advantages of each region. Each development area has a unique strategic role. Based on the identified strategic roles and suitability of specific geographical locations, the MP3EI has identified six economic corridors:
1. Sumatra Economic Corridor as a “Center for Production and Processing of Natural Resources and as the nation’s Energy Reserves”
2. Java Economic Corridor as a “Driver for National Industry and Service Provision” 3. Kalimantan Economic Corridor as a “Center for Production and Processing of
National Mining and Energy Reserves”
4. Sulawesi Economic Corridor as a “Center for Production and Processing of National Agricultural, Plantation, Fishery, Oil & Gas, and Mining”
5. Bali – Nusa Tenggara Economic Corridor as a “Gateway for Tourism and
National Food Support”
5
Figure 1.2. Indonesian Economic Corridor
Based on the objectives of this research, this study focuses on the Sulawesi economic corridor as the center of agricultural production and processing. While Java is the main food crop producer in Indonesia, Sulawesi is the third largest food producer in Indonesia. Its main agricultural produce consists of rice, maize, soybean, and cassava. Java Island is confronted by agricultural issues is limited farmlands and high rates of farmland-to-non-agricultural conversion.
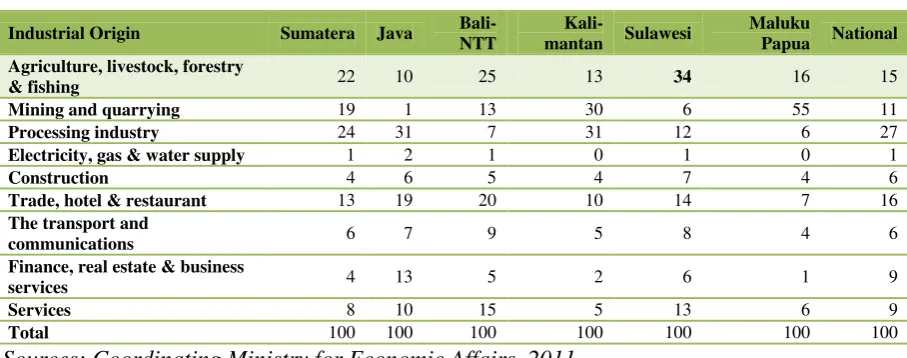
Table 1.2 Percentage Distribution of Gross Domestic Product at 2000 Constant
Market Prices By Industrial Origin Per Corridor, 2010
Industrial Origin Sumatera Java
Bali-NTT
Kali-mantan Sulawesi
Maluku
Papua National
Agriculture, livestock, forestry
& fishing 22 10 25 13 34 16 15
Mining and quarrying 19 1 13 30 6 55 11
Processing industry 24 31 7 31 12 6 27
Electricity, gas & water supply 1 2 1 0 1 0 1
Construction 4 6 5 4 7 4 6
Trade, hotel & restaurant 13 19 20 10 14 7 16
The transport and
communications 6 7 9 5 8 4 6
Finance, real estate & business
services 4 13 5 2 6 1 9
Services 8 10 15 5 13 6 9
Total 100 100 100 100 100 100 100
Sources: Coordinating Ministry for Economic Affairs, 2011
Based on in-depth interviews with the Ministry of Agriculture personnel, Sulawesi has a potential for agricultural development even if it is not yet a major food producer. Sulawesi has a unique biodiversity that can support raw materials-based industry development in biotechnology. If this happens, Sulawesi will be a major food supplier.
6 gross domestic product. Agriculture, livestock, forestry, and fisheries in the area contribute 34 percent to the GDP. This contribution is much higher than the agricultural sector in Sumatra, which is about 22 percent of the province’s GDP, Java (10 percent), and the national agricultural sector, with an average of 15 percent. Based on these data, this study focuses on agriculture in Sulawesi.
Implementation of the MP3EI strategy, especially the economic corridor for agricultural development, cannot be done easily. The Indonesian government needs to determine the readiness of Sulawesi to be a center of agricultural production. Such readiness is important because the new vision and strategies of MP3I have an implication not only on policy implementation but also on farmers’ use of indigenous agricultural knowledge and capacity to adopt agricultural technologies for sustainable agricultural development.
Developing the agricultural sector also depends partly on science and technology. Previous research has shown that there are two combinations of knowledge on the agricultural system: indigenous knowledge1 and external/modern knowledge or technology. Most traditional farmers tend to rely more on their indigenous knowledge than on newly designed agricultural knowledge even if external knowledge is key to increasing agricultural productivity. External knowledge also induces innovation of production, harvesting, storage, and marketing of agricultural commodities. The appropriate agricultural knowledge will improve rural livelihoods, quality and yield, food security, and, overall, the economy (Asaba et al. 2006).
Indigenous and modern or external knowledge are not contradictory. They can be used and developed together to enhance agricultural productivity. According to Lemma and Hoffmann (2005), the more local people experiment with external technologies, the more they strengthen their indigenous knowledge and practices. Thus, how farmers adopt and apply indigenous and external agricultural knowledge is crucial to the agricultural development. In this regard, an assessment of the readiness of Sulawesi farmers is one of the prerequisites of MP3EI strategy implementation.
1
7
1.2. Research Problem and Objectives
Indonesia is currently facing at least two major challenges on the agricultural front. One is increasing imports of food agricultural commodities because of a supply lack. Two is the readiness of Sulawesi to be the center of development, production, and food processing in accordance with the MP3EI strategy.
The clustering of agricultural development in Sulawesi is not easy, since the largest food agricultural producer is Java Island. Shifting Indonesia’s agricultural center from Java to Sulawesi will be a difficult transition owing to the following:
1. Low farmer skill. Most agricultural workers have low educational levels and do not have enough skills and knowledge to cultivate a farm.
2. Lack of technology transfer systems. Most farmers in Indonesia do not have access to appropriate technologies and sustainable production techniques. They simply plant and harvest without exploring new agricultural innovations.
3. Limited and decreasing agricultural resource capacity. The demand for land increases with population growth, technological and industrial advances and culture shifting. However, the availability of land does not increase and like remains so. Due to the conversion of land status from agriculture to non-agriculture, there is shrinkage of agricultural land in Indonesia.
4. Lack of markets for farm produce and access to credit. Agricultural innovations require investments and infrastructure. Unfortunately, there are fewer investments in agricultural activities compared to industrial activities. Farmers also have difficulty obtaining credit for their agricultural activities. Among the reasons behind this difficulty are the lack of collateral of land certificate, the routine repayment, the complicated procedure of proposing credit, and the limited fund of the government.
5. Limited land to expand agricultural areas. The growing population and land conversion lead to the shrinkage of agricultural land. Hence, to increase agricultural production by expanding agricultural land (through extension) is difficult.
6. Low food productivity. This is caused by low fertilizer use and inadequate irrigation networks.
8 knowledge that in turn will boost the food agricultural sector. More specifically, this research addresses four problems:
1. What are the socioeconomic conditions of farmers, including quality of access to credit facilities and technology?
2. What is the role of indigenous knowledge in enhancing food security? 3. What is farmers’ adoption behavior toward new agricultural technologies?
4. What is the appropriate model to harness the indigenous and external agricultural knowledge?
In exploring the development of the food agricultural system and the revitalization of
farmers’ livelihoods, this study specifically aims to:
1. Assess government policies and strategies in agriculture. 2. Determine the socioeconomic condition of farmers.
3. Understand the role of indigenous knowledge in enhancing food security.
4. Investigate the adoption behavior of farmers toward new agricultural technologies. 5. Formulate appropriate recommendations for an agricultural system based on
farmers’ behaviors.
This research is expected to yield the following outputs: 1. Recommendations on agricultural policyin Indonesia.
2. Documentation of the role of indigenous knowledge and new agricultural technologies.
3. Recommendations for agricultural system development.
1.3. Research Contributions
Boosting the agricultural sector is crucial to economic development (Todaro 2000), more specifically in employment generation, income generation, poverty reduction, food production, capital mobilization. In this regard, this research hopes to contribute to efforts to empower farmers and encourage provincial governments to adhere to the country’s economic agenda. Through revitalized and sustained agricultural efforts, other impacts on society will follow suit such as rapidly increasing income among the poor in rural areas, improved economic condition, and enhanced food security.
9 1. Fill the information gap in the use of indigenous and external agricultural
knowledge.
2. Provide vital information about farmers’ knowledge and behavior to facilitate the development of appropriate agricultural policies by the government.
10
CHAPTER 2.
LITERATURE REVIEW
This literature review focuses on the use of indigenous knowledge and agricultural technologies to prepare Sulawesi, particularly South Sulawesi, and the Gorontalo provinces to be the food hub in Indonesia. It takes into account agribusiness concepts, and indigenous and external knowledge in agriculture (and how their interaction), as well as socioeconomic factors affecting farmers’ lives.
2. 1. Agribusiness
The concept of agribusiness was introduced by Davis and Goldberd (1957). They
defined it as “the sum total of all operations involved in the manufacture and distribution of farm supplies, production activities on the farm, and the storage, processing and distribution of farm commodities and items made from them.” Agribusiness can be seen in two ways (Yamanie 2011), that is, as a system and as a field of business. As a system, agribusiness includes several elements that are interrelated in various forms of interaction and collaboration to achieve certain goals. Agribusiness is any business related to agricultural production activities, including utilization of agricultural inputs, cultivation, production, management of agricultural products (post-harvest, processing) and marketing.
The agribusiness industry includes production, processing, and distribution. Thus, the agribusiness system covers upstream to downstream industries, alongside several subsystems, namely, subsystem input supply, cultivation or production of biological subsystems, post-harvest subsystems, agro-processing or agro-industry, agro-marketing subsystems, and supporting subsystems. As a field of business, agribusiness seeks to integrate agricultural subsystems for profit.
11
2. 2. Indigenous Knowledge, Information Diffusion, and Technology Adoption
Knowledge is an outcome of the modeling that will be applied to environmental management (Gadgil et. al. 1993). Most knowledge is qualitative in nature and based on geographical observations on a limited scale.
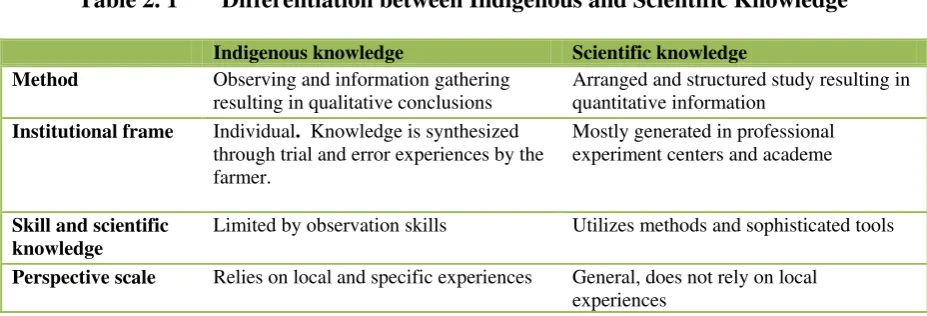
There are fundamental differences between indigenous knowledge (IK) and scientific knowledge (Warren 1991). Scientific knowledge is generated by universities, government research centers, and private companies. IK is knowledge or wisdom “technically” achieved and developed by societies, in particular localities, through careful observation and experimentation over the years with surrounding natural phenomena. Unlike IK, scientific knowledge is universal, not “context-related” and not bound to the local culture and environment.
Table 2. 1 Differentiation between Indigenous and Scientific Knowledge
Indigenous knowledge Scientific knowledge Method Observing and information gathering
resulting in qualitative conclusions
Arranged and structured study resulting in quantitative information
Institutional frame Individual. Knowledge is synthesized through trial and error experiences by the farmer.
Perspective scale Relies on local and specific experiences General, does not rely on local experiences
Sources: Sunaryo and Joshi 2003
IK is traditional knowledge developed by local folk in specific conditions in a specific geographical area (Grenier 1998). IK is an integral part of the culture and history of a local community. It is knowledge accumulated over time owing to its significance. It can be defined as a cumulative body of knowledge and beliefs handed down through generations by cultural transmission about the relationships among humans and with their environment (Gadgil et al. 1993; Gorjestani 2000).
12 Indonesia has many traditional societies in various cultures, including those relating to agriculture. Since the country has thousands of islands, contours and soil fertility in each of the different areas generate a significant amount of IK. Following are bits of LK/IK on agriculture in Indonesia.
1. Before farmers plant food crops, they still rely on forecasts by indigenous environmental experts, who in turn depend on environmental observations that have accumulated over many years, such as cloud formations and what they mean to farmers. For example, animal-shaped white clouds signal an auspicious time to cultivate the land by cattle.
2. Stars and constellations are observed as well. Plough-shaped arrangements mean an appropriate time to open up the soil, while rice-shaped patterns signal a good time to plant rice, maize, and soybeans. Constellations showing long rice-shaped arrangements indicate a good time to plant long-lived rice. Shorter patterns of rice-shaped arrangements connote a good time to plant short-lived rice.
3. To anticipate climate change effects and variations in the rainy and dry seasons, farmers have developed a number of traditional water management technologies such as those involving water harvesting and efficient water use. They have adopted drip irrigation systems at the village level (JIDES in Bahasa Indonesia), irrigation systems at the farming level (JITUT), and observing certain time periods, and applying cropping-pattern management technologies.
4. To meet water their needs, farmers construct ponds to collect rainwater and increase soil water storage capacities. These are applied to crop irrigation during the dry season.
Noting the limitations of IK, Biggs and Clay (1981) said its usefulness to farmers depends on the following:
1. Capacity to manage knowledge;
2. Knowledge monopolization by social groups and specific genders; and
3. Economic stratification. Richer societies use and produce knowledge that is different from those of poorer communities.
13 guide to interacting with others and harnessing nature. In this regard, IK can contribute significantly to the construction and reinforcement of self-reliance and community empowerment.
Besides IK, knowledge development cannot be separated from the influence of technology. IK as the sole basis for how the agricultural sector operates cannot support agricultural development and achieve food security. Agricultural development also requires the external elements of knowledge and technology. Development as a process does not always run smoothly. Diffusion of information and adoption of technology are the important components of this process. Based on the studies of Feder, Just, and Zilberman (1985), as well as of Besley and Case (1993), the adoption of technology can dramatically improve the well-being of agricultural households. Technology adoption must be preceded by information diffusion. Social structure is a determinant of the diffusion of information among village households.
Isham (2002) said there are at least three characteristics of social structure that can support diffusion of innovations.
1. Group homogeneity. The more homogeneous the group, the easier information is shared. When individuals share the same attributes and beliefs, communication is more effective.
2. Participatory norms. The higher the level of participation, the more interactive decision making becomes and the more rapidly knowledge is shared. In a village with specific social norms, innovators can share their new ideas and influence community opinions through the existing consultative mechanisms.
14 Feder et al. (1985) also cited some factors that affect the adoption of agricultural technology. They are (i) farm size, (ii) risk exposure and capacity to bear risks, (iii) human capital, (iv) labor availability, (v) credit constraint, (vi) tenure, and (vii) access to commodity markets.
Indonesia deems the adoption of technology essential to improving food security. It also believes that the impact rate of knowledge development and technology will only be achieved if the parties who implement specific policies are completely involved in this undertaking. The impact of food research and development will be significant only if the farmer can apply it completely. Ideally, technological diffusion approaches a free-flow pattern. If there is little resistance to the diffusion process, then there is less need for technology assistance. However, if this diffusion process is hindered by flow-tight barriers, then there is no choice except reevaluating the choice of the technology developed. It is time to put the farmer or farming community at the center of agricultural technology diffusion.
Accelerating the development of agriculture requires public participations. Public participation can be achieved through the following:
1. Structural approach. Within a society, at the smallest unit such as households, there is a certain order or structure to manage the sustainability of the community. Each structure has its own tasks but still needs cooperation with other structures to execute the task efficiently. Agricultural development also requires institutional structures:
a. Farmers groups in charge of production
b. Production shops, banks, and other sectors involved in production c. Research and development agencies that produce technology d. Counseling agencies
e. Policymaking institutions (Hermanto 2001). To achieve agricultural development goals, even though each institution has its own task, they must work together.
15 According to Adnyana and Basuno (2001) such an approach is called an
“improvement of indigenous knowledge”, where new technology is disseminated in a participatory manner to ensure a sustainable application of specific farming technologies.
A strong cultural approach to agricultural development is found in Bali (Adiyoga and Wahyuni 2000). Every stage of farming activity is preceded by a traditional ceremony, which involves praying to deities for a bountiful harvest.
3. Resource approach. The resources of family farms should also be considered in the application of new technologies. Rejection of new technologies can happen if these farms lack human resources.
Technological interventions in addressing issues of food security are needed to increase purchasing power at all stages of food supply—ranging from technology development in food production, processing technology and food product development to transportation management of food and food storage technology.
Development programs and technological knowledge in Indonesia are grouped into four main programs:
1. Research and development 2. Diffusion and utilization 3. Institutional strengthening
4. Development program on knowledge capacity and technology of production system
Those programs can be applied to any activities to increase food security, such as research and development and technology introduction. The results of research and development activities can be disseminated, adopted, and used in food production activities.
Indonesia’s knowledge and technological mission for 2025 is to enhance the role of science and technology in improving public welfare through the following initiatives:
1. Developing plant cultivation, livestock, and fish technologies to meet the food needs of the community;
2. Increasing food diversity through the exploration and development of feasibility studies and food-processing technology;
16 4. Developing food information systems (including a system for public education and socialization of government policy on food) to ensure a smooth flow of information between the centers of food production, the food processing industry, and the domestic and international markets;
5. Developing a food technology supervision system to protect consumers from contamination from hazardous chemicals and pathogenic microbes. Such a system should apply to cultivation, processing, and distribution.
Further evaluation of the comparison between local and scientific knowledge is expected to bring about the following possibilities (Sunaryo and Joshi 2003):
1. Local knowledge systems and scientific knowledge systems complete each other. 2. Both knowledge systems are aligned, but use different terms for the same thing.
For example, indigenous knowledge says that sheep-shaped clouds mark the beginning of the rainy season, while scientific knowledge would classify these
clouds as “stratus” or “cumulus”.
3. When both systems are contradictory, they should be subject to further scientific study.
4. Local knowledge can be refined and enhanced by scientific knowledge.
2. 3. Factors that Affect Farmers’ Socioeconomic Conditions
The measure of farmers’ socioeconomic status is essentially the same as socioeconomic indicators. Measures of socioeconomic conditions include educational attainment, number of family dependents, income level, household expenditure, and employment opportunity. Farmer well-being is determined by income structure, food expenditures, and Farmer Terms of Trade (FTT) (specifically explained below). These factors are further explained below:
1. The structure of farmers’ income indicates the main source of family income even if this does not always come from the agricultural sector. Overall, this income structure reflects the state of the agricultural sector in the national economy. It must be stressed, however, that if a farmer is enjoying a high level of income, it does not necessarily mean he is living prosperously. Farmer welfare is also determined by the amount of family spending.
17 needs, agricultural work is still subsistent. Conversely, the greater the expenditure on non-food consumption, the more basic needs are met. This means that much of the income can be allocated for non-food or secondary needs to ensure a better quality of life. These needs include education, health, and leisure. The shift of
farmers’ expenditure also indicates a shift from subsistence farming to commercial farming. According to Engel’s law, the proportion of household
budget allocated to food declines as the household’s income rises. As income increases, a greater proportion of it is allocated to the purchase of ‘luxury’ items while the proportion for food expenditure lessens.
3. The FTT is used to measure the exchange of agricultural commodities produced by farmers into products purchased for consumption or production needs. The FTT is the ratio of the indexes of prices received by farmers to an index of prices paid by farmers (in percentage). It reflects the relative level of farmers’ welfare. The higher the FTT, the higher the farmers’ relative welfare. In general, the FTT has three conditions: (i) the FTT > 100 means the FTT in a given period is better than FTT in the base year; (ii) FTT = 100 refers to a given period equal to the FTT in the base year; and (iii) FTT <100 means the FTT in a given period decreased compared to the FTT in the base year (BPS 2011).
2. 4. Findings from Earlier Research
Suhartini and Cahyono’s (2009) study showed that both Central and East Java have a significant amount of IK and local techniques applied to their organic rice farming systems. Knowledge applied is both traditional and modern in nature. Local knowledge used most extensively pertains to the use of local materials, such as herbs (which serve as raw material for making organic fertilizer or organic pesticides), livestock wastes for organic fertilizer, and local rice varieties (or mentik wangi).
18 solid organic fertilizer by using a starter microbial decomposer (Suhartini and Cahyono 2009).
Cahyono (2007) presented some arguments on why IK is vital to improving farmer in a sustainable manner. While this study suggests that IK is not meant to replace modern knowledge in agricultural development policy, it is nonetheless an important factor that must be integrated within the framework of agriculture revitalization. Such significance not just lies in ecological and social initiatives but also in long-term economic undertakings.
Cahyono also showed that IK is a system of knowledge and practices that ensure the continued existence of germplasm in ways that have been understood for generations. In other words, this original wisdom functions as a “seed bank“ and as an “information and knowledge bank” for grassroots-level farmers. Ironically, when the seeds start to disappear from the local paddy fields and farmers’ warehouses, developed countries (which are aware of the importance of the existence of the seed and its economic value) struggle to conserve them by establishing international seed banks. If this process continues as projected in the future, farmers will have difficulty obtaining local (or native) seeds because the local distribution networks that maintain availability of these seeds will be lost.
Cahyono and Shinta (2005) and Purnamaningsih et al. (2007) showed that the existence of local rice at this time is extreme cause for worry. Local rice farms still exist in the current system, but they are limited in terms of the number of varieties, planting areas, frequency, and number of farmers. There are even indications that in some agricultural areas in Malang, some hybrid rice seed agents have entered local rice areas that are already very limited in size. If there is no policy or regulation to protect the existence of local rice, then local rice will is bound to become extinct. From an economic view, the contribution of the formal sector (seed companies, research institutes, and universities) as a whole to seed supply is relatively small compared to local or informal seed sources.
According to Sunaryo and Josi (2003) IK develops in the local context and adapts to
society’s conditions and needs. IK is also the result of creativity and continuous experiments seeking to enable internal innovations and external influences to adjust to emerging conditions. Therefore, it is wrong to think that indigenous knowledge is ancient, backward, or static. Unlike widespread scientific knowledge that is made popular through media, widespread indigenous knowledge usually spreads by word of mouth or through informal education.
20
CHAPTER 3.
RESEARCH METHOD
3.1. Data and Samples
This study was conducted in Sulawesi, Gorontalo and South Sulawesi, chosen because they are the center of agricultural activities in Sulawesi. Purposive random sampling was used. A total of 45 farmers in Gorontalo province and 60 farmers in South Sulawesi were tapped for the study. The sample size was bigger in South Sulawesi than in Gorontalo because it has a bigger farmer population. The total sample of farmers, 105, was considered sufficient because the behaviors of farmers tend to be homogeneous.
This research used secondary and primary data. The secondary data were obtained from literature, project reports, official documents, publications, and consultations with relevant individuals and institutions.
Data were collected from randomly sampled households. The primary data were generated using questionnaires, in-depth interviews, and focus group discussions (FGD) whereas the secondary data were obtained from the Ministry of Agriculture, local government, Statistics Indonesia, and Bank Indonesia. Primary data were derived using a structured and validated questionnaire consisting of both open- and closed-ended questions to elicit information from the respondents. The questionnaires used covered information on the socioeconomic conditions of the target households. Socioeconomic data consisted of information on households, land holdings and tenure, land use and cropping patterns, production costs, sellable products, and food situation.
In-depth interviews were conducted with experienced members of the community, policymakers, and agricultural experts. The experienced community members shared information on household coping strategies, indigenous knowledge, and technology adoption behaviors. The agricultural experts and policymakers provided information on agricultural policies, strategies, and problems, as well on the development of agricultural technology in Indonesia.
FGDs were held at the province level. Each group consisted of eight to 15 people, who provided perspectives on a host of issues confronting the agricultural actor. The participants included:
1. Policymakers. These consisted of relevant staff in privincial officials. The FGDs sought their knowledge and views on agricultural problems and implementation strategy.
21 access, indigenous agriculture knowledge, current and developing technology, and women participation.
3. Logistic Affairs Agent (or BULOG in Bahasa Indonesia). This is responsible for food distribution and keeps data on the food agricultural market, food stock, and relevant policies in Indonesia.
4. Financial institutions. These provide information on the banking sector, specifically where it involves agricultural credit.
The field survey was conducted to facilitate deep understanding of the socioeconomic context of the study, including resource management and patterns, prevailing farmers’ practices in cropping systems, crop productivity and yield, and socioeconomic constraints to production.
The questionnaire and in-depth interviews focused on the following:
1. Economic indicators such as income, cost of production, welfare, financial access, and access to market;
2. Agricultural policy and implementation;
3. Farmers’ behaviors and external conditions that hinder the acquisition and sharing of, as well as access to, agricultural knowledge such as those dealing with the following:
a. economic and social status
b. demographic status: gender, age, education c. knowledge-sharing culture
d. mode of adoption of new knowledge and culture technology e. institutional support and service
f. availability and cost of agricultural inputs g. accessto agricultural credit and market h. lack of agricultural knowledge sources
22
3.2. Operational Definitions and Measurement of Variables
The primary variables and operational definitions used in this study are as follows:
No Primary Variable Operational Variable
1. Welfare Farmers’ income measured by agricultural products per harvest. Value of agricultural products differentiates between rainy season and dry season.
Expenditure of farmers measured by the average monthly spending of families
2. Land Ownership Total farming area in hectares
Ownership status, i.e., one's own, owned by someone else (where one is hired to work), and rented
3. Human Resources Availability of workforce as measured by ease of finding employment and origin of workers.
Labors competence as measured through workforce skill on farmland Education level of labor
Participation of labor in agricultural training
System of wage paid to labor measured by the number of farm hands and how wage is given to labor
4. Natural Resources The condition and topography of the farmland are indicators of the soil type, that is, wet or dry, flat, sloping or steep
Climate/weather as measured from the average rainfall or the existence of extreme weather during the year
5. Production Agricultural cultivation patterns as seen in the farm system developed Maintenance pattern as measured by the mode of provision of
fertilizer and medicines (proximity)
Harvest as measured by the use of technology in harvesting, production quantities, and energy crops used
6. Post-harvesting Handling
Post-harvest handling is measured by the mode of crop cultivation, the existence of a by-product of crop production, and mode of post-harvest handling.
7. Marketing Accessibility
8. Financial Accessibility
9. Indigenous knowledge Role of IK Sources of IK Adoption behavior
3.3. Methods of Analysis
Gorontalo and South Sulawesi were chosen for their agricultural potentials and conditions. For purposes of the research, specific locations within the study area were classified into three based on (i) advanced food crops, (ii) medium food crops, and (iii) low food crops. Such stratification is expected to provide a more complete picture that accurately illustrates the challenge of MP3EI in each province. Following are the selected districts in the two provinces covered by this study:
23 3. Pohuwatu
Both quantitative and qualitative methods of analysis were applied to this study. For the quantitative descriptive statistical analysis, we used frequency distribution and percentage analysis of distribution or trends. Quantitative descriptive analysis was intended to provide a description of the agricultural profiles and socioeconomic conditions of the farmer respondents. Descriptive analysis is a statistical analysis of data that explains the observations without statistical testing. It aims to describe the characteristics of a sample or population observed using tables and figures.
The qualitative approach was the dominant approach used because it tended to give more attention to the subjective aspects of farmer experience and behavior. Conducting a qualitative descriptive analysis was aimed to clarify information on various field conditions and views on agriculture in general and as indigenous knowledge; as well as on the diffusion process and adoption of information technology in the sample area. Qualitative analysis also yields detailed descriptions of farmer behavior and agricultural conditions. It relies not only on interviews, questionnaires, and FGDs but also on a review of the literature, especially on indigenous knowledge and local wisdom.
24
CHAPTER 4.
ANALYSIS OF SOCIOECONOMIC CONDITIONS,
INDIGENOUS KNOWLEDGE, AND TECHONOLOGY ADOPTION IN
GORONTALO AND SOUTH SULAWESI
This chapter describes Indonesia’s agricultural condition and provides an analysis of socioeconomic conditions, indigenous knowledge, and technology adoption in Gorontalo and South Sulawesi Province. Analyses were performed based on in-depth interviews, questionnaires, FGDs, and literature review. Discussion on socioeconomic conditions aimed to look into the profile of the agricultural sector in both provinces as well as of the sample farmers. It also looked into the issues and problems affecting the agricultural sector, in terms of production, natural resources, human resources, finance, and institutions. The discussion was expected to provide a snapshot of the readiness of South Sulawesi and Gorontalo to meet the MP3EI target. The next section analyzes indigenous knowledge and the technology adoption process in the study areas, and explains how it impacts productivity and the welfare of farmers.
4.1. Agricultural Conditions and Policies
Indonesia is not exempt from some of today’s global issues, particularly climate change and food crisis. Like other countries, the country strives to improve food security for the benefit of its people. In the first three quarters of 2011, the agricultural sector (excluding fisheries and forestry) grew 3.07 percent, higher than the growth posted in 2010 (2.86 percent). Growth came from the plantation subsector (6.06 percent), livestock (4.23 percent), and food crops (1.93 percent). The agricultural sector (excluding fishery and forestry) contributed 11.88 percent to GDP in 2011, higher than the previous year (11.49 percent).
Table 4.1 Growth and GDP of Agricultural Sector (excluding fishery and forestry),
2009-2011
Sector/Subsector 2009 (%) 2010 (%) 2011* (%) GDP growth 3.98 2.86 3.07
Food crops growth 4.97 1.81 1.93
Plantation crops growth 1.84 2.51 6.06
Husbandry growth 3.45 4.06 4.23
Contribution to national GDP 11.34 11.49 11.88
Source: Data from Statistics Indonesia, processed by the Ministry of Agriculture
*average growth of quarter I to III 2011
25 1. Climate change impacts. Effects of climate change are seen in shifting cropping patterns, lack of water, and spread of plant pest and diseases that decrease agricultural production.
2. Limited ownership of agricultural lands areas and high conversion rates. Limited land areas on some islands in Indonesia prevent some farms from expanding. This condition makes the government’s extensification program inapplicable. The study also shows that most farmers no longer have property rights over land. Aggravating this situation is the conversion of some agricultural lands to other uses. The resulting decreased food production threatens food security.
3. Conversion of farmlands. Some 9,152 hectares of agricultural land are being converted to non-farmlands per year (Statistics Indonesia 2004).
4. Farmers have difficulty of accessing capital. Limited funding severely hampers
farmers’ ability to improve farm production, quality of produce, add value, and compete with other farmers.
5. Weak farmers’ institutions are still weak. Limited agricultural organizations and agricultural counseling agencies have hindered transfer of knowledge among farmers.
6. Limited support for agricultural infrastructure. This is especially true of irrigation infrastructure and rural roads, which results in less than optimal agricultural management.
Agricultural issues affected not only farm management but also food consumption patterns in Indonesia. Consider the following (Lakitan 2010):
1. Indonesian people still depend on rice as staple food. It remains more popular than other traditional sources of carbohydrates such as corn, sago, and cassava. Consumers in Indonesia consider only wheat and potatoes as substitute for rice. Thus, it is difficult to do food diversification.
2. Indonesia relies on imports for some food commodities. As such efforts to reduce food imports dependency is not easy. More so in light of the following factors: (i) the Indonesian population continues to grow; (ii) the farm food business is less competitive than other businesses, particularly in the industry and services sectors; and (iii) imported food items are relatively cheaper than domestically produced food.
26 Agricultural development pursues industrial agriculture that is based on local resources and boosts food self-sufficiency, added value, export, and farmer welfare. The Ministry of Agriculture’s mission for the period 2010-2014 seeks to undertake the following: 1. Realize sustainable agribusiness farming system that is efficient, based on
knowledge, technology and local resources, and environmentally sound. 2. Create a balance of agricultural ecosystem to improve food self-sufficiency. 3. Secure germplasm and improve its use to support diversification and food
security.
4. Empower farmers to become creative, innovative, independent, and capable of using science and technology and local resources to provide and serve high quality agricultural products.
5. Improve the quality of raw and processed foods.
6. Improve the production and quality of agricultural products used as raw materials in certain industries.
7. Set up vertically and horizontally integrated agricultural business.
8. Develop agricultural downhill industries that are integrated with local resources. 9. Promote the establishment of partner-based business systems and trading in
agricultural commodities founded on healthy, honest, and fair business practices. 10.Promote professionalism and competency among public officials in the agriculture
sector.
The Department of Agriculture set up 23 policy directions for agricultural development for the period 2010-2014 (Directorate General of Food Crops, Ministry of Agriculture 2011). Nine of these were related to the functions of the Directorate General of Food Crops:
1. Sustain and enhance the previous undertakings that have proven beneficial to farmers such as the distribution seeds, fertilizer subsidies, agricultural equipment and machinery; and operation of the Integrated School of Crop Management and Integrated School of Pest Management;
2. Continue and strengthen activities geared toward the empowerment of society such as nongovernmental organizations;
3. Stabilize rice and corn self-sufficiency through continuous production development;
4. Achieve soybeans self-sufficiency;
5. Develop organic fertilizer centers run by farmer groups; 6. Reinforce the germination and nursery institutions;
27 8. Be actively involved in formulating macroeconomic policies for farmers, such as tariff and non-tariff protection in international agricultural trade, government procurement pricing, and determination of the highest retail prices of subsidized fertilizers
9. Improve the agricultural development management and “good governance”. Crop development in Indonesia seeks to foster agribusiness to facilitate the production of food products that cater to all sectors of society (Directorate General of Food Crops2011).
The Directorate’s national crop development program seeks to improve domestic production, productivity, and the quality of food crops to achieve and sustain food self-sufficiency. The program’s priorities are the (i) national primary commodities, namely, rice, corn, soybeans, peanuts, green beans, cassava, and sweet potatoes; and (ii) local alternative commodities.
4.2. Overview of Sulawesi Economic Corridor
The Sulawesi economic corridor development program seeks to make the province the center of production and processing of agricultural products, fishery, oil, gas, and mining. To support agricultural sector development, Sulawesi has six economic centers: Palu, Gorontalo, Manado, Makassar, Kendari and Mamuju. The Sulawesi Economic Corridor is poised to be the door to economic markets in East Asia, Australia and USA.
28 As of 2010, Sulawesi’s economy was growing an average of 8.11 percent a year while
Indonesia’s economy in general was averaging a 5.75 percent growth per year. The main sectors contributing to the Sulawesi economy are agriculture (30.20 percent), trade, hotels, restaurants(16.04 percent), and services sector (13.74 percent).
Table 4.2 Gross Domestic Regional Products Based on Constant Price 2000
Sulawesi Economic Corridor
Province 2007 2008 2009 2010 North Sulawesi 14,344,302.07 15,902,073.26 17,149,624.49 18,371,201.12
Middle Sulawesi 13,683,882.46 15,047,428.54 16,177,335.03 17,437,129.13
South Sulawesi 41,332,426.29 44,549,824.55 47,326,078.38 51,197,034.67
Southeast Sulawesi 9,331,719.95 10,506,374.97 11,301,220.06 12,226,376.73
Gorontalo 2,339,217.51 2,520,672.95 2,710,737.05 2,917,412.57
West Sulawesi 3,567,816.12 3,998,502.00 4,239,460.87 4,744,309.49
Sulawesi 84,599,364.40 92,524,876.29 98,904,455.90 106,893,463.7
Indonesia 1,878,724,927.24 1,999,543,991.22 2,094,316,286.50 2,221,603,860.72
Source: Statistics Indonesia, 2009 - 2011
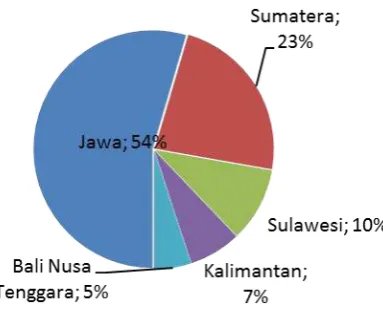
The development of food crops in Sulawesi will be concentrated mainly in Gorontalo and South Sulawesi. Today, the agricultural sector, particularly rice and maize in Sulawesi, has yet to reach its full potential. Until 2010, the major rice producer in Indonesia had been Java. Production of rice in Java accounted for 54 percent of the total rice production in Indonesia, followed by Sumatra, with 23 percent. Production of rice in Sulawesi contributed only 10.82 percent to the total rice production in Indonesia, lower than the contribution of maize to the total production of this crop, with 14.96 percent.
Sources: Committee on Accelerating and Expanding the Economic Development of Indonesia, 2011
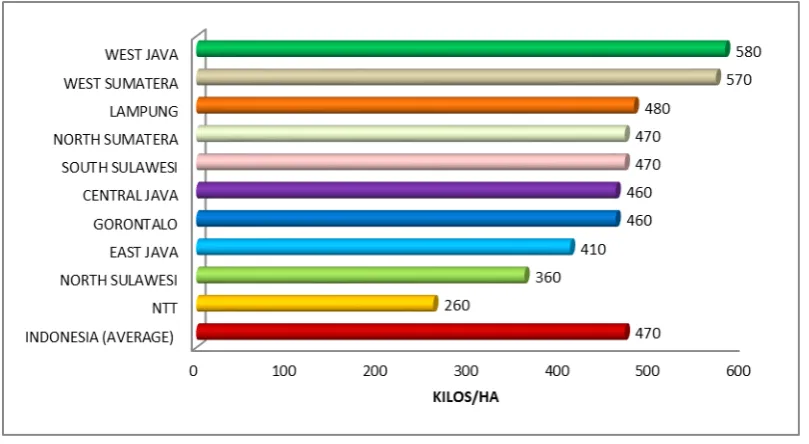
29 Meanwhile, maize production in South Sulawesi and Gorontalo is slightly higher than the average maize production across the rest of Indonesia, with 470 kilos and 460 kilos per hectare, respectively. The largest maize production in Indonesia is found in West Java and West Sumatra, with 580 kilos per hectare and 570 kilo per hectare, respectively.
Sources: Committee on Accelerating and Expanding the Economic Development of Indonesia, 2011
Figure 4.3 Maize Production, 2010 (In Kg/Ha)
Although the Sulawesi agricultural sector's contribution to the Indonesian economy is still relatively small, it has some potential to develop. Irrigation is one of the key components of strategic infrastructure that will help the province in its bid to become the next food center in Indonesian. The total irrigated areas in Sulawesi comprise about 1.02 million hectares or about 14 percent of the total irrigated areas in Indonesia (7.29 million hectares). Sulawesi’s irrigated farmlands are spread over 63 percent of farm areas in South Sulawesi province, 7 percent in North Sulawesi province, 3 percent in Gorontalo province, 15 percent in Central Sulawesi province, 5 percent in West Sulawesi province, and 7 percent of in Southeast Sulawesi province. Of the total irrigated areas in Sulawesi, only about 33.56 thousand hectares (3.28 percent) have water reservoirs such as the Bili-Bili and Ponre-Ponre reservoirs in South Sulawesi, while the others still rely on river flow through reservoirs or free water intake.
There are two regions covered by the development of food crops in Sulawesi, namely: 1. Makasar-Maros-Sangguminasa-Takalar (Maminasata), which supports the
development of agricultural crops for national food security, and corn; and
30 Policy direction and strategy development in Sulawesi, especially on food security, seek to increase production and food productivity (particularly rice, maize, and soybeans) and plantations (mainly cocoa), and accelerate the irrigation rehabilitation and irrigation construction.
4.3. Socioeconomic Condition of the Agricultural Sector
Economic growth Gross Domestic Product of South Sulawesi and Gorontalo has accelerated over time. In 2010, the Gorontalo economy grew 7.63 percent, and South Sulawesi 7.78 percent. Growth in both provinces is higher than the national growth of 6.3 percent in 2010.
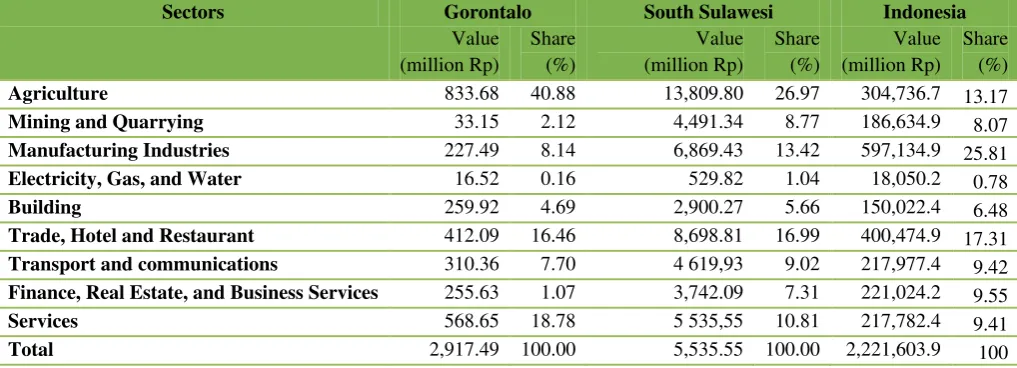
There are three major sectors contributing to the economy Gorontalo: agriculture, services, and the trade, hotel and restaurant sector. Based on the 2000 constant price, and with an output value of Rp 833.68 million, the agricultural sector contributed 40.88 percent to Gorontalo‘s GDP. The second largest sector, services, with an output value of Rp 568.65 million, accounted for 18.78 percent of the provincial GDP. The third largest sector, trade, hotels and restaurants, with a combined output value of Rp 412.09 million, comprised 16.46 percent of the province’s GDP.
Table 4.3 Value and Share of Gross Domestic Product, 2010
Sectors Gorontalo South Sulawesi Indonesia
Value
Agriculture 833.68 40.88 13,809.80 26.97 304,736.7 13.17
Mining and Quarrying 33.15 2.12 4,491.34 8.77 186,634.9 8.07
Manufacturing Industries 227.49 8.14 6,869.43 13.42 597,134.9 25.81
Electricity, Gas, and Water 16.52 0.16 529.82 1.04 18,050.2 0.78
Building 259.92 4.69 2,900.27 5.66 150,022.4 6.48
Trade, Hotel and Restaurant 412.09 16.46 8,698.81 16.99 400,474.9 17.31
Transport and communications 310.36 7.70 4 619,93 9.02 217,977.4 9.42
Finance, Real Estate, and Business Services 255.63 1.07 3,742.09 7.31 221,024.2 9.55
Services 568.65 18.78 5 535,55 10.81 217,782.4 9.41
Total 2,917.49 100.00 5,535.55 100.00 2,221,603.9 100
Source: Statistics Indonesia 2011
31
Table 4.4 Contribution of Agriculture Sector to the Economy 2006-2010
(In Percent)
Year Gorontalo South Sulawesi 2006 30.67 30.37
2007 30.61 29.47
2008 30.84 29.01
2009 29.54 28.57
2010 40.88 26.97
Sources: Gorontalo Statistics 2011, Sulawesi Statistics 2011, and Statistics Indonesia 2011
Table 4.4 shows the agricultural sector’s contribution to the economy from 2006 to 2010. The contribution of the agricultural sector in Gorontalo increased from 29.54 to 40.88 percent between 2009 and 2010. This indicates a serious effort in the province to promote the agricultural sector. In contrast, between 2006 and 2010, the agricultural sector in South Sulawesi suffered a steady decline in its contribution, that is, from, 30.37 in 2006 to 26.97 in 2010.
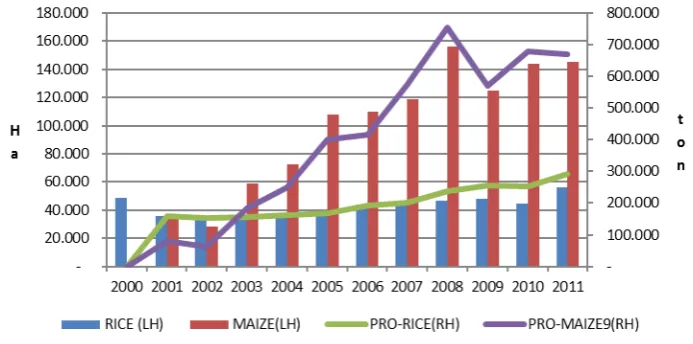
Farmlands planted to rice in Gorontalo are smaller in size than those where maize is grown. This is in line with the province’s goal of scaling up maize cultivation. Figure 4.4 shows the production of rice and maize in Gorontalo. The left scale shows the size of harvested areas, while the right scale shows the amount of production in ton. In 2009, harvested maize areas declined about 20 percent, resulting in a 25 percent decrease in maize production. Rice areas harvested in Gorontalo are relatively stable.
Sources: Gorontalo Statistics 2011
Figure 4.4 Harvested Areas and Production of Maize and Rice in Gorontalo,
2000-2011
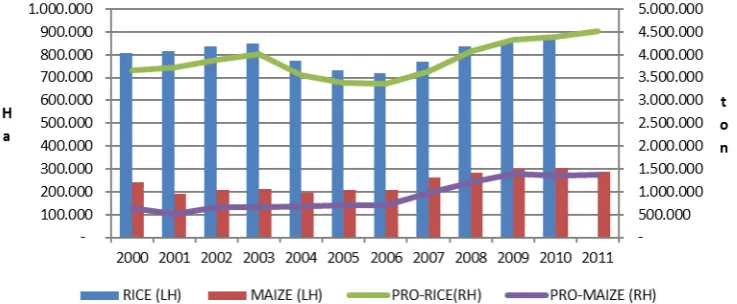
32 maize. In general, both production and harvested areas of rice and maize in South Sulawesi are relatively stable.
Sources: South Sulawesi Statistics 2011
Figure 4.5 Harvested Area of Maize and Rice Production in South Sulawesi
2000-2011
The linkage between harvested areas with the amount of production is reflected in productivity. Data show that production and harvested areas alongside productivity in Indonesia overall, South Sulawesi, and Gorontalo increased during the period 2000-2011.
33 Source: Gorontalo Statistics 2011, Sulawesi Statistics 2011, and Statistics Indonesia 2011
Figure 4.6 Productivity of Maize and Rice in Indonesia, South Sulawesi, and
Gorontalo 2000-2011 (In Percent)
Vital to crop productivity is crop management, which entails planting accuracy and proper breeding, cultivation, land management/production, fertilization, pest management, and harvest and post-harvest management handling.
34
Table 4.5 Socioeconomic Conditions of Gorontalo, South Sulawesi, and Indonesia,
2010
Total population Million 1,012,183 8,034,776 237,556,363
Labor force Million people 0.46 3.91 116.5
Unemployment People 23,573 276,869 8,319,779
Open unemployment rate Percent (%) 4.61 8.4 7.14
Poor people People 209,886 861,617 31,010,150
Percentage of poor population vis-à-vis total population
Percent (%) 20.74 10.72 13.33
GDP (constant price 2000) Billion Rp 2.918 5.536 2,221.6
Economic growth Percent (%) 7.63 7.78 6.43
Per capita income per year Million Rp 7.75 15.84 27.1
Life expectancy Year 70.10 70.80 69.4
Average length of education Year 7.40 7.20 7.92
Sources: StatisticsIndonesia, Gorontalo Statistics and South Sulawesi Statistics 2011
Another socioeconomic indicator of farmers is the state of their farms, as reflected in the workforce structure. As of August 2010, agricultural labor in Indonesia was pegged at 41.494 million, or 38.35 percent of the country’s total workforce (Statistics Indonesia 2011). As such agriculture is the largest labor-absorbing sector in Indonesia. The sector’s quality, however, is below par. Based on 2011 data from Statistics Indonesia, 75 percent of farmers in Indonesia either did not finish or only finished only primary school. Lacking formal training in agriculture, farmers learned their farming skills from the farmers among family members, notably parents.
Based on this study, farmers in South Sulawesi and Gorontalo are the subsistence type, who grow only enough to food to feed themselves and their families. Such finding is consistent with several previous studies on agriculture in Indonesia. In-depth interviews show that crops are largely unappealing to young people. This observation can be linked to the declining number of young farmers in both provinces, who think little of working in the agricultural sector. This kind of situation requires government intervention, especially in Gorontalo and South Sulawesi, which have a large contribution to the provincial economy and have a great potential to become Indonesia’s food hub.
35 Farmer Terms of Trade is another measure of farmer welfare. As earlier stated, FTT is the ratio of prices (e.g., farmgate) farmers receive to prices (e.g., production inputs) paid, multiplied by 100. Farmers are both producers and consumers. As producers, they receive payments for their crops. As consumers, they pay for goods and consumption needs.
Table 4.6 Farmers’ Term of Trade (FTT) 2010
Province Price Received Price Paid FTT 2009 2010 2009 2010 2009 2010 Gorontalo 117.78 130.10 119.23 124.7 98.79 104.30
South Sulawesi 125.28 131,30 122.67 129,67 102.13 101,26
West Sulawesi 128.95 137.20 121.47 130.8 106.16 104.90
Central Sulawesi 123.73 132.60 124.40 133.3 99.46 99.50
Southeast Sulawesi 131.71 138.00 120.88 127.6 108.96 108.20
North Sulawesi 120.30 133.50 119.93 129.0 100.31 103.50
Sulawesi 124.63 111.90 121.43 107.57 102.64 103.61 Indonesia 120.51 134.27 120.22 130.67 100.24 102.80
Source: Statistics Indonesia 2011
Table 4.6 shows the general FTT trend in Sulawesi corridor is greater than 100. This pattern indicates the price that is received by farmers exceeding the price that is paid by
farmers. It also indicates that the farmers’ purchasing power is good. The two sample provinces, Gorontalo and South Sulawesi, exemplied different conditions in 2009 and 2010. In 2009, Gorontalo’s FTT was at 98.79, which meant that the prices received by farmers were much lower than the costs of meeting their basic or daily needs.
In 2009, the agricultural sector’s contribution to Gorontalo’s economy was relatively small (29.54 percent). Thus the lower FTT (<100) could be attributed to the relatively low value of agricultural output. These conditions changed in 2010 when agricultural contribution to the economy reached 40.88 percent. In that same year, the goverment undertook various agricultural revitalization programs that led to an increased agricultural output in Gorontalo. FTT also rose to 104.23 in that year, which means prices received by farmers were much higher than what they paid for their consumption needs. In this regard, the purchasing power of the Gorontalo farmers improved considerably.
36
4.4. Agricultural Development in Gorontalo and South Sulawesi: Issues and Concerns
The following sections describe the results of in-depth interviews, questionnaires, and FGDs conducted in Gorontalo and South Sulawesi. As stated in Chapter 3, there were 105 respondents from Gorontalo (Gorontalo, Boalemo, and Pohuwato regencies) and South Sulawesi provinces (Maros, Pangkajene, and Kepulauan, Gowa regencies). The chairpersons of the Planning and Regional Development and the provincial agriculture offices were likewise interviewed for the study.
4.4.1. Respondent Profile
A great majority (average of 86.75 percent) of the respondents in both provinces are male farmers, who are generally the heads of household and main decision makers in their families. The female farmers generally take on a supportive role. Over 90 percent of the respondents are over 35 years old. There is relatively low interest in agricultural work among the younger generation. Young people with higher educational levels tend to choose to work in urban areas, both in the in a public and private sectors, resulting in inadequate human resources in the agricultural sector—a situation that is expected to continue in the long term.
Table 4.7 Respondents’ Profile Based on Sex
Sex Gorontalo South Sulawesi Frequency Percent Frequency Percent Male 40 88.89 55 84.62
Female 5 11.11 10 15.38
Total 45 100.00 65 100.00
Source: Primary data, processed
Table 4.8 Respondents’ Profile Based on Age
Age Gorontalo South Sulawesi Frequency Percent Frequency Percent <25 1 2.22 1 1.67
25-<35 3 6.67 10 16.67
35-<45 12 26.67 25 41.67
45-<55 14 31.11 15 25.00
55< 15 33.33 9 15.00
Total 45 100.00 60 100.00
Source: Primary data, processed