Adaptive Sleep Scheduling for Health Monitoring System
Based on the IEEE 802.15.4 Standard
Nurul Fahmi, M. Udin Harun Al Rasyid, Amang Sudarsono
Graduate School of Informatics and Computer Engineering Politeknik Elektronika Negeri Surabaya
Jl. Raya ITS Sukolilo Surabaya 60111, Indonesia Telp: 6231 5947280 Fax : 6231 5946114
E-mail: [email protected], {udinharun,amang}@pens.ac.id
Abstract
In the recent years, Wireless Sensor Networks (WSNs) have become a very popular technology for research in various fields. One of the technologies which is developed using WSN is environmental health monitoring. However, there is a problem when we want to optimize the performance of the environmental health monitoring such as the limitation of the energy. In this paper, we proposed a method for the environmental health monitoring using the fuzzy logic approach according to the environmental health conditions. We use that condition to determine the sleep time in the system based on IEEE 802.15.4 standard protocol. The main purpose of this method is to extend the life and minimize the energy consumption of the battery. We implemented this system in the real hardware test-bed using temperature, humidity, CO and CO2 sensors. We compared the performance without sleep scheduling, with sleep scheduling and adaptive sleep scheduling. The power consumption spent during the process of testing without sleep scheduling is 52%, for the sleep
Keywords: WSN, Environmental Health Monitoring, Adaptive Sleep Scheduling, Fuzzy Logic.
1. INTRODUCTION
Environmental health is an ecological junction between people and environments which is aimed to increase the quality of life, focusing on the health and the happy human life. Environmental health affects the smoothness of human life because the environment is a human place to live. Recently, WSN technology has been widely used in many important things. This is because each sensor node of WSN has many advantages such as low power consumption, low implementation cost, large coverage and can be applied in real-time [1]. There are many WSN technologies that have been used and applied recently, such as e-health system, military system, agriculture sensor system, forest fire monitoring system, smart home automation, smart city sensor, and environmental health monitoring system [2]. In the environmental health monitoring, for example, the sensor nodes can be helpful in the environmental health to monitor the condition and also can provide the information whether the condition is good or bad. In the field of e-health, for example, many researchers conducted a study to monitor the health of the human body, such as monitoring pulse oximetry of body temperature, heartbeat, and oxygen in the human blood.
Each sensor node that we used has several components in it such as Waspmote Board, Sensor Board, Sensors, ZigBee, and also battery [14]. The most exciting challenges in this research are the battery consumption that used by each sensor node because the lifetime of sensor node depends on the battery. From the data sensing, idle, and transmission data process, the most wasteful power consumption is at the moment when it comes to transmitting the data.
For minimizing the problem above, we propose the fuzzy logic approach to process the adaptive transmission from the sensor node to the gateway. This is aimed to save the battery consumption. In this paper, we compare three processes of data transmission process in WSN that aiming to
reduce the battery consumption. First, we start from the system without
using sleep scheduling. Second, we use sleep scheduling, and the last, we use
the adaptive sleep scheduling where the sensor node will transmit the data in a set time to monitor the environmental health based on the output of fuzzy logic.
This research paper is organized as follows, The Section 2, shows the related works. The Section 3, we describe the originality of our paper. The Section 4, we describe the fundamental of fuzzy logic and system design of our environmental health monitoring. The Section 5, we propose an adaptive sleep scheduling method based on the fuzzy logic approach. The Section 6 presents the experiment and analyzes the power consumption in real hardware implementation. Finally, we explain a conclusion in Section 7.
2. RELATED WORKS
Recently, many researchers have been researched about the WSN technology for environmental health monitoring and for saving the energy. Ferdoush, et al. [1] present the survey about WSN that is applied in the environmental field monitoring system, such as in agriculture monitoring, habitat monitoring, indoor living monitoring, greenhouse monitoring, climate monitoring, and forest monitoring. Othmana et al. [2] proposed a design and implementation of environmental health condition monitoring system based on WSN using open-source hardware platforms, such as Raspberry Pi and Arduino microcontroller. The Othmana’s system [2] used temperature and humidity sensors to monitor the temperature and humidity value. For communication between the sensor node and the gateway (Raspberry Pi), Othmana used Xbee module 802.15.4 standard protocol.
Ye, et al. [3] proposed an environmental health monitoring by using several sensors such as underground water level, barometric pressure, ambient temperature, atmospheric humidity, wind direction, wind speed and a rainfall sensor. Ye proposed the WSN architecture of the node hardware, data acquisition, data processing with gateway and data visualization. In this system, they used IRIS mode hardware platform, where communication between base-station with a gateway is applied via internet or GPRS. All users can monitor the results in real-time via a web-based application. In paper [4,5], the researchers proposed Indoor Air Quality monitoring which is
developed using Arduino, Xbee 802.15.4 standard protocol for
communication and micro gas sensor. This system used many sensors such as CO2, Volatile Organic Compounds (VOC), temperature, and humidity sensor. Base Station (BS) receives the data from each sensor node periodically, then the data is saved in the database as data storage and also data management.
Fahmi, et al. [7] proposed a fuzzy logic approach for an implementation of environmental health monitoring based on WSN. The sensor used in that research is temperature, humidity, CO and CO2 sensors. The communication between the sensor node and the gateway use ZigBee 802.15.4 standard protocol. This system is applied to real hardware by using Microcontroller ATMega 1281 and Gases Sensor Board developed by Waspmote [15].
Tripathy, et al. [8] analyzed an energy efficiency of fuzzy logic based on the intelligent WSN. This experiment has been done in fuzzy logic toolbox inside the MATLAB simulation software. For reducing the power consumption, they applied a sensor node in sleep mode when there is no activity to transmit data. And also they used the scheme based on the combination of a hierarchical and cluster-based network. Petri net modeling and HPSim simulator are used as a hybrid topology network which is aimed to analyze, verify correlation of the sensor node and test every state using ON/OFF mode for reducing power consumption.
Giovanni Pau. [9] proposed a novel energy efficiency of power consumption reduction by using the fuzzy logic approach in accordance with the battery level and Ratio Throughput for determining sleep time from a sensor node based on IEEE 802.15.4 standard protocol. This system used 3 memberships value such as sleeping time, Ratio of Throughput and battery level. This simulation is done by using the Fuzzy Logic Control (FLC) proposed to reduce battery power consumption.
Sabitha, et al. [10] combined two algorithms which are Neural Network
(NN) and Fuzzy Logic Control (FLC) for saving power consumption using soft computing based on the transmission power control techniques. Their design consists of 4 Transmission Power Consumption (TPC) algorithms which are FLC-TFC, FLC-GA, ANN-TPC, and ANN-GA-TPC. The transmission used to analyze the throughput, average power, average energy power conducted by successful transmission. The result showed that ANN-TPC outperforms FLC-TPC excellently in terms of energy saving.
3. ORIGINALITY
The WSN technology is growing very rapidly for monitoring environmental health. In the previous research [2], they implemented the WSN technology for monitoring temperature, humidity. However, they did not discuss the power consumption of the battery. There are many algorithms to reduce the consumption of batteries, one of them is a fuzzy logic such as [8,10], where they analyzed the power energy consumption using Matlab simulations and mathematical calculations. They did not prove it in a real hardware case. Another research that has been done [9], where the authors proposed environmental health monitoring for minimizing energy consumption with a fuzzy logic based on the battery level and to Throughput Ratio for the sleep duration.
health conditions, we use the fuzzy logic approach as a decision maker. We use the output of fuzzy logic such as sleep duration and transmission control which we named adaptive sleep scheduling. Also, we provide the system for monitoring the condition of environmental health in real-time, where all users can access using their smartphone and/or web-based application anywhere and anytime.
3. Fuzzy Logic for Environmental Health Monitoring
This section describes the overview of fuzzy logic. Fuzzy logic is one of
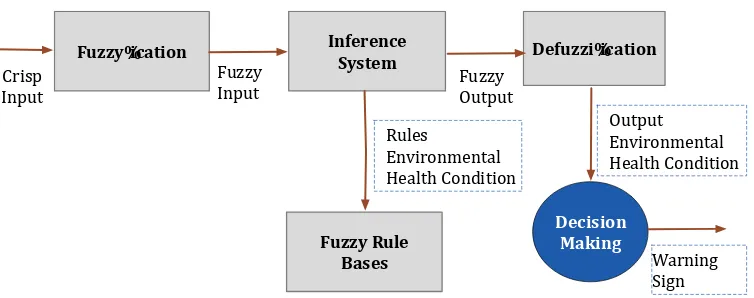
the fundamental building blocks of soft computing. Fuzzy logic was first introduced by Lotfi A. Zadeh in 1965 [12]. Many researchers use the fuzzy logic approach as a decision making, for example, in the field of agriculture [13], fuzzy logic is used to determine the probability of forest fire [6], and also for monitoring the health condition [7]. This method uses artificial intelligence to determine the basis of human thinking for decision making in the processing of one or many inputs. In Crisp, the membership value an item x in a set A, which is often written with µA(x), has two possibilities, namely 1 and 0. The value of 1 means that an item becomes a member in a set, while 0 means that an item is not a set. Fuzzy logic is divided into three, named fuzzification, fuzzy processing, and defuzzification. Figure 1 shows an architecture fuzzy logic system.
Figure 1. Architecture fuzzy logic system [13]
(a)Fuzzification : The process of changing the inputs which truth value are uncertain (crisp input) in the form of fuzzy input.
(b)Inference System : The process of analyzing and utilizing fuzzy input and fuzzy rules which have been determined. The result is fuzzy output.
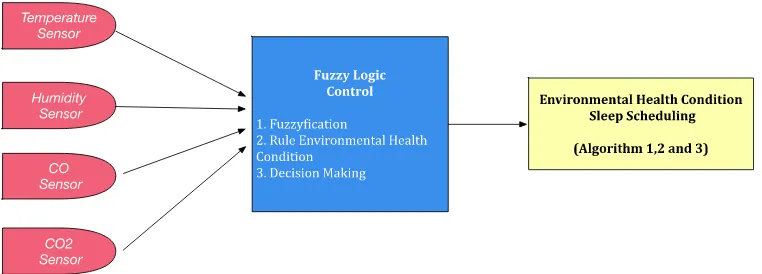
Figure 2. Proposed fuzzy logic for environmental health monitoring
Figure 2 shows the block diagram for environmental health monitoring using fuzzy logic approach. In this case, we have four membership function variables. Each membership function has three levels : Temperature (Low, Medium, High), Humidity (Low, Medium, High), CO (Low, Medium, High) and CO2 (Low, Medium, High). Data from the four sensors will be combined to an output which is called environmental health condition. The environmental health condition output level consists of five categories: Very Good (VG), Good (G), Average (A), Bad (B) and Dangerous (D).
Figure 3. Design FLC data fusion
Furthermore, data from the four sensors will be fused and processed using a fuzzy logic control such as shown in figure 3. The result of the processing fuzzy logic is an environmental health condition. This condition is used for determining the sleep duration of Gases Sensor Board, ZigBee and Waspmote Board. And this is also used for transmitting the data sensor to the gateway.
Fuzzy%ication Inference
System Defuzzi%ication
Fuzzy Rule Bases Crisp
Input
Fuzzy Input
Fuzzy Output
Rules
Environmental Health Condition
Decision Making
Output Environmental Health Condition
(a) (b)
(c) (d)
(e)
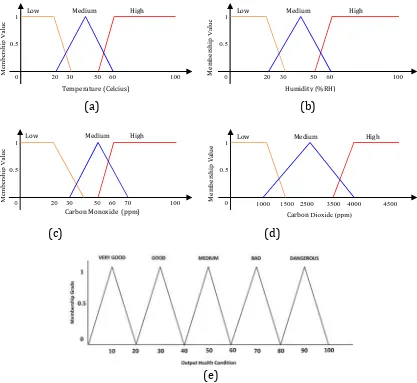
Figure 4. Membership function of fuzzy logic variable : (a) Membership function of temperature, (b) Membership function of humidity, (c) Membership function of CO, (d) Membership function of CO2, (e) The Output of environmental
health condition
Where X, Y, and Z is fuzzy variable. While A, B, and C are a fuzzy set of each variable. In this method, each consequent upon the rules are in the form of IF... THEN and represented in a fuzzy set. Fig 5 shows the inference system of Tsukamoto method.
Figure 5. Fuzzy inference system Tsukamoto method [13]
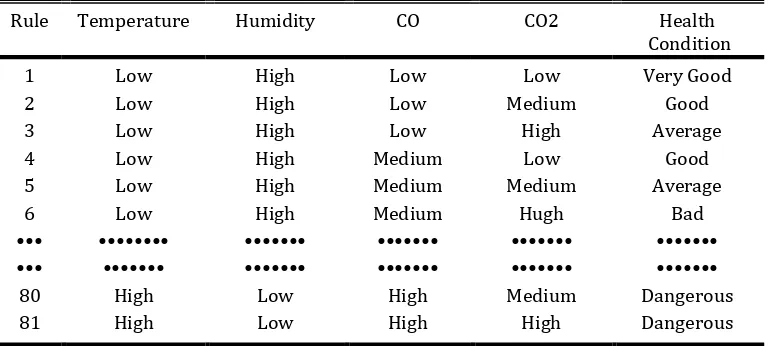
Fuzzy inference system consists of several rules. This process has a membership function, logical operators, and IF-THEN rules. This method is often known as MAX-MIN. For the inference system, we used 4 input variables which consist 3 membership function, namely LOW, MEDIUM, HIGH. So, the total is 3x3x3x3=81 rules used in the decision making of the environmental health condition.
Table 1. Inference rules for environmental health condition
Rule Temperature Humidity CO CO2 Health
Condition
1 Low High Low Low Very Good
2 Low High Low Medium Good
3 Low High Low High Average
4 Low High Medium Low Good
5 Low High Medium Medium Average
6 Low High Medium Hugh Bad
••• •••••••• ••••••• ••••••• ••••••• ••••••• ••• ••••••• ••••••• ••••••• ••••••• •••••••
80 High Low High Medium Dangerous
81 High Low High High Dangerous
Table 1 shows the several inference rules for environmental health condition. With this rule, some variables are combined to produce the output
of health conditions. If represented like the 1st rule, IF (Temperature is Low)
Condition is Very Good). For combining some rules, “AND” operator is used in the rules of fuzzy. Defuzzification process is the process to restore the value of the degree of the fuzzy membership processing results in the form of the actual output value.
Equation (2) is a mathematical representation of a process called defuzzification. It is given by the following formula:
= μ ∗
μ
(2)
Where µA is membership function, dz is membership degree with
maximum values is 1, and Z is fuzzification output.
5. Proposed Adaptive Sleep Scheduling Fuzzy Logic Control (FLC) Approach in Environmental Health Monitoring
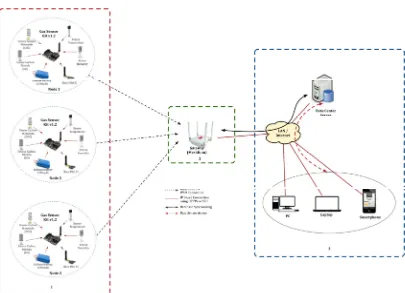
Figure 6. Proposed topology for environmental health monitoring system based on WSN
6.1 Data Sensor Transfer and Fuzzification of Decision Making
Figure 7. Fuzzification for the decision making
The output of environmental health condition is used as transmission control for sleep scheduling which is aimed to reduce the battery consumption. In this case, The fuzzy logic approach without sleep scheduling is shown in Algorithm 1. Furthermore, an algorithm with sleep scheduling is shown in Algorithm 2. We proposed the system which every 2 minutes sensor node will go to sleep and after that sensor node will wake up and sensing the data again.
Algorithm 1. Without sleep scheduling
∶ ! "# ! $! , &$" ', ( (2
( ∶ * + ! " , & ,
"# ! $! , $" ', ( (2 ∶ , ;
. ,$ $ ' ∶ , ; $ ' ' ∶ , ;
$ ' ' "# ! $! , $" ', (, (2 ;
. ,$ $ ' = $ ' ;
∶ ! /;
. ,$ $ ' == 0 {
= ". !' 3 "; } *, . ,$ $ ' == 1 { = "3 "; } *, . ,$ $ ' == 2 { = " + ! / "; } *, . ,$ $ ' == 3 { = " ";
} *, {
= " / ! $ "; }
Algorithm 2. With sleep scheduling condition using a fuzzy logic approach.
/ 7 '; operating system used by waspmote is Linux based mesh router. It is consist of 5 radios such as WiFi 2,4 GHz, WiFi 5 GHz, ZigBee, Bluetooth and 3G/GPRS. This system also provide the Geode Integrated AMD PCS x86 with Processor 500MHz, cache memory 128KB, RAM 256MB, Disk 8GB, Linux Debian kernel-2.6.30, WiFi Atheros AR5213A 802.11b/g 100mW -20dBm, XBee Pro 802.15.4 2.4GHz 100mW, and Ethernet Controller VIA VT6105M.
The data from the sensor node is transmitted to the gateway through ZigBee 802.15.4 protocol. All data from sensor node are saved to the database storage temporarily wherein the gateway, MySQL database is provided. Furthermore, the sensor data are collected in the gateway and synchronized to Data Center Server via TCP / IP for storing permanently.
6.3 Data Sensor Access
application or mobile phone anywhere and anytime as long as connected to the Internet.
6. EXPERIMENT AND ANALYSIS
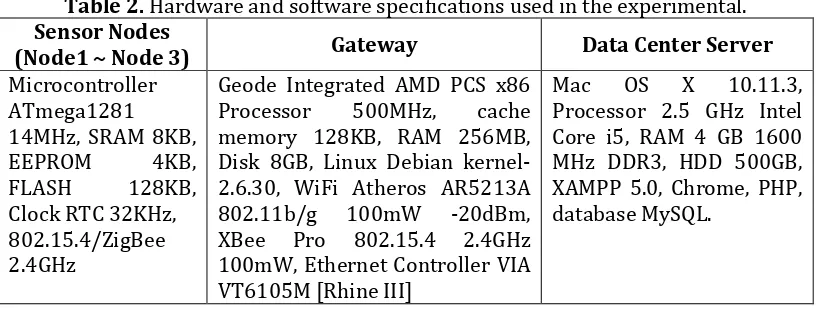
In this section, we explain the experiment and analysis of our WSN energy efficient based on IEEE 802.15.4 standard for environmental health monitoring with FLC approach. Table 2 shows software specifications and hardware which is used in the experiment.
Table 2. Hardware and software specifications used in the experimental.
Sensor Nodes
(Node1 ~ Node 3) Gateway Data Center Server
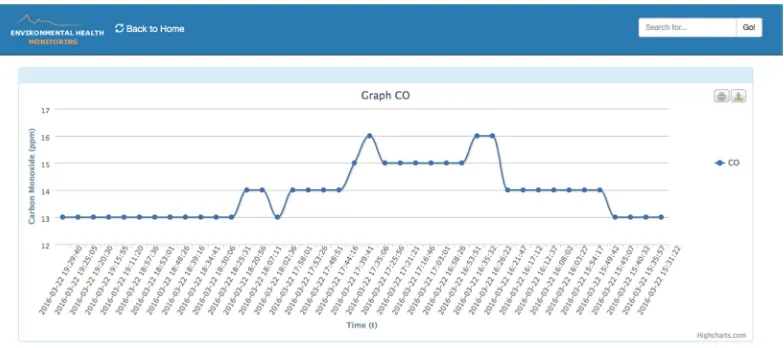
Figure 8. Data sensors access sensor via web-based application
Figure 9. Visualization data sensor from web-based application
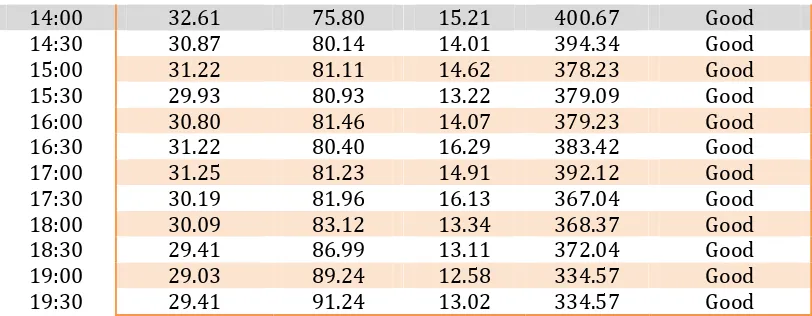
Table 3. Data sample of environmental health condition using fuzzy logic Time Temperature
(˚C)
Humidity (%RH)
CO (ppm)
CO2 (ppm)
Environmental Health Condition
09:00 32.35 80.48 18.48 372.94 Good
09:30 33.41 73.56 19.38 372.15 Good
10:00 33.16 72.73 18.73 390.04 Good
10:30 33.19 72.73 17.62 389.36 Good
11:00 35.54 66.45 19.55 400.87 Good
11:30 35.09 60.32 20.02 402.17 Good
12:00 34.87 62.64 17.33 396.93 Good
12:30 33.93 75.87 16.75 390.13 Good
13:00 34.03 73.77 17.48 389.67 Good
14:00 32.61 75.80 15.21 400.67 Good
In the experiment, sensor nodes will measure the environmental health condition monitoring system based on WSN with fuzzy logic as decision making about environmental conditions based on the measurement of sensor data. In this system, we collect sensor data such as temperature, humidity, CO and CO2 from the sensor nodes. The system automatically assigns the decision of the measurement results from data sensor in the form the warnings, those are Very Good (VG), Good (G), Average (A), Bad (B) and Dangerous (D).
Table 3 shows the results of measurements for environmental health condition by using fuzzy logic approach. We take measurements from 09:00
am until 19:30 pm.For the example at 09:00 am, the sensor data produced
Figure 10. Data sensor temperature, humidity, CO and CO2
From the measurement results of the environmental health conditions by using the fuzzy logic approach as shown in Table 3, we propose a process for transmitting data to the gateway based on the output fuzzy logic based on environmental health conditions which are aimed to save energy battery. Here, we compare three processes to save energy battery, namely without sleep scheduling, with sleep scheduling and adaptive sleep scheduling.
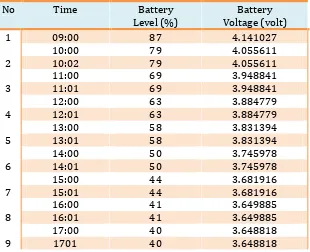
Without sleep scheduling: In this system, sensor node will capture data and sending data to the gateway continuously. So the power consumption of battery will be quickly exhausted like table 4 shows a power consumption battery without sleep scheduling.
Table 4. Power consumption battery without sleep scheduling
No Time Battery
Level (%)
Battery Voltage (volt)
1 09:00 87 4.141027
10:00 79 4.055611
2 10:02 79 4.055611
11:00 69 3.948841
3 11:01 69 3.948841
12:00 63 3.884779
4 12:01 63 3.884779
13:00 58 3.831394
5 13:01 58 3.831394
14:00 50 3.745978
6 14:01 50 3.745978
15:00 44 3.681916
7 15:01 44 3.681916
16:00 41 3.649885
8 16:01 41 3.649885
17:00 40 3.648818
18:00 38 3.627464
10 18:01 38 3.627464
19:00 35 3.595433
From the literature [17], it explained that the maximum power when the battery is fully charged with a level of the 4.2-volt battery is 100%. In this experiment, the initial battery condition in the process of data sensing is 87% and the final condition is 35%. So that there is a decrease in battery level around 52%. Figure 11 shows the battery power consumption without sleep scheduling.
Figure 11. Power consumption of battery without sleep scheduling
The initial of the battery voltage conditions at the beginning of data sending is 4.141027 volts and the final condition is 3.595433 volts. So that there is a decrease on battery voltage consumption around 0.545594 volts. Figure 12 shows the graph of battery voltage without sleep scheduling.
With sleep scheduling: In this system, sensor node will send data to the gateway by periodically, we set time to transmit the data every 2 minutes and after that Microcontroller Control Unit (MCU) and Gases Board will soon go to sleep. In this case, we use a hibernating process, because in this system [17], usage of power consumption when board condition is ON is around 9mA, Sleep 62 µA, Deep Sleep 62 µA, and the last is Hibernate, the consumption is only 0.6 µA. In the hibernate process, this mode decreases lower consumption without disconnection to the module. Waspmote board, gasses board and ZigBee will be off except the Read Time Clock (RTC). RTC only be used to set time wake up from the hibernating mode. Table 5 shows a battery power consumption with sleep scheduling.
Table 5. Power consumption battery with sleep scheduling
No Time Battery
Figure 13. The power consumption of battery with sleep scheduling
The initial of the battery voltage conditions when the process of sending data begins is 4.141027 volts and the final condition is 3.991549 volts. So that there is a decrease of battery voltage around 0.149478 volts. Figure 14 shows the graph battery voltage with sleep scheduling.
Figure 14. Consumption of battery voltage with sleep scheduling
gateway for every 4 minutes and until the conditions are considered as Dangerous (D), where the sensor node will transmit data for every 1 minute. Table 6 shows the battery power consumption with adaptive sleep scheduling.
Table 6. Power consumption battery with adaptive sleep scheduling
No Time Battery
Level (%)
Battery Voltage (volt)
1 09:00 87 4.141027
10:00 86 4.130350
2 10:02 86 4.130350
11:00 86 4.130350
3 11:01 86 4.130350
12:00 85 4.119673
4 12:01 85 4.119673
13:00 84 4.108996
5 13:01 84 4.108996
14:00 83 4.098319
6 14:01 83 4.098319
15:00 83 4.098319
7 15:01 83 4.098319
16:00 82 4.087642
8 16:01 82 4.087642
17:00 82 4.087642
9 1701 82 4.087642
18:00 81 4.076965
10 18:01 81 4.076965
19:00 80 4.066288
With adaptive sleep scheduling, the initial battery condition when the process of sending data is 87% and the final condition is 80%. So that there is a decrease in battery level around 7%. Figure 15 shows the power consumption battery with adaptive sleep scheduling.
The initial conditions of the battery voltage when the process of sending data begins is 4.141027 volts and the final condition is 4.066288 volts. So there is a decrease of battery voltage around 0.074739 volts. Figure 16 shows the graph battery voltage with sleep scheduling.
Figure 16. Consumption of battery voltage with adaptive sleep scheduling
Figure 17. Energy consumption battery level without sleep scheduling, sleep scheduling, and adaptive sleep scheduling
7. CONCLUSION
In this paper, we propose an environmental health monitoring system based on IEEE 802.15.4 standard for giving information to humans about the environmental health condition. This system uses various sensors such as temperature, humidity, carbon monoxide (CO) and carbon dioxide (CO2). Furthermore, our paper uses the fuzzy logic approach as making a decision based on the combination of multiple sensors. To improve the energy efficiency, we use an adaptive sleep scheduling based on the fuzzy logic output. This sleep scheduling is aimed to extend the sensor node lifetime. We also implemented this proposed system in real hardware and analyze the used power consumption by each node. In this experiment, the results are obtained by comparing three transmission processes. The proposed adaptive sleep scheduling significantly reduces the power consumption of WSN. We also provide the system to monitor the condition of environmental health in real-time condition, where all users can access using their smartphone and/or web-based application anywhere and anytime.
REFERENCES
[1] Sheikh Ferdoush, Xinrong Li, Wireless Sensor Network System Design
using Raspberry Pi and Arduino for Environmental Monitoring Applications, The 9th International Conference on Future Networks and Communications (FNC-2014), Niagara Falls, Canada, pp. 103-110, 2014.
[2] M.F Othmana, K. Shazalib, Wireless Sensor Network Applications: A
Study in Environment Monitoring System, International Symposium on Robotics and Intelligent Sensors 2012 (IRIS 2012), ScienceDirect, pp. 1204-1210, 2012.
[3] Dunfan Ye, Daoli Gong, Wei Wang, Application of Wireless Sensor
Networks in Environmental Monitoring, Power Electronics and Intelligent Transportation System (PEITS), Shenzhen, pp. 205 - 208, 2009.
[4] S. Abraham, Xinrong Li, A Cost-Effective Wireless Sensor Network
System for Indoor Air Quality Monitoring Applications, Future Networks and Communications (FNC-2014), ScienceDirect, pp. 165-171, 2014.
[5] Octavian A. Postolache, J. M. Dias Pereira, and P. M. B. Silva Girao, Smart
Sensors Network for Air Quality Monitoring Applications, IEEE Transactions on Instrumentation and Measurement, Vol. 58, pp. 3253 - 3262, 2009.
[6] M. Dutta, S. Bhowmik, and C. Giri, Fuzzy Logic Based Implementation
for Forest Fire Detection Using Wireless Sensor Network, Smart Innovation, Systems and Technologies, Switzerland, pp. 319-327, 2014
[7] N. Fahmi, S. Huda, M.U.H Al Rasyid, A. Sudarsono, Fuzzy Logic for an
Electronics Engineering International Conference (RAIEIC 2015), Medan, 2015.
[8] M.R Tripathy, K. Gaur, S Sharma, and G.S. Virdi, Energy Efficient Fuzzy
Logic Based Intelligent Wireless Sensor Network, Progress In Electromagnetics Research Symposium Proceedings, Cambridge, USA, pp. 91-95, 2010.
[9] Giovanni Pau, Power Consumption Reduction for Wireless Sensor
Networks Using A Fuzzy Approach, International Journal of Engineering and Technology Innovation (IJETI), Taiwan, 2015.
[10] R. Sabitha, K.T. Bhuma, and T. Thyagarajan, Design and Analysis of
Fuzzy Logic and Neural Network Based Transmission Power Control Techniques for Energy Efficient Wireless Sensor Networks, Advances in Intelligent Systems and Computing, Springer International Publishing,
VOl.1, pp. 295-303, 2015.
[11] A. Sudarsono, P. Kristalina, M.U.H Al Rasyid, R. Hermawan, An
implementation of secure data sensor transmission in Wireless Sensor Network for monitoring environmental health, Computer, Control, Informatics and its Applications (IC3INA), Bandung, pp. 93 - 98, 2014.
[12] Jang, J.S.R C.T. Sun dan E. Mizutani. 1997. Neuro-Fuzzy and Soft
Computing. London : Prentice-Hall.
[13] P. Patil, U. Kulkarni, B.L. Desai,V.I. Benagi and V.B. Naragund, Fuzzy
Logic Based Irrigation Control Using Wireless Sensor Network for Precision Agriculture, AIPA, India, pp. 262-269, 2012
[14] Waspmote Specification - Spesifikasi hardware waspmote.
https://www.libelium.com/products/waspmote/hardware/ [accessed on April 2016].
[15] Libelium - Gases 2.0 Technical Guide. https://www.libelium.com/
[accesed on April 2016].
[16] Meshlulim – Meshlium Datasheet and documentation,
http://www.libelium.com/development/meshlium/documentation/
[accesed on April 2016].
[17] Libelium - Waspmote Power Programming Guide,
![Figure 1. Architecture fuzzy logic system [13]](https://thumb-ap.123doks.com/thumbv2/123dok/4040595.1984015/5.595.126.469.407.529/figure-architecture-fuzzy-logic-system.webp)