M – 25
PROFILE ANALYSIS OF
UNMET NEED FOR FAMILY PLANNING INDICATORS
USING SDKI AND SUSENAS DATA.
Din Nurika Agustina, Anang Kurnia, Anik Djuraidah
Department of Statistics, Bogor Agricultural University, Indonesia email: [email protected]
Abstract
Data requirements for government development programs, present in time series and small area estimation with good accuracy, is necessary to achieve the objectives of the program effectively and efficiently.
There is an indicators used by Indonesia government to measure the achievement of the population growth control by family planning. It is namely unmet need for family planning indicators. The indicator is obtained from the Indonesian Demographic and Health Survey (IDHS) conducted in 1987, 1991, 1994, 1997, 2002-2003, 2007 and 2012 by provincial level estimation. Noting the estimation period and the level of estimation, unmet need for family planning availability in annual period by regency/municipality level estimation is necessary for better monitoring the achievement of family planning programs.
Alternative fulfillment of the necessarily is unmet need for family planning estimation. In this research, the data estimation is done using fertility and family planning data which available in the National Socioeconomic Survey (Susenas). Susenas is an annual survey with regency/municipality level estimation. The profile analysis results of the data on IDHS and susenas 2012, can statistically prove the similarities of both data. Then based on the tests result, Susenas data conclude to be used for estimate indicator of unmet need for family planning by regency/ municipality level estimation.
Key words: Profile Analysis, Family Planning, SDKI, Susenas.
INTRODUCTION Background
Data needs is fundamental to the government's development programs. So the data availability would have to have good accuracy. The presentation of statistical data in time series and small area also important to support the programs. Then the data can be used to support the planning, process and evaluation stage of the programs better.
For the Indonesian government, the overall enumeration (census) need a large of costs and enormous resources. Large population, vast archipelago as well as the difficulty of access in some remote areas is also obstacles. Noting the importance of the data need and the various constraints that exist, solution certainly needed.
Survey is one of the solutions to meet the lighter costs of data need. In a survey, sample election conduct in scientific sampling method. So there is do doubt that the sample selected can be represent the diversity of the population. Furthermore, based on the survey data, the expected of real picture in the population (parameters) can be obtained with good accuracy.
M-192
estimation level, the availability of the indicator with annual period by regency/municipality level estimation is needed.
Formulation Of The Problem
This research using Susenas 2012 data to estimate the indicators of unmet need for familly plaanning. IDHS and Susenas are similar survey. Both of them use households as the research object. Moreover, Susenas also provides variables relating to indicators definition. Susenas advantages, annual period and the regency/municipality level of estimation, can be applied to unmet need for family indicators.
Research Purposes
The objectives of this study are:
1. Discuss the estimation use in this study, the selection of Susenas variables that correspond to the definition of unmet need for family planning indicators.
2. Review the profile analysis, to determine the similarity estimation of unmet need for family planning indicators, using Susenas data compared to the results of IDHS.
3. Apply the estimation of unmet need for family planning indicators, using Susenas data in 2012 by regency/municipality.
Benefits Of Research
Studies conducted in this study can be applied to other indicators with the same background. So that the needs of various indicators with time series and smaller area level of estimation can be met.
In addition, this research can be referenced by other studies. By utilizing the Susenas variables, in depth study of the various aspects that affect the level of unmet need for family planning can be done. The assessment must also be carried out at the regency/municipality level of estimation.
RESEARCH METHOD Material
This research using unmet need for family planning indicators in 2012 from idhs and susenas data. The criteria used within the DHS program to identify women with unmet need for family planning have recently been revised (Badan Pusat Statistik, Badan Koordinasi Keluarga Berencana Nasional, Kementerian Kesehatan, and ICF International, 2013). The revised definition was employed for determining the women who have an unmet need for family planning. Specifically, women are considered to have unmet need for spacing if they are: 1. At risk of becoming pregnant, not using contraception, and either do not want to become
pregnant within the next two years, or are unsure if or when they want to become pregnant. 2. Pregnant with a mistimed pregnancy.
3. Postpartum amenorrheic for up to two years following a mistimed birth and not using contraception.
Women are considered to have unmet need for limiting if they are:
1. At risk of becoming pregnant, not using contraception, and want no (more) children. 2. Pregnant with an unwanted pregnancy.
Women who are classified as infecund have no unmet need because they are not at risk of becoming pregnant.
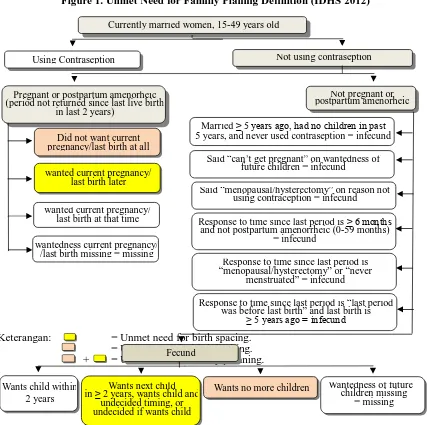
Determination of women with unmet need for family planning is calculated from the results of IDHS 2012 as a combination of several variables as in Figure 1.
Figure 1. Unmet Need for Familly Plannig Definition (IDHS 2012)
Keterangan: = Unmet need for birth spacing. = Unmet need for birth limiting. + = Unmet need for family planning.
Not pregnant or postpartum amenorheic Currently married women, 15-49 years old
Pregnant or postpartum amenorheic (period not returned since last live birth
in last 2 years)
Using Contraseption Not using contraseption
Fecund
Wants child within 2 years
Wants next child in ≥ 2 years, wants child and
undecided timing, or undecided if wants child
Wants no more children Wantedness of future children missing
= missing Married ≥ 5 years ago, had no children in past 5 years, and never used contraseption = infecund
wanted current pregnancy/ last birth later Did not want current pregnancy/last birth at all
wantedness current pregnancy/ /last birth missing = missing
Said “can’t get pregnant” on wantedness of future children = infecund
Said “menopausal/hysterectomy” on reason not using contraception = infecund
Response to time since last period is ≥ 6 months and not postpartum amenorrheic (0-59 months)
= infecund
Response to time since last period is “menopausal/hysterectomy” or “never
menstruated” = infecund
Response to time since last period is “last period was before last birth” and last birth is
≥ 5 years ago = infecund
M-194
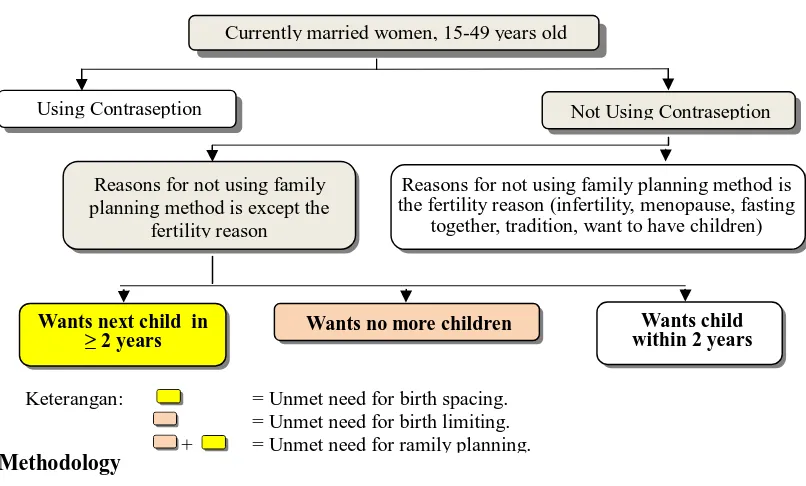
Estimation of unmet need for family planning indicators calculate from Susenas obtained from a combination of several variables as Figure 2.
Figure 2. Estimation of Unmet Need for Family Planning (Susenas 2012).
Methodology
Profile Analysis
Profile analysis pertains to situation in wich a battery of p treatnents (tests, questions, and so forth) are administered to two or more groups of subjects. All response must be expressed in similiar units. Further, it is assumed that the responses for the different groups are independent of one another. Ordinarily, we might pose the question wheter the population mean vectors are same (Johnson and Wichern, 2002).
Consider the group 1 means for three treatments (p=3 ) : µ’1 = [µ11 µ12 µ13] and the
group 2 means for three treatments (p=3) : µ’2 = [µ21 µ22 µ23]. There are three hypotheses that
will be tested in the analysis of profile (Mattjik and Sumertajaya, 2011) for both of groups: 1. Test for parallel profiles.
H01: µ1i - µ1i-1 = µ2i - µ2i-1 untuk i = 2,3.
It is also can be written as
H01: Cµ1 = Cµ2, where C is contrast matrix
Reject H01 at level if:
2 2 _ 1 _ 1
2 1 2
_ 1 _ 2
) (
' )
1 1 ( ' )'
( CS C C x x c
n n C x x
T pooled
where
) ( )
1 )( 2 (
2 1
, 1 2
1 2 1
2
p n n p F p n n
p n
n
c
When the profiles are parallel, the mean vector of the first group is either above the second (µ1i > µ2i), or vice versa. The parallel hypothesis also related to the presence of interaction
between treatment groups. If the profiles are parallel, it means there is no interaction between treatments.
Wants child within 2 years Wants next child in
≥ 2 years Wants no more children
Keterangan: = Unmet need for birth spacing. = Unmet need for birth limiting. + = Unmet need for ramily planning.
Currently married women, 15-49 years old
Using Contraseption Not Using Contraseption
Reasons for not using family planning method is except the
fertility reason
Reasons for not using family planning method is the fertility reason (infertility, menopause, fasting
together, tradition, want to have children)
(2)
(3)
1
1
0
0
1
1
1 xpp
2. Test for coincident profiles. H02: 1’μ1 = 1’μ2.
H02 can be tested by the usual two sample t-statistic based on the univariate observations.
Reject H02 (coincident profiles) at level if:
)
(
)
2
(
'
1
)
1
1
(
)
(
'
1
)
(
'
1
'
1
)
1
1
(
)
(
'
1
2 2 1 , 1 2 2 2 1 2 2 1 2 1 2 2 1 1 2 1 2 1 2
n n n n pooled pooledF
t
S
n
n
x
x
T
x
x
S
n
n
x
x
T
The hypotesis of coincident test related to the similarity effect of each treatment on each group. When the profiles are coincide, the mean for each treatment of each group will be the same.
3. Test for level profiles.
H0: μ1 = μ2 = ... = μp. It is also can be written as H01: Cµ = 0, where C is contrast matrix
given by equation (1). Reject H03 (profiles level) at level if:
Where S is the sample covariance matrix based on all n1+n2 observations and
)
(
1
)
1
)(
1
(
1 2 1 , 1 2 1 2 1 2
F
p n n pp
n
n
p
n
n
c
Level profiles hypothesis relates to the equality all variables mean.
RESULT AND DISCUSSION
Data Exploration of Unmet Need for Family Planning (IDHS and Susenas 2012).
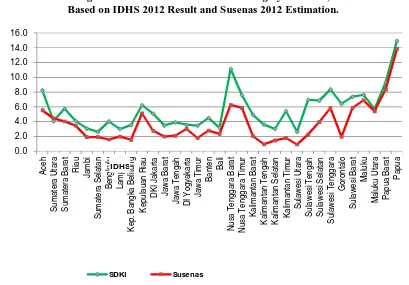
There are pictures to compare the unmet need for birth spacing indicator (figure 3), unmet need for birth limiting indicator (figure 4) and unmet need for family planning indicator (figure 5), based on IDHS 2012 results and the estimation results using Susenas 2012 by province.
Figure 3. Unmet Need for Birth Spacing by Province, Based on IDHS 2012 Result and Susenas 2012 Estimation.
0.0 5.0 10.0 15.0 20.0 25.0 A ce h S um at er a U ta ra S um at er a B ar at R ia u Ja m bi S um at er a S el at an B en gk ul u La m pu ng K ep . B an gk a … K ep ul au an R ia u D K I J ak ar ta Ja w a B ar at Ja w a Te ng ah D I Y og ya ka rt a Ja w a Ti m ur B an te n B al i N us a Te ng ga ra … N us a Te ng ga ra … K al im an ta n B ar at K al im an ta n Te ng ah K al im an ta n S el at an K al im an ta n Ti m ur S ul aw es i U ta ra S ul aw es i Te ng ah S ul aw es i S el at an S ul aw es i Te ng ga ra G or on ta lo S ul aw es i B ar at M al uk u M al uk u U ta ra P ap ua B ar at P ap ua SDKI Susenas (4) 2 2 1 2 1 2 1 1 2 1 2 1 2 1 1 1
x
n
n
n
x
n
n
n
n
n
x
x
x
n j j n j j
1 22
1
)
'
'
'
(
n
n
x
C
CSC
C
x
c
F
(5)(6)
(7)
M-196
Figure 4. Unmet Need for Birth Limiting by Province, Based on IDHS 2012 Result and Susenas 2012 Estimation.
Figure 5. Unmet Need for Family Planning by Province, Based on IDHS 2012 Result and Susenas 2012 Estimation.
There are conclusions based on figure 3-5 exploration. The IDHS profile on the unmet need for family planning for birth spacing, is relatively higher than the Susenas profile. While the unmet need for birth limiting profile resulted from IDHS is relatively low compared Susenas profile. Furthermore, the unmet need for family planning profile resulted from IDHS and Susenas profile can be relatively the same.
Profile Analysis of Unmet Need for Family Planning Using SDKI and Susenas Data. Although the parallelism, coincidenity and level similiarity of the profiles can be inferred from the profile plot as the third figure (figure 3-5). However, exploration of the data from the image needs to be strengthened by a formal test, one of which is facilitated by the profile analysis method (Mattjik and Sumertajaya, 2011)
Parallel Test.
Using SAS software, parallel test results obtained from unmet need for birth spacing, birth control and total, based on IDHS results in 2012 compared to the estimation results using Susenas in 2012 as follows:
40.547005
) (
' )
1 1 ( ' )'
( 2
_ 1 _ 1
2 1 2
_ 1 _
2
x x C C CS n n C x x
T pooled
)
05
.
0
(
3
33
33
)
1
3
)(
2
33
33
(
)
(
)
1
)(
2
(
63 , 2 ,
1 2
1 2 1 2
2
1
F
F
p
n
n
p
n
n
c
p n n p
3854 , 6 1428 , 3 63 128
The parallel test result decide to reject H01at level α=0.05. It means the profiles are not
parallel.
Coincident Test.
Using the GLM procedure of SAS software, obtained by result of analysis of variance (Anova) for each variable. With the null hypothesis (H02) that each profile for variable: unmet
need for birth spacing, birth control and total are coincide. The summary can be seen in Table 2 .
Table2. Summary Statistic F Value and The Conclusion by Each Unmet Need for Family Planning Indicator as Dependent Variable.
Dependent Variable Statistic F Value Conclusion
Unmet for Birth Spacing 0.0065 Reject H0
Unmet for Birth Limiting 0.0133 Reject H0
Total 0.9943 Not enough evidence to reject H0
Several conclusion can be infered from the results of parallel and the coincident. The comparation of unmet need for birth spacing and birth limiting from the IDHS results and Susenas estimation is not parallel nor coincide. Unlike the case with the profile of unmet need for family planning in total, the conclusion based on F values for the profile at the 0.05 level statistically proved to coincide.
Level Test.
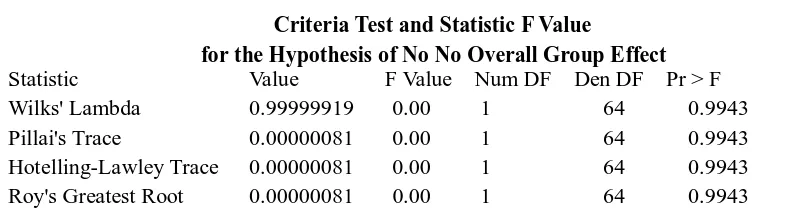
Furthermore, the similarity test is done with only a percentage of the data involves unmet family planning needs in total. As can be observed in the test criteria and the value of the F statistic below.
M-198
Criteria Test and Statistic F Value
for the Hypothesis of No No Overall Group Effect Statistic Value F Value Num DF Den DF Pr > F Wilks' Lambda 0.99999919 0.00 1 64 0.9943 Pillai's Trace 0.00000081 0.00 1 64 0.9943 Hotelling-Lawley Trace 0.00000081 0.00 1 64 0.9943 Roy's Greatest Root 0.00000081 0.00 1 64 0.9943
Noting formal test on profile analysis that we have done, we can take a decision that the estimation of unmet need for family planning in total using susenas data in 2012 equal with the percentage of unmet need for family planning in total resulted by IDHS 2012. Thus, we can apply the results of the susenas processed to estimate the percentage of unmet need for family planning in total. It certainly can be carried out in accordance with the advantages possessed by susenas that annual period and the estimated level and regency/municipality.
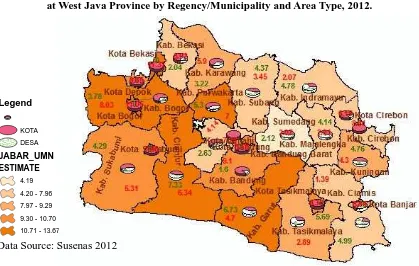
Estimation of Unmet Need for Familly Planning in total, at West Java Province by Regency/Municipality.
The following are figure and thematic maps, which shows the percentage of unmet need for family planning in total at West Java Province by regency/municipality. Images and thematic maps below are the results of Susenas 2012 data proceesed.
Figure 6. Estimation for Unmet Need for Familly Planning in total, at West Java Province by Regency/Municipality, 2012.
Data Source: Susenas 2012 11.81 9.6 13.67 10.7 11.43
8.58 6.38 9.07 7.35 7.05 4.19 6.84 7.82 12.3 9.11 7.96 6.78 11.05
7.46 9.19 8.81 11.37 9.85
7.28
9.68 9.29 9.48
0 2 4 6 8 10 12 14 16 18 K ab . B o go r K ab . S u k ab u m i K ab . C ian ju r K ab . B an d u n g K ab . G ar u t K ab . T as ik m al ay a K ab . C iam is K ab . K u n in gan K ab . C ir eb o n K ab . M aj al en gk a K ab . S u m ed an g K ab . I n d ram ay u K ab . S u b an g K ab . P u rw ak ar ta K ab . K ar aw an g K ab . B ek as i K ab . B an d u n g B ar at K o ta B o go r K o ta S u k ab u m i K o ta B an d u n g K o ta C ir eb o n K o ta B ek as i K o ta D ep o k K o ta C im ah i K o ta T as ik m al ay a K o ta B an jar
Figure 7. Thematic Map of Estimation for Total Unmet Need for Familly Planning, at West Java Province by Regency/Municipality and Area Type, 2012.
Data Source: Susenas 2012
CONCLUSION AND SUGGESTION
Conclusion
Estimation is done in this study. Based on the variables selection, using Susenas data 2012, according to the definition of indicators of unmet need for family planning resulted by IDHS 2012 can be applied properly.
Assessment of profile analysis performed, statistically proving that the estimation of unmet need for family planning in total using Susenas 2012 is equal to the indicator resulted by IDHS 2012. Furthermore, the Susenas advantages are annual survey period and the estimation level of regency/municipality can be applied to the indicators. Then the estimation of unmet need for family planning in total can be provided in annual period also regency/municipality level of estimation.
Suggestion
Refers to the level of estimation for the indicator resulted by this study, an analysis of the factors that affect to the unmet need for family planning in total can also be performed by regency/ municipality level estimation.
Estimation of the smaller area level than conducted by this study can be realized with additional supporting data at the level, using appropriate statistical methods such as small area estimation.
REFERENCES
Badan Pusat Statistik, Badan Koordinasi Keluarga Berencana Nasional, Kementerian Kesehatan, dan ICF International. (2013). Indonesia Demographic and Health Survey 2012. Jakarta: BPS, BKKBN, Kemenkes, and ICF International.
Johnson, R. A., and Wichern, D. W. (2002). Applied Multivariate Statistical Analysis Fifth
Legend
KOTA DESA
JABAR_UMN
ESTIMATE
M-200 Edition, New Jearsey: Prentice Hall Inc.
Mattjik, A. A., Sumertajaya, I. M. (2011). Sidik Peubah Ganda. Bogor: Departemen Statistika FMIPA-IPB.