Summary Two-year-old Sitka spruce (Picea sitchensis (Bong.) Carr.) seedlings were subjected to nitrogen (N) defi-ciency for 1 year and then treated twice weekly with N fertilizer solutions (0 to 224 mg N l−1) for 20 weeks. Needle growth in terms of projected area and cell number, and photosynthesis in terms of pigment concentration, net photosynthetic rate (PN), stomatal conductance to CO2 (GS) and intercellular partial pressure of CO2 (Ci) were measured. Nitrogen deficiency caused significant reductions in needle size and needle number per shoot. Refertilization caused free growth, and increases in size and cell number of needles arising from primordia initiated during N deficiency. Nitrogen concentration did not affect mean cell size, indicating that N nutrition determined needle size through cell division and not cell expansion, and that favorable N supply during needle expansion was more impor-tant in determining final needle size than limitations imposed on the primordia during the N deficiency pretreatment. Nitro-gen deficiency caused reductions in chlorophyll and carotenoid concentrations, PN and GS, and an increase in Ci. Refertilization caused a reversal of these changes, and the magnitude of the responses increased with increasing N supply. The large in-creases in many of the measured parameters in response to the small amounts of added N suggest that young Sitka spruce trees respond positively to N supply and are tolerant of all but severe N deficiency.
Keywords: intercellular partial pressure, photosynthetic rate, pigment concentration, stomatal conductance.
Introduction
Nitrogen (N) is a major nutrient determining productivity of deciduous and evergreen forest species (Helms 1976). A de-tailed knowledge of the response of trees to available nutrients is needed to improve the efficiency of forest management and to increase productivity on nutrient-poor sites. Because the nutrient requirement of tree stands decreases with increasing age (Miller 1981), it is desirable to maximize stand productiv-ity as early as possible and to alleviate nutrient deficiencies in the soil without providing excess fertilizer. In an earlier study, we characterized some of the effects of N deficiency on young Sitka spruce and showed that these effects can be reversed by
application of N fertilizer at the start of the growth season (Chandler and Dale 1993). Here we report a study designed to elucidate how productivity is limited by N supply and to determine responses to small additions of N. Specifically, we examined the effects of increases in N supply on needle growth and photosynthesis of young Sitka spruce (Picea sitchensis (Bong.) Carr.) trees previously grown in a N-deficient regime. We chose to study Sitka spruce because it is frequently grown on N-deficient sites throughout the United Kingdom.
Materials and methods
Plant material
In May 1988, 40 two-year-old Sitka spruce seedlings (Queen Charlotte Islands Provenance) were planted in 20 cm3 diameter pots in Edzell grit and grown in the open. Five control trees received 20 cm3 of Hocking’s nutrient solution containing 112 mg l−1 N (supplied as NO3− and NH4+, Hocking 1972), and the remaining 35 trees received solution lacking N. Solution was applied twice each week from May until September 1988 (Chandler and Dale 1993), and fertilization of control trees was resumed in May 1989. Between these times, trees received only water. On May 1, 1989, the N-deficient trees were divided into seven groups of five trees, and each group was fertilized twice each week with Hocking’s solution containing 0, 7, 14, 28, 56, 112 or 224 mg l−1 N (supplied as NO
3 − and NH
4 +). Trees
were left in the open to stimulate field conditions. On August 4, 1989, all five trees from each treatment, including the control, were placed in a controlled environment room in a 16-h photoperiod (PAR 270--290 µmol m−2 s−1) at 20 °C. After 1 week, measurements were performed on three trees selected at random from each treatment.
Shoot and needle measurements
For each of the three trees per treatment, leader shoot length was measured and the total number of needles on the leader shoot counted. Needle projected areas of the terminal shoots of Whorl 2 were measured with a Quantimet Image Analyzer (Cambridge Instruments Ltd., Cambridge, U.K.). The number of cells per needle was determined as described by Chandler and Dale (1990). Some trees in treatments receiving more than
Nitrogen deficiency and fertilization effects on needle growth and
photosynthesis in Sitka spruce (
Picea sitchensis
)
J. W. CHANDLER
1and J. E. DALE
21
Max Planck Institut für Züchtungsforschung, 10 Carl von Linné Weg, 50829 Köln, Germany
2 Division of Biological Sciences, The King’s Buildings, Mayfield Road, Edinburgh EH9 3JN, Scotland, U.K.
Received January 11, 1994
14 mg l−1 N showed free growth, i.e., growth from needle primordia initiated during the current season. For these trees, three needles per treatment were sampled from terminal shoots of Whorl 2 that had primordia initiated in both 1988 and 1989. For trees receiving 0 or 14 mg l−1 N, three needles were taken from the midpoint of terminal shoots of Whorl 2. Mean fresh weight per cell was calculated from needle fresh weight and cell number per needle.
Pigment concentration and photosynthetic variables
Chlorophyll and carotenoid concentrations were measured on 0.5 g samples of needles initiated in 1988 and collected from the midpoint of the shoot (Chandler and Dale 1993). Net photosynthetic rate (PN), stomatal conductance to CO2 (Gs) and intercellular partial pressure of CO2 (Ci) were measured for terminal shoots from Whorl 2 with an LCA 2 portable infrared gas analyzer system and data logger (Analytical De-velopment Co. Ltd., Hoddesdon, Herts, U.K.) using an open system with a flow rate of 500 cm3 min−1. The analyzer was used in differential mode, and PN was calculated on the basis of total needle projected area per shoot.
Statistical analysis
Significant differences between treatment means for each vari-able were established by one-factor analysis of variance and Multiple Range Testing (Parker 1979). All significant differ-ences quoted are P≤ 0.05.
Results
Shoot and needle size
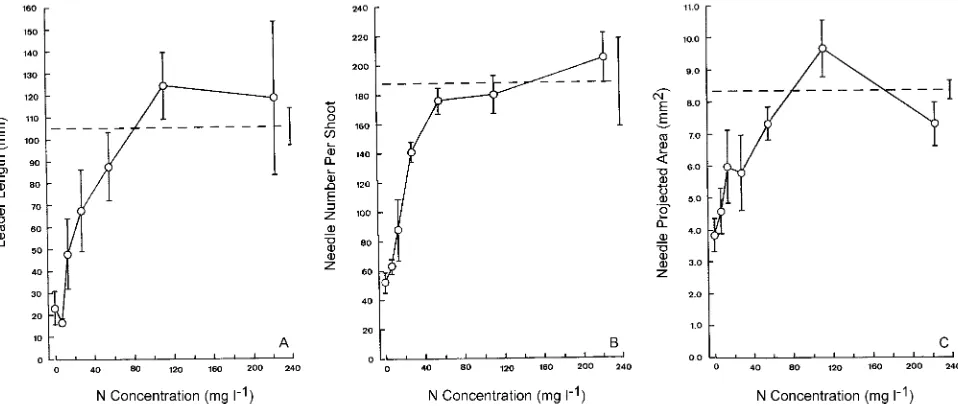
Lengths of the leader shoots were variable, but mean shoot lengths increased with increasing concentrations of supplied N up to 112 mg l−1 (Figure 1A). Shoot lengths of trees receiving
the two highest N concentrations exceeded, but not signifi-cantly, the shoot lengths of trees not subjected to N deficiency. Needle number per shoot also increased with increasing N supply (Figure 1B). The projected area of needles of trees receiving the highest concentrations of N approached the val-ues of needles of trees not subjected to N deficiency, reflecting a doubling of needle area compared with needles from N-defi-cient trees not given N (Figure 1C). It is not known whether this increase was due to an increase in needle length or width, or both.
For needles expanding from primordia initiated in 1988, i.e., before treatments began, increasing the N supply above 14 mg l−1 caused an increase in cell number and needle fresh weight (Figures 2A and 2B). For needles initiated in 1989 as a result of free growth, fresh weight and cell number reached a maxi-mum in the 112 mg l−1 N treatment (Figures 2A and 2B), and values were higher than those for primordia formed in 1988 at all N concentrations except 224 mg l−1. Because all trees exhibited free growth except those receiving the two lowest N concentrations, it was not possible to determine whether dif-ferences in cell number and needle fresh weight between needles initiated in 1988 and 1989 were due to time of primor-dium initiation or to effects of needles position on the shoot. There was no significant difference in mean cell volume (esti-mated as mean fresh weight per cell) in needles initiated in either year for any of the N treatments compared with the control (Figure 2C).
Photosynthetic components
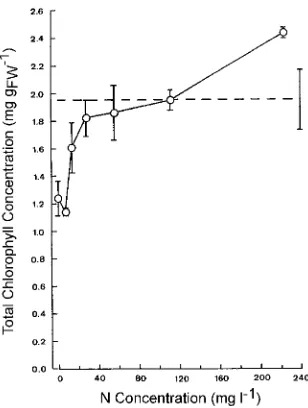
Total chlorophyll concentration increased with increasing N supply (Figure 3A), and only values for trees in the 1 and 7 mg l−1 treatments were significantly lower than the control value. The same quantitative trend was observed for carotenoid con-centration (data not shown). There was a slight increase in chlorophyll a/b ratio with increasing N concentrations up to 28
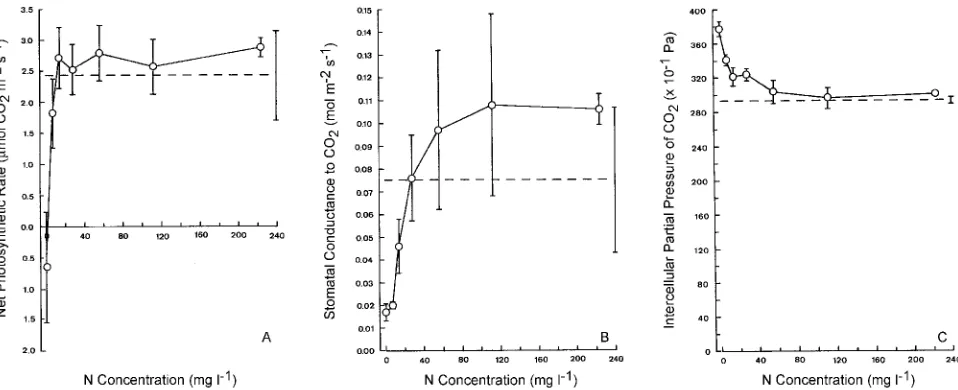
mg l−1, but no ratios were significantly lower than the control ratio (data not shown). Net photosynthetic rate increased with increasing N concentration up to 28 mg l−1 (Figure 4A). Net photosynthetic rate was significantly lower in trees in the 0 mg l−1 N treatment than in control trees and in trees in all other treatments, with respiration exceeding photosynthesis. Sto-matal conductance increased with increasing N concentration up to 112 mg l−1 (Figure 4B), but variability was large, and no treatment mean was significantly different from the control. The value of Ci decreased with increasing N concentration up
to about 56 mg l−1 and approached the control value at higher concentrations (Figure 4C). Values of Ci for trees in the 0 mg l−1 N treatment were significantly higher than for trees in the other treatments.
Discussion
Effect of N on needle size and cell number
Needle growth was inhibited in trees grown under conditions of N deficiency (cf. Radin 1983, Chandler and Dale 1993). Refertilization resulted in increases in needle length and pro-jected area as has been observed in other species (Brix and Ebell 1969, Dale 1982, Terry et al. 1983). Refertilization with high N concentrations resulted in larger needles with more cells than refertilization with low N concentrations; however, there was no effect of N on mean cell size, indicating that the effect of N nutrition was on cell division rather than on cell expansion. This contrasts with findings in other species where increasing N supply increases mean cell size, the number of cells per leaf, and the rate of cell expansion (Terry 1970, Radin and Parker 1979). In Sitka spruce, the differences in needle size at different N concentrations were determined by cell number regardless of whether needles were initiated under N-deficient conditions during 1988, or by free growth under nutritionally favorable conditions during 1989. Because cell number was not measured throughout the growth season, it is not known whether the increase in needle cell number in response to N refertilization was a result of more rapid cell division or a longer period of cell division. Chandler and Dale (1990) re-ported that the number of cells in the needle primordium of Sitka spruce, which is also affected by P and K deficiency and position on the shoot, predetermines final needle cell number; however, the increase in cell number of needles initiated in N-deficient conditions following the N fertilization in the Figure 2. Needle cell number (A), fresh weight (B) and fresh weight per cell (C) for N-deficient pot-grown trees of Picea sitchensis fertilized with a range of N concentrations. Measurements were taken in August 1989 on needles expanded during 1989 from primordia formed in 1988 (d), or from primordia initiated by free growth in 1989 (s). Points represent means ± SE for three measurements, each from different trees. The control value ± SE is shown by the broken horizontal line and bar.
subsequent season suggests that the limitations on cell number established in the primordium can be overridden by increasing N supply during needle expansion in small 2- to 3-year-old plants. It is not known whether the addition of N to older N-deficient trees also results in increased growth.
Effect of N on photosynthesis
The reduction in chlorophyll a/b ratio at low N concentrations indicates that a higher proportion of chlorophyll b relative to chlorophyll a was present in photosynthetic reaction centers at low N concentrations than at high N concentrations (cf. Chan-dler and Dale 1993). Ingestad and Kahr (1985) also observed regreening in needles of Pinus sylvestris L., Picea abies L. and Pinus contorta Dougl. when seedlings grown in low-N nutrient solutions were resupplied with N.
The decrease in Gs with increasing N deficiency (cf. Ryle and Hesketh 1969, Nevins and Loomis 1970) may be associ-ated with a reduction in size of the stomatal aperture, as found by Shimshi (1967) for wheat. The decrease in Ci with increas-ing N concentration implies that the efficiency of CO2 transfer to the mesophyll cells increases with increasing N supply, and therefore that mesophyll conductance to CO2 increases in parallel with Gs to control CO2 availability to cells under conditions of varying N supply, and may explain the increase in PN with increasing N concentrations up to 14 mg l−1. At high N concentrations, PN may have been limited by light intensity, which was not saturating.
The finding that, for many of the variables studied, 20 cm3 of solution containing 28 mg l−1 N (equivalent to 0.56 mg N) supplied twice each week throughout the growth period re-stored values to those of the controls suggests that Sitka spruce is tolerant of low N supply and is very sensitive to small additions of N.
Acknowledgments
JWC thanks the Natural Environmental Research Council for a stu-dentship held in cooperation with the Forestry Commission. We thank M.P. Coutts of the Forestry Commission for his help throughout this project.
References
Brix, H. and L.F. Ebell. 1969. Effects of N fertilization on growth, leaf area and photosynthetic rate in Douglas-fir. For. Sci. 15:189--196. Chandler, J.W. and J.E. Dale. 1990. Needle growth in Sitka spruce
(Picea sitchensis): effects of nutrient deficiency and needle position within shoots. Tree Physiol. 6:41--56.
Chandler, J.W. and J.E. Dale. 1993. Photosynthesis and nutrient sup-ply in needles of Sitka spruce (Picea sitchensis (Bong.) Carr.). New Phytol. 125:101--111.
Dale, J.E. 1982. The growth of leaves. Edward Arnold, London, 60 p. Helms, J.A. 1976. Factors influencing net photosynthesis in trees: an ecological viewpoint. In Tree Physiology and Yield Improvement. Eds. M.G.R. Cannell and F.T. Last. Academic Press, London, 567 p. Hocking, D. 1972. Comparison of proprietary with prescription nutri-ent solutions for Alberta white spruce and lodgepole pine. Can. Dept. Environ., For. Serv. Inf. Rep. NOR-X-35, Alberta, Canada, 31 p.
Ingestad, T. and M. Kahr. 1985. Nutrition and growth of coniferous seedlings at varied relative N addition rate. Physiol. Plant. 65:109--116.
Miller, H.G. 1981. Forest fertilization: some guiding concepts. For-estry 54:157--167.
Nevins, D.J. and R.S. Loomis. 1970. Nitrogen nutrition and photosyn-thesis in sugar beets (Beta vulgaris L.). Crop Sci. 10:21--25. Parker, R.E. 1979. Introductory statistics for biology. Studies in
Biol-ogy Series No. 43. Edward Arnold, London, 122 p.
Radin, J.W. 1983. Control of plant growth by N: differences between cereals and broadleaf species. Plant Cell Environ. 6:65--68. Radin, J.W. and L.L. Parker. 1979. Water relations of cotton plants
under N deficiency. Plant Physiol. 64:495--454.
Ryle, G.J.A. and J.D. Hesketh. 1969. Carbon dioxide uptake in N-de-ficient plants. Crop Sci. 9:451--454.
Shimishi, D. 1967. Leaf chlorosis and stomatal aperture. New Phytol. 66:455--461.
Terry, N. 1970. Developmental physiology of sugar beet. 2. Effects of temperature and N supply on the growth, soluble carbohydrate content and N content of leaves and roots. J. Exp. Bot. 21:477--496.