Chapter Four Finding and Discussion
This chapter provided the finding of the study and the discussion of it. The researcher presented the findings of the three research questions. The table and the data of the result were attached in this chapter. The research also discussed the finding in detail explanation. All tables and results were discussed in this part.
Finding of the Research This research aimed to investigate the students’ interest in their teachers’ personality
at EED of UMY, to examine the students’ academic achievement at EED of UMY, and to
find the correlation between students’ interest in their teachers’ personality and students’
academic achievement at EED of UMY. Moreover, the findings in this part were obtained from the questionnaire and the documents of the students’ academic achievement. The data of
the students’ interest to teachers’ personality were obtained from the questionnaire
distributed. The questionnaire was distributed to 99 students of EED of UMY batch 2013, 2014, and 2015. The data were analyzed using the SPSS (Statistical Package for the Social Science) version 17.0 and Microsoft Excel 2010 for inputting the data. The output of SPSS was used to answer the research question by referring to the table in SPSS. The entire data was used to measure the frequency and significance between two variables.
The result of the frequency of the questionnaire items. The researcher provided the frequency of each valid item of the questionnaire in this part. There are 15 items were
clarified as the valid items with the value obtained more than 0.05. To determine the level of the students’ interest in teachers’ personality, the researcher measured the frequencies of each
level of each item of the questionnaire. Thus, to determine the level, the researcher made the range scale by using the formula from Supranto (2000) as follows:
� =�� − �₁�
Explanation: � = The range prediction
� = The number of class that the research wants
�� = The maximum score of variable
�₁ = The minimum score of variable
Table 7. Level of the items frequencies
Value Category
3.00 – 4.00 High
2.00 – 2.99 Moderate
1.00 – 1.99 Low
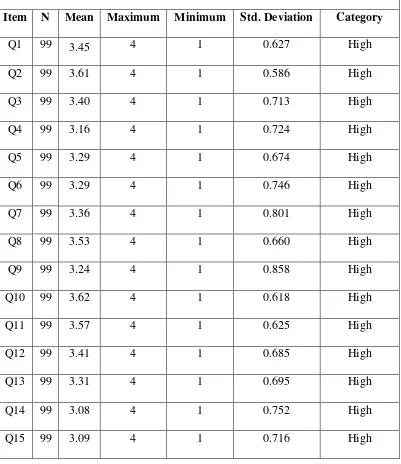
Based on the formula above, the items that gained the mean score 3.00 – 4.00 were identified as high level of students’ interest in teachers’ personality. Besides, the items that
gained the mean score 2.00 –2.99 were clarified as moderate level of students’ interest in teachers’ personality. The items that got the mean score 1.00 – 1.99 were determined as low level of students’ interest in teachers’ personality. The total mean of each items were
Table 8. The total mean score of the questionnaire items
Item N Mean Maximum Minimum Std. Deviation Category
Q1 99 3.45 4 1 0.627 High
Q2 99 3.61 4 1 0.586 High
Q3 99 3.40 4 1 0.713 High
Q4 99 3.16 4 1 0.724 High
Q5 99 3.29 4 1 0.674 High
Q6 99 3.29 4 1 0.746 High
Q7 99 3.36 4 1 0.801 High
Q8 99 3.53 4 1 0.660 High
Q9 99 3.24 4 1 0.858 High
Q10 99 3.62 4 1 0.618 High
Q11 99 3.57 4 1 0.625 High
Q12 99 3.41 4 1 0.685 High
Q13 99 3.31 4 1 0.695 High
Q14 99 3.08 4 1 0.752 High
Q15 99 3.09 4 1 0.716 High
Table 9.1. I tend to pay attention and easy to remember the subject delivered by the kind and warmth hearted lecturer
Frequency Percent Valid Percent
Cumulative
The table above provided the result of the frequency of the questionnaire item 1. Based on the table above, there are 2 respondents (2%) from the 99 respondents who strongly disagreed with the statement on item 1. There is also a respondent (1%) who disagreed with the statement number 1. Besides, there are 46 respondents 46.5% who agreed and 50
respondents 50.5% who strongly agreed with the first statement in the questionnaire. The mean score obtained of the item 1 was 3.45, it can be determined that the questionnaire item 1 got the high level.
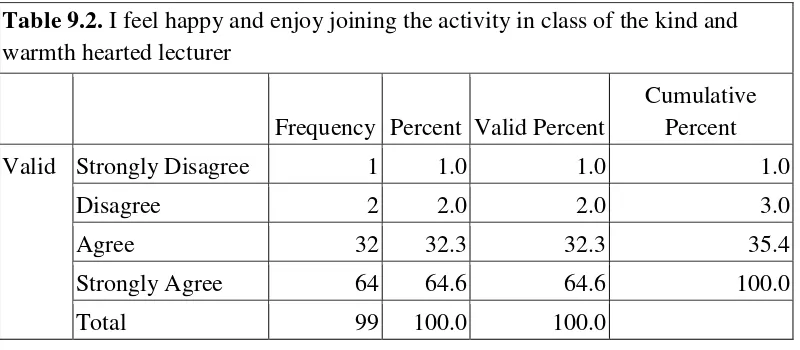
Table 9.2. I feel happy and enjoy joining the activity in class of the kind and warmth hearted lecturer
Frequency Percent Valid Percent
Cumulative
respondents who answered disagree. Moreover, there are 32 respondents (32.3%) who agreed and the 64 respondents (64.6%) who strongly agreed toward the statement 2. The mean score obtained of the item 2 was 3.61, it can be determined that the questionnaire item 2 got the high level.
Table 9.3. I feel proud and satisfied if I can join the class of the kind and warmth hearted lecturer
Frequency Percent Valid Percent
Cumulative
The table above presented the result of the frequency of the questionnaire item 3. From the table, it indicated that the 3 respondents (3%) of the entire respondents were
strongly disagreeing with the statement item number 3. Besides, the 4 respondents (4%) of 99 respondents were disagreeing with the third statement. Moreover, the respondents who chose the scale agree for answering the question number 3 were 42 respondents (42.4%) and 50 respondents (50.5%) who strongly agreed with the statement. The mean score obtained of the item 3 was 3.40, it can be determined that the questionnaire item 3 got the high level.
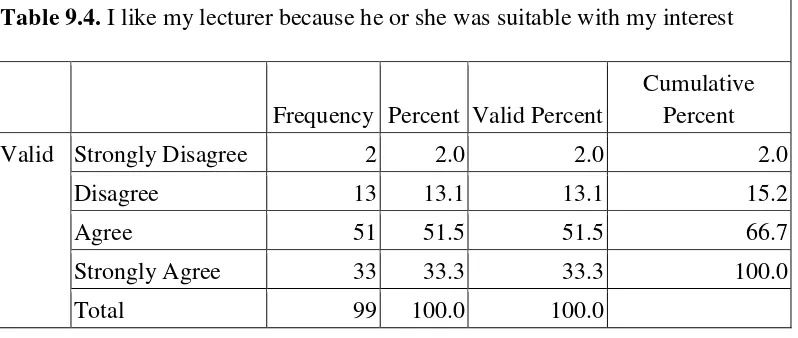
Table 9.4. I like my lecturer because he or she was suitable with my interest
Frequency Percent Valid Percent
The frequency of the questionnaire item number 4 was presented in table above. The table above indicated that from the total respondents, there are 2 respondents (2%) who strongly disagreed with the statement number 4. Moreover, there are also 13 respondents (13.1%) who chose disagree for the questionnaire item number 4. Besides, the 51 respondents (51.5%) were agreeing, and 33 respondents (33.3%) were strongly agreeing with the
statement 4. The mean score obtained of the item 4 was 3.16, it can be determined that the questionnaire item 4 got the high level.
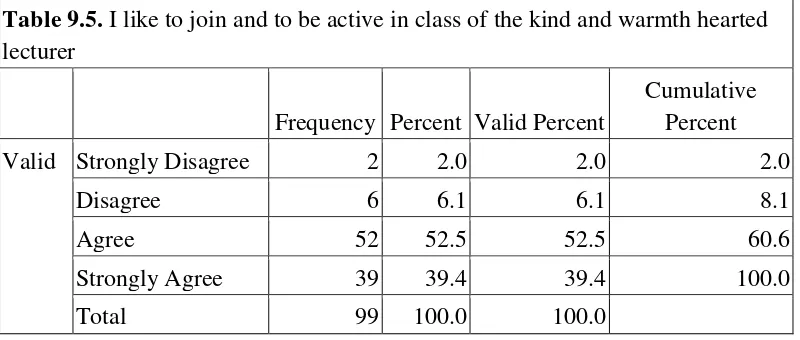
Table 9.5. I like to join and to be active in class of the kind and warmth hearted lecturer
Frequency Percent Valid Percent
Cumulative
Table 9.6. I was motivated to be diligent in the class of the kind and warmth hearted lecturer
Frequency Percent Valid Percent
Cumulative
The table above showed the result of the frequency of the questionnaire item number 6. From the table above, it can be seen that the 4 respondents (4%) from the 99 respondents chose strongly disagree to answer the question 6. Besides, there are 5 respondents (5.1%) who answer disagree. Additionally, there are 48 respondents (48.5%) who agreed and the 42 respondents (42.4%) who strongly agreed. The mean score obtained of the item 6 was 3.29, it can be determined that the questionnaire item 6 got the high level.
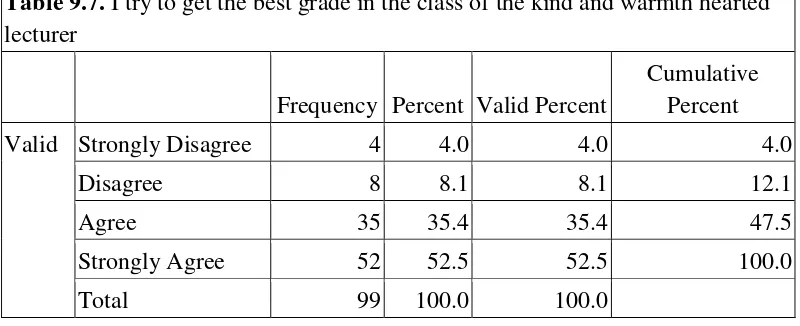
Table 9.7. I try to get the best grade in the class of the kind and warmth hearted lecturer
Frequency Percent Valid Percent
Cumulative
mean score obtained of the item 7 was 3.36, it can be determined that the questionnaire item 7 got the high level.
Table 9.8. I like the emphatic and warmth lecturer, so I was encouraged to get the high achievement in the class
Frequency Percent Valid Percent
Cumulative
The table above showed the result of the frequency of the questionnaire item number 8. From the table above, it indicated that 2 respondents (2%) of the 99 respondents chose strongly disagree for answering the statement number 8. There are also 3 respondents (3%) who disagreed with the statement. Moreover, the 35 respondents (35.4%) chose agree and 59 respondents (59.6%) strongly agreed toward the statement number 8. The mean score
obtained of the item 8 was 3.53, it can be determined that the questionnaire item 8 got the high level.
Table 9.9. I do not like the warmth less lecturer, so I was lazy to join the class
Frequency Percent Valid Percent
The table above provides the result of the frequency of the questionnaire item number 9. Based on the result above, it can be seen that there are 4 respondents (4%) who strongly disagreed toward the statement. There are also 15 respondents (15.2%) who disagreed with the statement. Besides, there are 33 respondents (33.3%) who agree and 47 respondents (47.5%) who strongly agree with the statement number 9. The mean score obtained of the item 9 was 3.24, it can be determined that the questionnaire item 9 got the high level.
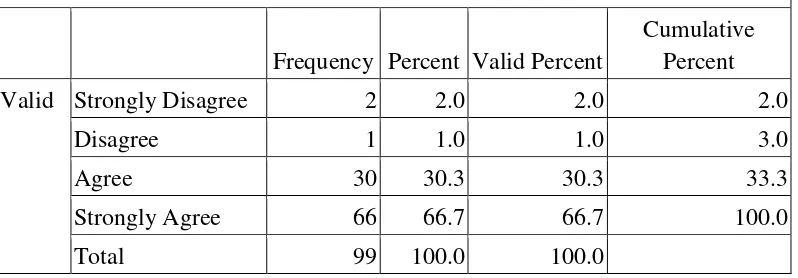
Table 9.10. I like the lecturer who is warmth hearted, humorous, fair, diligent, and conscientious
Frequency Percent Valid Percent
Cumulative Percent
Valid Strongly Disagree 2 2.0 2.0 2.0
Disagree 1 1.0 1.0 3.0
Agree 30 30.3 30.3 33.3
Strongly Agree 66 66.7 66.7 100.0
Total 99 100.0 100.0
Table 9.11. The character of lecturer who is warmth hearted, humorous, fair, diligent, and conscientious makes me respect her/him
Frequency Percent Valid Percent
Cumulative
The result of the frequency of the questionnaire item 11 was presented in the table above. As the result, there are 2 respondents (2%) who strongly disagreed with the statement. Moreover, there is also a respondent (1%) who disagreed with the statement number 11. Likewise, there are 35 respondents (35.4%) who agreed and 61 respondents (61.6%) who strongly agreed toward the item number 11. The mean score obtained of the item 11 was 3.57, it can be determined that the questionnaire item 11 got the high level.
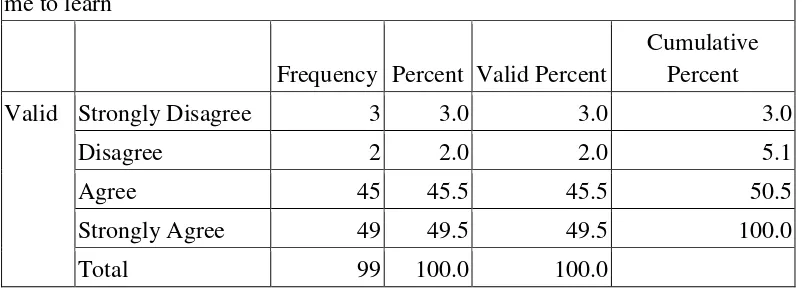
Table 9.12. Having the good relationship with my favorite lecturer, it motivates me to learn
Frequency Percent Valid Percent
Cumulative
respondents (49.5%) strongly agreed with the item number 12. The mean score obtained of the item 12 was 3.41, it can be determined that the questionnaire item 12 got the high level.
Table 9.13. The one of factors that makes me lazy in the learning because I do not have the good relationship with my favorite lecturer
Frequency Percent Valid Percent
Cumulative
The table above shows the result of the frequency of the questionnaire item number 13. As the result, there is a respondent (1%) who strongly disagreed toward the statement. There are also 10 respondents (10.1%) who disagreed with the item number 13. Moreover, the 45 respondents (45.5%) agreed and 43 respondents (43.4%) strongly agree with the statement 13. The mean score obtained of the item 13 was 3.31, it can be determined that the questionnaire item 13 got the high level.
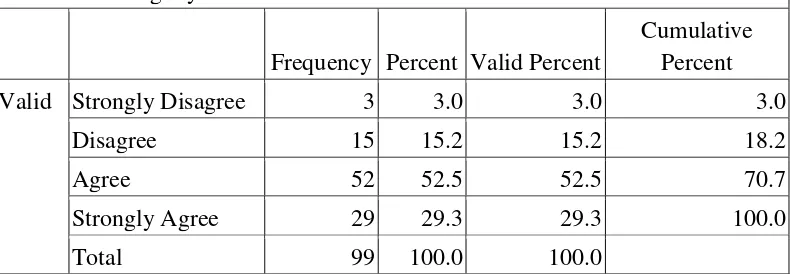
Table 9.14. My closeness with my favorite lecturer can help me in the learning and in increasing my achievement
Frequency Percent Valid Percent
The table above presented the result of the frequency of the questionnaire item number 14. The result indicated that the 3 respondents (3%) out of the 99 respondents chose strongly disagree for answering the statement 14. There are also 15 respondents (15.2%) who disagreed. Besides, there are 52 respondents (52.5%) who agreed and 29 respondents (29.3%) who strongly agreed with the statement number 14. The mean score obtained of the item 14 was 3.08, it can be determined that the questionnaire item 14 got the high level.
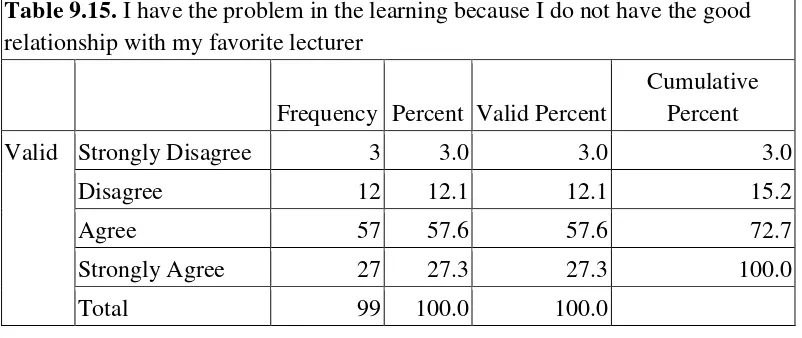
Table 9.15. I have the problem in the learning because I do not have the good relationship with my favorite lecturer
Frequency Percent Valid Percent
Cumulative
The table above showed the frequency of the questionnaire item number 15. The result showed that the 3 (3%) out of the 99 respondents strongly disagreed with the statement. Moreover, there are 12 respondents (12.1%) who disagreed. Additionally, there are 57
respondents (57.6%) who agreed and 27 respondents (27.3%) who strongly agreed toward the statement of item number 15. The mean score obtained of the item 15 was 3.09, it can be determined that the questionnaire item 15 got the high level.
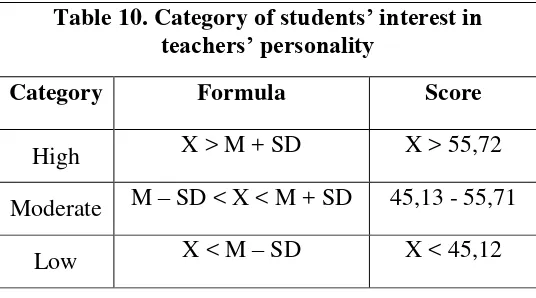
Table 10. Category of students’ interest in
The scores above were obtained from the mean value and standard deviation value from the statistical result of students’ interest in teachers’ personality. In that table, the value
of mean was 50.48 and the value of standard deviation was 5.288. The value of mean and standard deviation were obtained from the table below:
Table 11. Statistics of
Based on the formula above, the researcher divided the respondents into the three level based on their score obtained. The students who got the score more than 55.72 were identified as having high interest in their teachers’ personality. Besides, the students who got
Afterward, the researcher measured the student’s frequencies that belong to the three levels. It resulted that there are 18 students (18.2%) from the 99 students who have high interest in their teachers’ personality. Furthermore, there are 65 students (65.7%) from the 99
students who have moderate interest in their teachers’ personality. Likewise, there are also 16
students (16.2%) who have low interest in their teachers’ personality. Thus, it can be
concluded that the EED students’ interest in their teachers’ personality was moderate with the
percentage 65.7%. This result was provided as the table below:
Table 12. Result of student’s interest in teacher’s personality Category Frequency Valid Percent Cumulative Percent
Valid High 18 18.2 18.2
Moderate 65 65.7 83.8
Low 16 16.2 100.0
Total 99 100.0
The EED students’ academic achievement. In order to know the level of EED
students’ academic achievement, the researcher measured the frequency of the students’
CGPA that belongs to the three levels. These three levels were obtained from the academic guideline book of Universitas Muhammadiyah Yogyakarta. The CGPA score 3.51 - 4.00 was clarified as very good or cumlaude. Besides, the CGPA score 2.76 – 3.50 was certified as good. Moreover, the score 2.00 – 2.75 was determined as satisfying.
After measuring the frequency of students’ academic achievement, the result
indicated that the EED students tended to have very good and good academic achievement. It showed that there are 46 students (46.5%) from the 99 students who have very good
EED students’ academic achievement was good with the percentage 53.5%. The table below provided the result of students’ academic achievement.
Table 13. Result of students’ academic achievement
Frequency Percent Cumulative Percent Valid Very Good 3.51 - 4.00 46 46.5 46.5
Good 2.76 – 3.50 53 53.5 100.0 Satisfying 2.00 – 2.75 0 0
Total 99 100.0
The correlation between EED students’ interest in teachers’ personality and
academic achievement. After measuring the level of students’ interest in teachers’ personality and EED students’ academic achievement, the researcher investigated the
correlation between these two variables. However, before analyzing the data to find the significance, the researcher conducted the normality test.
Normality test. The normality test was used to know whether the data of this study
was normal or not. The normality test was conducted by using SPSS. The researcher referred to the significant value of Kolmogorov-Smirnov. The significant value obtained should be higher than 0.05, so it can be indicated as normal data. As a result, the significant value obtained for the students’ achievement was 0.308, it was higher than 0.05. It can be
concluded that the data variable of this study was normally distributed. Besides, the
significant value of students’ interest was 0.572 (>0.05). It means that the distribution of the
Table 14. Result of Normality test
One-Sample Kolmogorov-Smirnov Test
GPA TotalQ
N 99 99
Normal Parametersa,,b Mean 3.4357 50.42
Std. Deviation .28515 5.288 Most Extreme
Differences
Absolute .097 .079
Positive .063 .075
Negative -.097 -.079
Kolmogorov-Smirnov Z .967 .783
Asymp. Sig. (2-tailed) .308 .572
a. Test distribution is Normal. b. Calculated from data.
Hypothesis testing. For the next step, the researcher examined the significance
between the two variables of this study. The researcher conducted the hypothesis testing to know whether the hypothesis of this study is rejected or accepted. In order to test the hypothesis of the study, the researcher used SPSS version 17.0. The researcher used the
Pearson Product Moment to find the significance. When the significant value obtained was less than 0.05, the Ha accepted. It indicated that there is a correlation between the variables in the study. The researcher also referred to the Pearson correlation value to determine the degree of association as mentioned in the previous table. The table below provided the result of the hypothesis testing.
Table 15. Result of correlational analysis Correlations
GPA TotalQ GPA Pearson Correlation 1 .215*
N 99 99 TotalQ Pearson Correlation .215* 1
Sig. (2-tailed) .033
N 99 99
*. Correlation is significant at the 0.05 level (2-tailed).
The result above showed that the significant value obtained was 0.033. It was less than 0.05 (0.033<0.05), so it can be concluded that Ha was accepted. The Ha stated, “There is
a correlation between student's interest in teacher personality and academic achievement”. Thus, the result showed that there is a correlation between the two variables. Moreover, the Pearson correlation value was 0.215. It means that the degree of association in this study was weak. The positive value obtained indicated that the both variables of this study have the positive correlation. It means if the students’ interest in their teachers’ personality is high, the
students’ academic achievement increases. Otherwise, if the students’ interest in their
teachers’ personality is low, the students’ academic achievement decreases.
Discussion
This part provides the discussion of the research finding. The researcher discusses the finding with relating the result to the theory in the literature review. The researcher gives the additional information related to the findings of this study. This part also presents the
discussion to answer the research questions of this study.
The EED students’ interest to their teachers’ personality. Based on the result of the descriptive analysis, the EED students’ interest in their teachers’ personality was
Moreover, the certain characteristic of the teacher that EED student interested in such as warm-hearted, humorous, fair, diligent, and conscientious. It can be seen from the result that the 66 students or 66.7% of the EED students interested with the teachers who are warm-hearted, humorous, fair, diligent, and conscientious. This finding was in line with Lei (2007) said that the warm-hearted, humorous, fair, diligent, and conscientious of the teachers could make the student respect them and interested in them. Furthermore, there are also 59 students or 59.6% of EED students interested to the teachers who are warm and empathic. Besides, as Cornelius-White’s (2007) finding, the warmth and empathy make the students interested in, and then it can be more strongly associated with the students’ outcome (as cited in Roorda et
al, 2011). Thus, the EED students interested to the teacher who has warm-hearted, humorous, fair, diligent, conscientious, and empathy.
Although the EED students’ interest in teachers’ personality was in the moderate
level, it still needs to be improved. The deep EED students’ interest in their lecturer can lead
them to be more diligent in learning. Moreover, the EED students feel comfortable and joyful either in interacting or in learning with the lecturers who have these characters. They also can be more interested and respect to the lecturers who have these positive characters. As Lei (2007) stated that the positive or good character of the teacher makes the students respect or even like their teacher. If the students feel comfortable, relaxed, happy, and interested in their teacher, it can improve their motivation in learning and gaining the best achievement.
The EED students’ academic achievement.The result of the descriptive analysis
This students’ academic achievement is influenced by many factors. Even though there some factors that influence the students’ academic achievement, but the EED students
still maintain to gain the good academic achievement. One of these factors that affect the EED students’ academic achievement is their interest in teachers’ personality. As Ghazi
(2012) stated, in the teaching process, not only the teachers’ experience and teachers’ professional but also the teachers’ personality that makes the students interested in their teacher, these affect the learning achievement, change, and motivation among student (as cited in Zarabian et al, 2015). Therefore, the students’ interest in teachers’ personality is one of the factors that can determine the students’ academic achievement. Thus, the EED
students’ academic achievement was in the middle level because the EED students’ interest
in teachers’ personality was moderate.
Although the EED students’ academic was in the good level, but there were 46.5% of the EED students who have the CGPA rank 3.00 -2.76. It showed that almost half of the EED students got the CGPA 3.00 -2.76 because their students’ interest in teachers’ personality was moderate. It is because the students’ interest in teachers’ personality has contribution to the students’ achievement. As Kheruniah (2013) said that the good teachers’ personality has
contributed to the students’ success in academic and learning. Thus, the EED students’
interest in teachers’ personality has significance effect on academic achievement.
The correlation between EED students’ interest in teachers’ personality and
academic achievement. The result of this study revealed that there was significance correlation between EED students’ interest in teachers’ personality and academic
relatively weak relation. If the students’ interest in teachers’ personality increases, it will be
followed by slight increase of the students’ academic achievement.
Students who have a deep interest in their teacher can improve their academic achievement. As Foo (1998) clarified, the existence of a deep or high interest in a student toward subject or person such teacher, drives the student to be diligent to gain the high achievement (as cited in bin Che Noh et al, 2013). This theory was in line with the finding of this study that there was the association between EED students’ interest in teachers’
personality and students’ academic achievement. If the students’ interest in their teacher
increases, the students’ academic achievement also increases. In this context, if the EED students’ interest in teachers’ personality was high, the students’ achievement also increased.
However, the result indicated that the EED students’ interest was moderate, so the students’
achievement was in average category which was in the good level. It proved that the students’ interest in teachers’ personality has significant contribution to students’ achievement. This
result is also in line with the study from Lei (2007). This study was conducted at Normal University in the south of Shandong Province, China with the total respondent of 225 English major students. This study found that the 87.1% of the respondents strongly agree that the teachers’ happy mood and dramatic, rich, and kind expression on their characteristic
influence the students’ interest in the teacher and the subject which drives the student to get the best academic achievement.