TRENDS IN
GLOBAL CO
2
EMISSIONS
2014 Report
This publication can be downloaded from: www.pbl.nl/en or edgar.jrc.ec.europa.eu.
Parts of this publication may be reproduced, providing the source is stated, in the form: Olivier JGJ, Janssens-Maenhout G, Muntean M and Peters JAHW (2014), Trends in global CO2 emissions; 2014 Report, The Hague: PBL Netherlands Environmental Assessment Agency; Ispra: European Commission, Joint Research Centre.
This CO2 report 2014 is one in a series of annual publications by PBL-JRC. Ater publishing web reviews in 2007 and 2008, the CO2 report series started in 2009 and provide up-to-date knowledge on the trend of global CO2 emissions. CO2 emission estimates have been made by PBL Netherlands Environmental Assessment Agency and the European Commission’s Joint Research Centre (JRC), on the basis of energy consumption data on 2010 to 2013, as published by British Petroleum, except for coal consumption in China over the 2012–2013 period, for which data were used as published by the International Energy Agency (IEA) and by the National Bureau of Statistics of China. The estimations are also based on production data on cement, lime, ammonia and steel, as well as on emissions per country, from 1970 to 2010, from the Emission Database for Global Atmospheric Research (EDGAR) version 4.2 FT 2010, developed jointly by JRC and PBL. The greenhouse gas emissions of from the EDGAR 4.2 FT2010 data set have also been used for the global emissions overviews in the Fith Assessment Report of IPCC Working Group III on mitigation of climate change, combined with the latest estimates of the IEA on CO2 emissions from fossil fuel combustion. All reports are available from htp://edgar.jrc.ec. europa.eu/whats_new.php?p=3 and htp://www.pbl.nl/en/publications/trend%20global%20co2
PBL Netherlands Environmental Assessment Agency is the national institute for strategic policy analyses in the ields of the environment, nature and spatial planning. We contribute to improving the quality of political and administrative decision-making, by conducting outlook studies, analyses and evaluations in which an integrated approach is considered paramount. Policy relevance is the prime concern in all our studies. We conduct solicited and unsolicited research that is both independent and always scientii-cally sound.
As the Commission’s in-house science service, the Joint Research Centre’s mission is to provide EU policies with independent, evidence-based scientiic and technical support throughout the whole policy cycle. Its work has a direct impact on the lives of citizens by contributing with its research outcomes to a healthy and safe environment, secure energy supplies, sustainable mobility and consumer health and safety. Working in close cooperation with policy Directorates-General, the JRC addresses key societal challenges while stimulating innovation through developing new methods, tools and standards, and sharing its know-how with the Member States, the scientiic community and international partners.
Trends in global CO2 emissions: 2014 Report
© PBL Netherlands Environmental Assessment Agency The Hague, 2014
ISBN: 978-94-91506-87-1 PBL publication number: 1490 JRC Technical Note number: JRC93171
Corresponding author
Authors
Jos G.J. Olivier (PBL), Greet Janssens-Maenhout (IES-JRC), Marilena Muntean (IES-JRC), Jeroen A.H.W. Peters (PBL)
Responsibility
PBL Netherlands Environmental Assessment Agency Institute for Environment and Sustainability (IES) of the European Commission’s Joint Research Centre (JRC)
Editing
PBL and JRC
Graphics
Beeldredactie PBL
Production coordination
PBL Publishers
Layout
Textcetera, The Hague
Acknowledgements
Contents
Summary 4
1 Introduction 6
1.1 Methodology and data sources used 6
2 Results 10
2.1 Slowdown in the increase in global CO2 emissions conirmed and continued 10 2.2 Diferent trends in the six largest emiting countries/regions 13
2.3 Comparison between emissions in the various countries 24 2.4 CO2 emissions from oil and gas production 28
2.5 Gas and oil production by hydraulic fracturing and oil sands exploitation 29 2.6 CO2 from cement and steel production (non-combustion) 31
2.7 Comparison with other global greenhouse gas inventories 34
3 What controls CO2 emissions from energy supply and consumption 36
3.1 Introduction 36
3.2 Trends in global fossil-fuel consumption and fuel mix 37 3.3 Trends in renewable energy sources 39
3.4 Trends in nuclear energy 41
Annex 1: Methodology and data sources over the 2010–2013 period 44
List of abbreviations and deinitions 50
Summary
Global carbon dioxide (CO2) emissions from fossil fuel
combustion and from industrial processes (cement and metal production) increased in 2013 to the new record of 35.3 billion tonnes (Gt) CO2, which is 0.7 Gt higher than
last year’s record. This moderate increase of 2% in 2013 compared to 2012 is a continuation of last year’s trend and of the slowdown in the annual emissions growth. The actual increase of 2012 compared to 2011 was 0.6 Gt or 1.7% (excluding leap year correction) and both are about half the average annual growth rate of 1.1 Gt or 3.8% since 2003 (excluding the 2008–2009 recession years). Note that the average annual emission increase in the 1995–2002 period (ater the large decline in energy consumption in the former Soviet Union countries) was about 1.2% or 0.4 Gt CO2 per year. With the global
economic growth of 3.4% and 3.1%, in 2012 and 2013 respectively, a further decoupling of the global economic and emission trends can be observed. This decoupling is consistent with the increasing service sector share (growing by 1.5% and 1.8% in 2012 and 2013 on average in middle income countries, including China) to the overall gross domestic product, at the expense of more energy-intensive industrial activities.
The global increase in CO2 emissions largely relects the
increase in fossil energy consumption, driven mainly by emerging economies with a steadily increasing energy use over the past decade. Regionally, annual CO2
emission trends show large diferences both in magnitude and underlying causes, complicating the evaluation of the robustness of observed trends. Comparison of the trends in the energy mix and of the resulting emissions in major emiting regions reveals diferent approaches adopted by diferent countries towards a low-carbon economy and society.
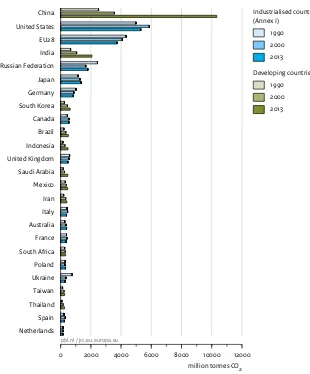
The top 3 emiting regions in 2013, together accounting for more than half (55%) of the total global CO2
emissions, are China (10.3 billion tonnes CO2 or 29%),
the United States (5.3 billion tonnes CO2 or 15%) and the
European Union (EU28) (3.7 billion tonnes CO2 or 11%).
China increased its CO2 emissions by 4.2% in 2013,
compared to 2012, which is much lower than the annual increases of about 10% over the last decade, but higher than the increase of 3.4% in 2012. In 2013, the United
States increased its CO2 emissions for the irst time in
ive years by 2.5%, compared to 2012. The EU28’s CO2
emissions, which started to decrease in 2006, continued to decrease by 1.4% in 2013, and at a larger rate than in 2012. Other OECD countries also mainly show decreases or minor increases below 2%. Russia’s emissions decreased by 0.8%. In contrast, CO2 emissions in
emerging economies mainly increased in 2013, compared to 2012 (e.g. in India by 4.4%, in Brazil by 6.2% and in Indonesia by 2.3%).
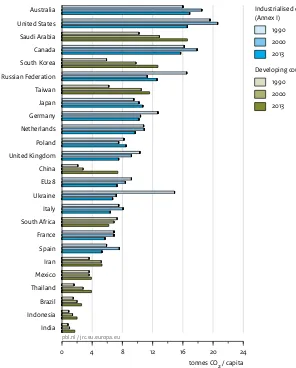
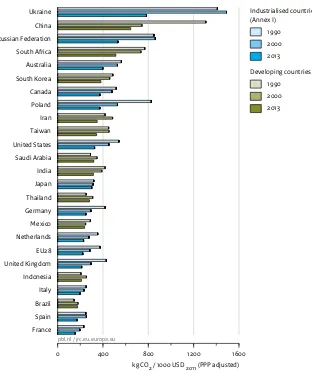
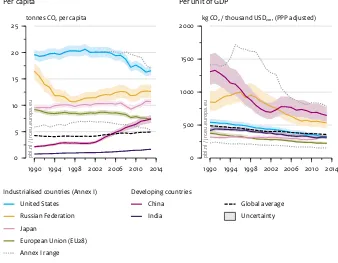
In 2013, the Chinese per capita CO2 level of 7.4 tonnes CO2/
cap exceeded the mean EU28 level of 7.3 tonnes CO2/cap,
but remained still under half the US level of 16.6 tonnes CO2/cap. Evaluating the emited CO2 per Gross Domestic
Product (corrected for purchasing power parity) (PPP)), China is still scoring high with 650 kg CO2/1000 USD of
GDP, which is more than Russia (530 kg CO2/1000 USD),
almost double that of the United States (330 kg CO2/1000
USD), and almost triple that of the EU28 (220 kg CO2/1000
USD). This is due to a relative high energy intensity of the sector contributing to GDP growth in China, even though the intensity continued to decline by 3.1% in 2013, compared to 3.6% in 2012. Although China needs fuel to drive its economic development, it will need a stronger decrease in consumption next year to meet the 12th Five Year Plan target for 2015 of a cumulative 17% reduction in its energy intensity relative to GDP. China started to take measures to achieve a fuel shit, away from coal, by implementing Provincial Environmental Plans with coal consumption targets, an increase in hydropower and structural change. China reported that its CO2 emissions
intensity per unit of GDP declined by 5% in the irst half of 2014, which corresponds with an annual CO2 emission
growth of 2% and suggests that the slowdown in the increase in annual emissions is continuing, if not further decreasing.
In the United States, in 2013 and for the irst time in ive years, per capita CO2 emissions increased, mainly due to a
the Clean Power Plan with targets for the CO2 content per
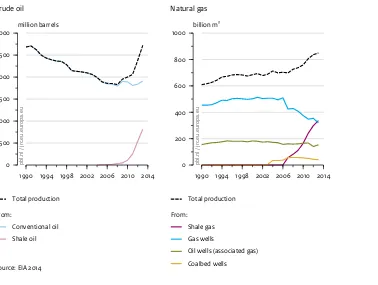
kWh, favouring the highly energy eicient natural gas combined cycle plants over the aged coal-ired power plants. Not only the shale oil production doubled in 2013 compared to 2012 (now representing a share of 30% of the total oil consumption), but also the conventional oil production increased by almost 1%, impacting both oil price and oil consumption. Overall, natural gas production in the United States increased by 2% in 2013 compared to 2012, resulting mainly from the 13% increase in unconventional shale gas production, currently representing a 40% share of the total gross production. Since the United States remains the world’s largest gas producer, increased US gas production inluences the gas market and the global fossil fuel market, in particular leading to lower coal prices.
In particular the European Union, in 2013, saw a continuation of its since 2006 decreasing CO2 emissions
by 1.4%, compared to 2012, even though GDP recovered, with a 0.1% increase in 2013 (compared to 0.3% decline in 2012). Main reasons are the decreases in primary energy consumption from coal (2.7%), oil (2.2%) and gas (1.4%) and the emissions from the sectors under the EU Emissions Trading System, which saw a 3% decline. Investments in renewable energy continued in 2013; the electricity demand in the EU28 was met by 8% supply through wind power, and the installed capacity for solar energy slightly increased to a total of 81.5 GW in 2013. Europe remained in the lead with respect to its cumulative installed photovoltaic capacity, which was 59% of the world’s total in 2013. In October 2014, the EU28 commited to a new climate and energy policy framework with indicative collective targets for 2030 to reach a 40% reduction in greenhouse gas emissions, a 27% energy eiciency increase and a 27% increase in the share of renewable energy by 2030, compared to 1990 levels. Main greenhouse gas reductions are targeted also through a reformed EU Emissions Trading System with a so-called Market Stability Reserve.
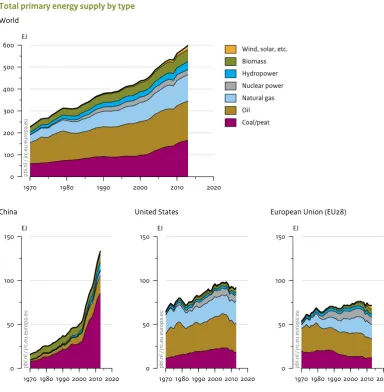
It is uncertain how global economic and technological trends will continue into the future. Since 1970, energy carriers in primary supply increased globally by 35% per decade. The total primary energy in the United States and the European Union up to 2008 grew and was supplied in increasing amount of fossil fuels. Ater 2008, this energy supply decreased, as did the fossil fuel share but not that of renewable energy. China continued to increase its energy use, mostly supplied in fossil fuels, speciically coal (and continues to obtain its increasing energy supply in fossil fuel, mainly coal (+35%) over the past decade alone, four times faster than observed in the United States or the European Union). However, in its primary energy supply, China has a larger amount of renewable
energy (hydropower) than currently in the United States and EU28, even though renewable energy in the EU28 over the past decade, increased by 87%, which requires further technological investments. Further investment in renewable or nuclear energy will be needed for a less carbon-intensive energy supply and a higher energy eiciency is required to substantially mitigate climate change.
Other analyses are needed to show whether countries’ CO2 trends as estimated in this report are consistent with
the total national greenhouse gas emissions and their trends from analyses of the country’s pledges. As such, the UNEP’s Emissions Gap Report 2014 presents the latest estimates of the emissions gap by 2020 between the emission levels consistent with the 2 °C limit, and those expected if country pledges/commitments will be met, and underlines the necessary new global climate agreement for curbing greenhouse gas emissions as soon as possible.
However, future emission trends will be determined by the collective emissions from all countries, partly due to developments that are controlled by government policies and those that are more autonomous, such as economic and technological developments that each have inherent uncertainties. Examples of recent changes in government policies aimed at mitigating greenhouse gas emissions are the EU’s new climate and energy package, China’s actions to control its coal consumption increase, and policy changes in the United States to further increase the country’s gas production (primarily from shale gas wells) to continue a shit from coal to gas. The China–United States ‘carbon deal’ of 12 November 2014 is an example of international negotiations on national emission targets to mitigate climate change. The recent global emissions trend shows national policies collectively do reduce the rate of increase of global CO2 emissions. The big
outstanding question is: when will global CO2 emissions
level-of and start declining in absolute numbers and at what rate?
The CO2 emissions for the 1990–2013 time series for all
countries can be downloaded from the EDGAR website: htp://edgar.jrc.ec.europa.eu/overview.
php?v=CO2ts1990-2013.
For an interactive infographic on global CO2 emission trends, see htp://www.pbl.nl/globalco2 and for a summary of the greenhouse gas emission reduction proposals (pledges) and domestic policies of 19 major countries and regions and the impact on the emissions by 2020 see the interactive Climate Pledge-Act-Review tool: htp://infographics.pbl.nl/
ONE
Introduction
ONE
This report presents the results of a trend assessment of global CO2 emissions up to 2013 and updates last
year’s assessment (Olivier et al., 2013). This assessment focuses on the changes in annual CO2 emissions from
2012 to 2013, and includes not only fossil-fuel combustion on which the BP (2012, 2013, 2014) reports are based, but also incorporates other relevant CO2 emissions
sources including laring of waste gas during gas and oil production, cement clinker production and other limestone uses, feedstock and other non-energy uses of fuels, and several other small sources. The report clariies the CO2 emission sources covered, and describes
the methodology and data sources. For the 2010–2013 period, more details are provided in Annex 1, including a discussion of the degree of uncertainty in national and global CO2 emission estimates.
This assessment excludes CO2 emissions from
deforestation and logging, forest and peat ires, from post-burn decay of remaining above-ground biomass, and from decomposition of organic carbon in drained peat soils. The later mostly afects developing countries. These sources could add as from 10% to 20% of CO2 to
global emissions according to diferent authors (Van der Werf et al., 2009; Harris et al., 2012). However, these percentages are highly uncertain and show a large annual variability. Such variability is also one of the reasons why emissions and sinks from land use, land-use change and the forestry sector (LULUCF) are kept separately in reporting under the UN Climate Convention (UNFCCC) and the Kyoto Protocol. For the same reason, the emissions from the LULUCF sector are not included in this assessment. Information on recent emissions from forest and peat ires and post-burn emissions is being assessed by the Global Carbon Project, which has published a comprehensive assessment of the global carbon budget including all CO2 sources and sinks (GCP, 2014; Le Quéré et
al.,2014).
Chapter 2 presents a summary of recent CO2 emission
trends, per main country or region, including a comparison between emissions per capita and per unit of Gross Domestic Product (GDP), and of the underlying
trend in fossil-fuel production and use, non-fossil energy and other CO2 sources. Speciic atention is given to a
comparison of emission data used in the ith assessment report (AR5) of Working Group III (WG III) of the Inter-governmental Panel on Climate Change (IPCC) (IPCC, 2014a) and in the Global Carbon Project (GCP, 2014) (Section 2.7). This chapter also summarises the main conclusions on trends, mitigation achievements and prospects and the main conclusions of WG III regarding global greenhouse gas emissions (Section 2.1).
Chapter 3 focuses on the energy trends and shits in the energy mix, with a special focus on fossil fuels, renewable energy and nuclear energy. In addition, the extent to which structural changes have caused the observed slowdown in the increase in global CO2 emissions is
discussed. For more information on energy eiciency improvements and carbon capture and storage (CCS) activities, please see last year’s CO2 report (Olivier
et al., 2013).
National CO2 emissions here have been accounted for in
accordance with the oicial IPCC reporting guidelines, approved and used by countries to report their national greenhouse gas emissions to the UN Climate Convention (UNFCCC) and Kyoto Protocol and based on domestic activities that generate greenhouse gas emissions (‘actual’ national emissions) (IPCC, 2006). However, due to the use of other data sources and emission factors, the data reported here will difer somewhat from the emissions oicially reported by the individual countries to the UNFCCC. Nevertheless, data are generally consistent within the related uncertainty estimated for both data sets (see Annex A1.1).
1.1 Methodology and data
sources used
This report assesses the trend in global CO2 emissions
ONE
greenhouse gas emissions up to 2010, also including CO2 from forest ires and other land-use change and
the non-CO2 greenhouse gases such as methane and
nitrous oxide, which contribute about one quarter to the global total CO2 eq greenhouse gas emissions, we refer
to the Fith Assessment report of IPCC Working Group III ‘Mitigating of Climate Change’, for which EDGAR 4.2 provided data.
For global CO2 emissions from 1970 to 2008 we use the
EDGAR 4.2 data set (JRC/PBL, 2011) for greenhouse gases, which result from a joint project of the European Commission’s Joint Research Centre (JRC) and the PBL Netherlands Environmental Assessment Agency, published in November 2011 because it covers all world countries with a detailed sectoral breakdown and consistent time series. This data set provides greenhouse gas emissions per country and on a 0.1 x 0.1 degree grid for all anthropogenic sources identiied by the IPCC (JRC/ PBL, 2011) for the 1970–2008 period. Although the data set distinguishes about 25 source categories, emissions are estimated for well over 100 detailed categories as identiied in the Revised 1996 IPCC guidelines for compilation of emission inventories (IPCC, 1996). The core EDGAR 4.2 dataset was extended to 2010 using a fast-track approach for CO2 from fossil fuel combustion
based on IEA (2012) fossil fuel-use trends for 2009–2010. This dataset is used for the for the greenhouse gas section in the CO2 report of IEA (Olivier and
Janssens-Maenhout, 2014) and combined with the latest estimates of the IEA for CO2 emissions from fossil fuel combustion
for global greenhouse gas emission overviews in the Fith Assessment Report of the IPCC Working Group III on Mitigation of Climate Change (IPCC, 2014a). This extended EDGAR 4.2 FT2010 data set is also used for this CO2 trend
assessment.
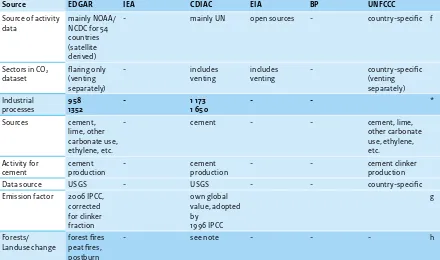
EDGAR 4.2 includes CO2 emission factors for cement
production per tonne cement produced and taking into account the decreasing share of clinker in cement. In addition to cement production, EDGAR 4.2 includes also other industrial non-combustion processes, such as the production of lime and soda ash (2A) and carbon used in metal production (2C). All sources of CO2 related to
non-energy/feedstock uses of fossil fuels were estimated using the Tier 1 methods and data recommended by the 2006 IPCC’s guidelines for national greenhouse gas inventories (IPCC, 2006). Collectively, the other carbonate sources added about 30% to global cement production CO2 emissions in 2008, which are not estimated in most
other CO2 datasets (see Table 2.3 in Section 2.7). More
information on the data sources and methodologies used can be found in Olivier and Maenhout (2014), which is part III of IEA (2014a).
Although not used in this study, the EDGAR 4.2 data set also includes annual CO2 emissions from forest ires and
peat ires as well as ires in other wooded land, grassland and savannahs estimated by Van der Werf et al. (2006). Also not used here, but included in the EDGAR 4.2 data set are the signiicant, albeit highly uncertain, CO2
emissions from the decay of organic materials of plants and trees, which remain ater forest burning and logging, and from drained peat soils (JRC/PBL, 2011), while net carbon stock changes (resulting in CO2 emissions or
carbon storage) for forests, based on data from the FAO’s Forest Resources Assessment (FAO, 2010) are included in the EDGAR 4.2 data set for completeness.
For each country, the trend from 2008 onwards has been estimated by either using the trend in the appropriate activity data or by approximating this trend using related statistics as the estimator. For the fuel combustion emissions (1A) that account for about 90% of total global CO2 emissions, excluding forest ires, 2008 emissions
Box 1.1 Changes compared to the 2013 CO
2report
For the sake of comparison and readability, this 2014 report follows the structure of last year’s 2013 report. Please note that apart from the numerical changes for the last year reported, the main textual changes can be found in the following sections:
– 2.1 (Slowdown in the increase in global CO2 emissions);
– 2.2 (Trends in seven largest emiting countries/regions); – 2.7 (Comparison with other global CO2 emissions inventories).
In addition:
– 2.5 (on hydraulic fracturing of shale oil and gas) has a short new paragraph on the latest developments; – 3.2 (on trends in fossil fuel consumption and fuel mix) shows the trend and mix of the total primary energy
supply (TPES) for China, United States, European Union (EU28) and the world as a whole. This study provides CO2 time series 1990–2013 per country, which are also available on
ONE
were divided per country into four main fuel types for use as trend indicators. These fuel types are coal and coal products, oil products, natural gas, and other fuels (e.g., fossil-carbon containing waste oils). For each sector, the 2008–2011 trend was based on IEA CO2 data (for
2008–2010: IEA, 2012a; for 2010–2011: IEA, 2013b), and the 2011–2013 trend was based on BP data released in June 2014 (BP, 2014), except for coal consumption in China in 2012 and 2013, for which data from the IEA (2014b) was used showing a 2.4% increase in coal consumption in 2012, and the National Bureau of Statistics of China (NBS, 2014b) which reported a 3.7% (actual) increase in 2013 over 2012. A similar approach was used for the other source sectors.
To estimate the trend for the 2011–2013 period, all CO2
emissions have been aggregated into ive main source sectors (corresponding IPCC category codes in brackets): (1) fossil-fuel combustion (1A), including international
‘bunkers’, (marine and aviation), (2) fugitive emissions from fuels (1B),
(3) cement production and other carbonate uses (2A), (4) feedstock and other non-energy uses of fossil fuels
(2B+2C+2G+3+4D4),
(5) waste incineration and fuel ires (6C+7A).
More details on the methodology and data sources are presented in Annex 1. Data quality and uncertainty in the data are also discussed in this Annex. The uncertainty in CO2 emissions from fossil-fuel combustion using
inter-national statistics is discussed in detail by Marland et al. (1999) and Andres et al. (2012) and general uncertainty characteristics in global and national emission inventories in Olivier and Peters (2002). Diferences with the previous CO2 report of 2013 by Olivier et al. (2013) are given in
T
WO
Results
TWO
2.1 Slowdown in the increase in
global CO
2emissions conirmed
and continued
Global CO2 emissions reached a new high of 35.3 billion
tonnes (Gt) CO2 (Figure 2.1) in 2013, which is an increase
of 0.7 Gt or 2.0% compared to the previous year. This moderate increase is similar to the actual increase in 2012 of 0.6 Gt or 1.7% (excluding leap year correction). Ater an average annual increase of CO2 emissions of 1.1 Gt or
3.8% per year since 2003 – when excluding the efect of the credit crunch recession years 2008 and 2009 – the annual increases in 2012 and 2013 in global CO2 emissions
are about half of the increases in the preceding decade, albeit higher than the average annual increase in the 1995–2002 period. The average annual increase over the 1995–2002 period (ater recession in the former Soviet Union countries) was about 1.2% or 0.4 Gt CO2
per year. The increase in emissions over the 2012–2013 period is much smaller than expected, given that in 2012 and 2013 the global economy grew by 3.4% and 3.1%, respectively, which is slightly less than the average annual 3.9% growth rate of GDP since 2003 (again excluding the 2008–2009 years) (IMF, 2014). Within the total increase in global emissions in 2013, there are remarkable diferences between countries.
Global coal consumption (responsible for about 40% in total CO2 emissions) grew by 2.7% in 2013, well below the
decadal average of 4%. China contributed two-thirds to the net growth and India and the United States both about one-ith. We note that in BP’s release of last year the increase in China’s coal consumption in 2012 was estimated to be 6.4%, while the Chinese NBS reported this to be 2.5%. BP (2014) revised this coal consumption estimate with a 5.4% increase in 2012 compared to 2011. The BP (2014) and NBS (2013) estimates for coal
consumption growth in 2012 have been replaced with the 2.4% increase that was oicially reported in detail by the International Energy Agency (IEA, 2014b) for 2012. For
2013, the (actual) coal consumption increase in China in 2013 was 3.7%, in both the BP report (2014) and that of the National Statistics Bureau of China (NBS, 2014b), which was applied in the 2012 estimate (based on IEA, 2014b). The global consumption of oil products increased by 1.1% in 2013, somewhat below the historical trend of 1.3% annually, with China contributing more than one third and the United States and Brazil about 30% and 15%, respectively. Consumption of natural gas increased globally by 1.1% in 2013, much lower than the historical trend of 4.3%, annually, with China and the United States contributing both about 40% and Brazil about 15% to the net growth (BP, 2014).
The six largest emiting countries/regions (with their share in 2013 between brackets) were: China (29%), the United States (15%), the European Union (EU28) (11%), India (6%), the Russian Federation (5%) and Japan (4%) (Figure 2.2). Remarkable trends were seen in the top 3 emiting countries/regions, which account for 55% of total global CO2 emissions. In China emissions increased
by 4.2%, while in the United States emissions saw a rebound of 2.5% in 2013 ater a decrease of 3.8% in 2012. The European Union as a whole also saw a decrease of 1.4% in 2013 compared to 2012. In the atermath of the Fukushima nuclear accident, Japan’s CO2 emissions that
showed a 6.5% increase in 2012, saw a small 0.6% decrease in 2013. Within the European Union, increases were seen in, for example, France and Germany, whereas emissions decreased in Spain (10.8%), Italy (5.5%) and the United Kingdom (2.6%). The increase in China was equivalent to about 60% of the net global CO2 increase in
2013; for the United States and India this was roughly 15%, whereas the European Union experienced a decrease of 10% in 2013 expressed as a fraction of the net global emission increase in 2013.
China’s CO2 emission increase of 4.2% in 2013 was about
T
WO
fuel demand from the basic materials industry, possibly due to the slowdown in economic growth when the
stimulus package was terminated and the production of hydropower rebounded, aided by an increase in the use of renewable energy and by energy eiciency improve-ments (IEA, 2014d). The somewhat higher annual increase compared to 2012 was due to an uptake of production increase by the heavy industry compared to 2012.
In the United States, CO2 emissions increased by 2.5% in
2013 following a 3.8% decrease in 2012 (BP, 2014). Main drivers of the increase were a shit from natural gas to coal in power generation that caused a 4.4% increase in coal consumption, together with an increase of 2.2% in total natural gas consumption, in particular in the building sector. The fuel shit in the power sector was caused by relatively higher gas prices compared with coal prices. The increase in natural gas use in 2013 was due to a much larger demand for space heating than in 2012, which was a year that saw a very mild winter (EIA, 2013c).
The European Union’s CO2 emission reduction of 1.4% in
2013 was 1.1% lower than the historical trend, and this was partly due to continued weak economic conditions ater 2009, with a 0.3% decrease in total GDP in 2012 (in PPP units; IMF, 2014) followed by an increase of 0.1% in 2013 (Eurostat, 2014d). The companies covered by the EU
Emissions Trading System (EU ETS), covering more than 40% of the EU’s CO2 emissions, together reported a 3%
decrease in CO2 emissions for 2013 compared to 2012
(EC, 2014b). In 2013, the European Union saw decreases of 2.2%, 1.4% and 2.7% for primary energy consumption of oil, gas and coal, respectively (BP, 2014). These drops were mainly due to a 0.5% decline in average industrial production and a 1.2% reduction in electricity production,
combined with an increased use of renewable energy with a share of 11.5% in primary energy consumption in 2013, compared to 10.3% in 2012 (Eurogas, 2014; Eurostat, 2014c).
The moderate 1.7% and 2.0% increases in global CO2
emissions in 2012 and 2013 seem remarkable in times when global economic growth of 3.1% (2013) was about two-thirds of the average growth levels of the last decade. Within this percentage, however, there are notable diferences in the performance of various groups of countries. Economic growth in the 24 irst OECD countries1, with 1.1% in 2013, was lower than half the
average over the 2003–2007 period (2.5%), while the 2% economic growth in the group of 14 ‘Economies In Transition’ or EIT2 countries in 2013 was not even one third
of the level of the 2003–2007 trend (7.1%). The developing (‘Non-Annex I’) countries3 with emerging economies
showed a growth rate of 4.7% in 2013 which is about two-thirds of the average growth over the 2003–2007 period (7.4%) (IMF, 2014; World Bank, 2014). However, note that the not energy-intensive service sector currently contributes about 70% to global GDP (for the various countries it ranges between from 20% to 87%), and, thus, increases in total energy consumption are not always closely related to overall economic growth, since overall energy consumption is dominated by more energy-intensive sectors such as manufacturing industries that have only a small share in total GDP (World Bank, 2014).
It is obvious that energy-intensive activities are of the highest relevance for the CO2 emissions trend and that
fossil-fuel combustion accounts for 90% of total CO2
emissions (excluding deforestation and other land uses). Power generation remains the most important sector in
Figure 2.1
1990 1994 1998 2002 2006 2010 2014
0 10 20 30 40
1000 million tonnes CO
2
Source: EDGAR 4.2FT2010 (JRC/PBL 2012); BP 2014; NBS China 2014; USGS 2014; WSA 2014; NOAA 2012
pb
l.
n
l /
jrc
.e
u
.e
u
ro
p
a
.e
u
International transport
Developing countries
Other developing countries
Other large developing countries
China
Industrialised countries (Annex I)
Other Economies In Transition (EIT)
Russian Federation
Other OECD1990 countries
Japan
European Union (EU28)
United States
T
WO
relation to fossil-fuel consumption; therefore, the choice of fossil fuel by the power sector is of the utmost importance. More details on recent energy trends are presented in Chapter 3 and, on sector-speciic shares in CO2 emissions, in Table 3.1. In contrast to the power
industry for which a relatively large variety of fuels can be selected (from fossil fuel to nuclear fuel and renewable energy sources), other energy-intensive sectors, such as manufacturing and construction, are less lexible in the short term.
CO2 emissions from cement clinker production (the
largest source of non-combustion-related CO2 emissions,
contributing about 4.8% to the global total or about 10% when including combustion-related emissions for heating the kilns) increased globally by 7.4% in 2013 ater a 4.8% increase in 2012, mainly due to a 9.3% increase in the production in China, which accounted for more than half of total global production. The 2013 trend in CO2
emissions from gas laring, contributing about 1% to global total emissions, is not yet known, due to the absence of data updates from the NOAA satellite observation systems following changes in sensors.
Last year’s report (Olivier et al., 2013) suggested that the small increase in emissions in 2012 of 1.7% (1.4% when including a leap year correction) could be a irst sign of a slowdown in the increase in global CO2 emissions. The
2013 growth rate of 2.0% is a continuation of the slower annual emission growth rate. Moreover, energy consumption data on China in the irst half of 2014 also shows a continuation of this ‘stagnation’ in annual growth. Of course, further mitigation of fossil fuel use will
be needed not only to curb the increasing emissions trend over time but also to have an absolute decrease in the global greenhouse gas emissions trend, which the Working Group III report on Mitigation and the Synthesis Report of the Fith Assessment of IPCC (AR5) (IPCC, 2014a,b) concluded as necessary to substantially mitigate anthropogenic climate change within this century. Technically, these reductions are still feasible according to IPCC WG III (IPCC, 2014b; UNEP, 2014), but need to be widely implemented soon, if governments wish future global greenhouse gas emission levels to be compatible with pathways that could limit global warming in this century to 2 oC (see Box 2.1).
This report assesses the trend in global CO2 emissions,
mainly from fossil fuel use. For a comprehensive assessment of the trends in all greenhouse gas emissions up to 2010, also including CO2 from forest ires and other
land-use change and the non-CO2 greenhouse gases such
as methane and nitrous oxide, which contribute about one quarter to the global total CO2 eq greenhouse gas
emissions, we refer to the Fith Assessment report of IPCC Working Group III ‘Mitigating of Climate Change’ (IPCC, 2014a). For an analysis of the more recent trends in all greenhouse gas emissions of all major countries, including CO2 emissions from forest ires and other
land-use change and non-CO2 greenhouse gases, the pledges
by the countries to mitigate national emissions by 2020 and an assessment of the resulting national emissions trend by 2020, we refer to Den Elzen et al. (2013). Further analysis may also show whether the recent national CO2
trends as estimated in this report it into the total national greenhouse gas emissions trends expected from
Box 2.1 Main conclusions on anthropogenic global greenhouse gas emissions from IPCC’s Fith
Assessment Report (AR5) (IPCC, 2014a,b)
– The efects of anthropogenic greenhouse gas emissions have been detected throughout the climate system and are extremely likely to have been the dominant cause of the observed warming since the mid-20th century.
– Cumulative emissions of carbon dioxide largely determine global mean surface warming by the late 21st century and beyond.
– It would be possible, using a wide array of technological measures and changes in behaviour, to limit the increase in global mean temperature to 2 °C above pre-industrial levels.
– Substantial emissions reductions over the next few decades can reduce climate risks in the 21st century and beyond.
– Without additional mitigation eforts beyond those in place today, and even with adaptation, warming by the end of the 21st century will lead to high and very high risk of severe, widespread, and irreversible impacts, globally.
– There are multiple mitigation pathways that are likely to limit the increase in global mean temperature to 2 °C above pre-industrial levels. These pathways would require substantial emissions reductions over the next few decades and near zero emissions of CO2.
T
WO
analyses of country pledges (see e.g. Den Elzen et al., 2013, 2104; UNEP, 2104).
In line with the Fith IPCC Assessment Report (AR5) (IPCC, 2014a,b), we recognise that more knowledge and data (in particular the IPCC AR5 database, but also within the
Global Carbon Project (Le Quéré et al., 2014) are now available on the sources of these emissions. In contrast to the previous IPCC assessment report published seven years ago, presently emerging economies and developing countries in general now have a share of more than 50% in current global greenhouse gas emissions and in their annual increase.
However, future emission trends will be determined by the collective emissions from all countries, partly due to developments that are controlled by government policies and more autonomous developments, such as economic and technological developments which have individually inherent uncertainties. Examples of the last category are: – the dependence of the use of new technologies on
the energy price: the oil price, recently (November 2014) dropping to well below USD 80 per barrel, afects the economic feasibility of new energy sources, such as shale oil production and production of shale gas, which may afect natural gas prices worldwide;
– increased transport and storage capacity of LNG may expand intercontinental trade in LNG and thus inluence continental natural gas markets;
– overcapacity and lexibility in power generation may cause rapid changes in the fuel mix used by utilities in case of changes in the relative prices of gas and coal.
Examples of recent changes in government policies aimed at mitigating greenhouse gas emissions are China that starts to control its coal consumption increase with levies since October 2014 (Reuters, 2014) and the United States that further increases its gas production (primarily in an unconventional way) to continue a shit from coal to gas. On 12 November 2014, China and the United States made a joint announcement on climate change and clean energy cooperation, which is referred to as the so-called ‘China-US carbon deal’. (White House, 2014a, 2014b; Podesta and Holdren, 2014). First analysis of the targets and actions announced led to various reactions regarding the question of how big this deal actually is (e.g. Ladislaw et al., 2014; Levi, 2014; Olesen, 2014; Rom, 2014; Victor, 2014; Wong, 2014) and whether it may result in a breakthrough at the international negotiations on national emissions targets to mitigate climate change in Paris next year. The European Union recently also commited to a new climate and energy package with collective commitments on energy eiciency, renewable energy and greenhouse gas reductions by 2030, partially
through a reformed EU Emissions Trading System with a so-called Market Stability Reserve (EC, 2014b). These examples show both the potential and the uncertainty in reducing the rate of increase and curbing global CO2
emissions in the near future. The recent global emissions trend shows national policies collectively do reduce the rate of increase in global CO2 emissions. The big question
is that of when and how fast global CO2 emissions will
level of and start decreasing in absolute numbers.
We note that all national emissions inventories are subject to uncertainty. Uncertainties in national CO2
emissions vary between countries; in this report ranging from 5% to 10% (95% conidence interval), with the largest uncertainties concerning the data on countries with fast changing or emerging economies, such as Russian Federation data on the early 1990s and data on China since the late 1990s, and the most recent statistics, based on Marland et al. (1999), Tu (2011), Andres et al. (2012) and Guan et al. (2012). Moreover, newly published statistics are oten subject to subsequent revisions. Therefore, for China and the Russian Federation, we assumed 10% uncertainty, whereas for the European Union, the United States, Japan and India, a 5% uncertainty was assumed. Our preliminary estimate for total global CO2 emissions in 2013 is believed to have an
uncertainty of about 5% and the increase of 2.0% may be accurate to within 0.5%. For more details, see Section A1.4 of Annex 1.
2.2 Diferent trends in the six largest
emiting countries/regions
This section analyses the emissions and changes from the six largest emiting countries/regions in descending order of importance. The largest CO2 emiting country by far is
China, which share of 29% in 2013 was much larger than the second-largest, the United States, with 16% and the European Union with 11% (Figure 2.2).
T
WO
In 2013, the growth in the world economy was around 3.1%, about four-iths of that in the last 10 years, apart from the global credit crunch years of 2008 and 2009, but with large diferences between the largest countries/ regions. The economy of the United States grew in 2013 by 1.9%, which is similar to their average historical growth rates, whereas the EU economy increased by 0.1% in 2013 versus the annual average of 1.3%. China’s annual economic growth in 2013 of 7.6%, and 7.5% in 2012, was only about three-quarters of the ten year annual average, so far the lowest since 2000. In contrast, the economic growth of the Russian Federation of 1.3% in 2013 was only one quarter of the last decade average. The economic growth rates in 2013 of India (5.0%) and Brazil (2.5%) are two-thirds of their annual average over the last 10 years (World Bank, 2014).
Please note that these GDP statistics do not yet relect the revisions of the deinition of the Gross National Product (GDP) as adopted the updated international guidelines for national economic account in the 2008 UN System of National Accounts (‘SNA 2008’) (UN, 2009). For example the World Bank data used for the EU28
countries, the United States and China do not yet include these revisions, but these countries have in 2014 published their irst revisions (United States and European Union) or their plans to do so (IMF, 2014).
For most industrialised countries, the past decade has been characterised mainly by the 2008–2009 recession, which has since been slowly recovering. In 2013, most OECD countries outside Europe, such as the United States, Canada and Australia, saw their historical economic growth rates continued. Japan showed a GDP growth of 1.5%, almost one percent higher than its
historical average growth rate of 0.8%.whereas in several western EU countries, economic growth was very small (e.g. Germany, France) or even negative (Italy, Spain and the Netherlands).
2.2.1 China
In 2013, China’s CO2 emissions increased by 4.2% (‘actual’)
to 10.3 billion tonnes. Together with the 3.4% increase in 2012 these are the slowest rates of increase in a decade compared with the annual average increase of 10.1% of the ten preceding years. The increase in 2013 was mainly caused by a relatively small increase of 3.7% in domestic coal consumption, as reported by BP (2014) and NBS (2014b), whereas in the preceding decade, the annual growth rate was mostly around 10%. Coal consumption was responsible for three-quarters of China’s CO2
emissions from fossil-fuel combustion. In contrast, the increase in natural gas consumption was 10.5% in 2013, following annual increases of about 18% on average. The increases of about 3 and 4% were the lowest since 2001, the year ater which the increase in Chinese emissions on average accelerated from about 3% to 10%, annually. Even in the two recent credit crunch recession years, China’s CO2 emissions continued to increase by about 6%
per year.
This relatively small emissions increase in 2013 was consistent with the relatively small increase of 7% in thermal power generation (predominantly coal-ired power plants), reported by the National Bureau of Statistics of China (NBS, 2014b). The ‘small’ increase in the kWh’s generated by coal-ired power plants, which produce about three-quarters of total electricity, was due to the still relatively ‘small’ growth rate of total electricity consumption of 7.5% in 2013, compared to the decade
Figure 2.2
1990 1994 1998 2002 2006 2010 2014
0 2 4 6 8 10 12
1000 million tonnes CO
2
Source: EDGAR 4.2FT2010 (JRC/PBL 2012); BP 2014; NBS 2014; USGS 2014; WSA 2014; NOAA 2012
pb
l.
n
l /
jrc
.e
u
.e
u
ro
p
a
.e
u
Industrialised countries (Annex I)
United States
European Union (EU28)
Russian Federation
Japan
Developing countries
China
India
Uncertainty
T
WO
before, which showed double digit growth igures, and was the lowest since 1998 (2008) (Table 2.1). The surge in electricity demand was driven by an uptick of industrial demand that consumes 70% of all electricity produced, as indicated by crude steel, chemicals, cement and
automobile production. In addition to increasing output, also the electriication (share of electricity in total energy demand) of the industry is steadily increasing over time (Table 2.1 and Davidson, 2014).
In addition, hydropower generation increased by 4.5% following an expansion of installed capacity of 12.5% by the end of 2013. Coal-ired power had a three-quarter share in the increase in electricity production in 2013, whereas the increase in hydropower represented one-eighth of the electricity production increase. Wind power, with a production increase of about 37%, had a 10% share in the expansion, and nuclear power contributed by about 5% due to an increase in production of 13.6% (BP, 2014; REN21, 2014). The increase in wind power has beneited from improved grid interconnection and, possibly, from reduced curtailment (Davidson, 2014).
Ater years of double digit increases in GDP, China’s increase in 2012 and 2013 was only 7.7% [7.5%] and 7.7% [7.6%], respectively (NBS, 2014c; World Bank, 2014). Unlike in developed countries, China’s manufacturing industry is the sector with the largest consumption of electricity and fuels. Therefore, the demand for energy in general is largely driven by trends in basic materials production (Houser, 2013).
Restrictions on investments in construction activities (buildings, power plants, infrastructure), and the termination of economic stimulus package to reverse the
impact of the global recession years 2008 and 2009, resulted in a substantial slowdown in the growth rate of the demand for materials, halving the growth in this sector. Thus, not only the growth of the Chinese economy but also of other key energy trend indicators, such as production of cement, steel and electricity, decreased signiicantly in 2012 and 2013, compared to the high annual growth rates over the 2002–2011 period. The growth rate in cement, steel and electricity production was almost half of that observed in most previous years (except for 2007–20084) (see Table 2.1). Nevertheless,
China’s 2012 and 2013 GDP growth of about 7.5% was only about 3% lower than the decadal average of around 10%.
So, the slowdown of the growth of CO2 emissions in China
as observed in 2012 has continued in 2013. Still, again the question can be asked whether this is accidental or a more structural change in the trend in China’s CO2
emissions, in line with its own target for a maximum level of energy consumption by 2015 and its shit to gas with a natural gas share of 10% by 2020.
The irst reports on the development in the irst half year of 2014 suggest that the slowdown of the increase continues in 2014 as well. The Ministry of Environmental Protection (2014) reported that the CO2 emissions
intensity per unit of GDP declined by 5% and the energy intensity decreased by 4.2% year on year (Xinhua, 2014, Sep 10). This decline in CO2 intensity corresponds with an
annualised growth of 2% in CO2 emissions, suggesting
that the slowed growth continues, if not further decreases. This is corroborated by (a) Provincial Environmental Plans with coal consumption targets (Shuo and Myllyvirta, 2014), (b) hydropower increased in
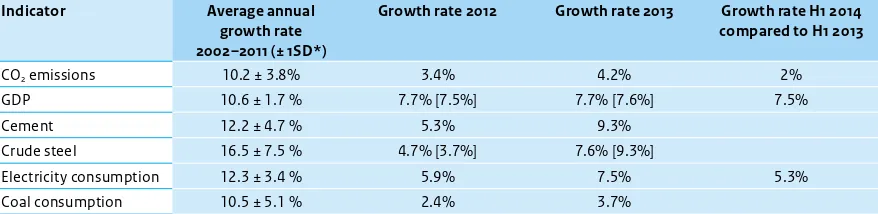
Table 2.1
Growth rates in 2012 and 2013 in selected energy trend indicators in China, compared to average growth rates since 2002
Indicator Average annual
growth rate 2002–2011 (± 1SD*)
Growth rate 2012 Growth rate 2013 Growth rate H1 2014
compared to H1 2013
CO2 emissions 10.2 ± 3.8% 3.4% 4.2% 2%
GDP 10.6 ± 1.7 % 7.7% [7.5%] 7.7% [7.6%] 7.5%
Cement 12.2 ± 4.7 % 5.3% 9.3%
Crude steel 16.5 ± 7.5 % 4.7% [3.7%] 7.6% [9.3%]
Electricity consumption 12.3 ± 3.4 % 5.9% 7.5% 5.3%
Coal consumption 10.5 ± 5.1 % 2.4% 3.7%
* Standard Deviation Sources:
2002–2011, 2012: GDP (constant prices) (World Bank, 2014), cement and crude steel (USGS, 2014), electricity (IEA, 2014b; BP, 2014); 2012 and 2013: NBS (2013, 2014b); between brackets: World Bank (2014) and WSA (2014);
H1 2014 (irst half year): GDP (NBS, 2014c), CO2 emissions (Ministry of Environmental Protection China, 2014, 28 Aug; Xinhua, 2014, 10 Sep),
T
WO
the irst half of 2014 and much more capacity expansion is planned (Kuo, 2014; Bloomberg, 2014), and (c) structural change of the economy towards less energy-intensive activities (Guay, 2014).
In September 2013, the State Council released an ‘Airborne Pollution Prevention and Control Action Plan’ (Ministry of Environmental Protection China, 2013), in response to the sufering of major Chinese cities of long episodes with high levels of air pollution. The plan contains ten measures to improve air quality by 2017 in the country at large and in speciic provinces (Beijing, Tianjin, Hebei) and regions (Yangtze and Pearl river deltas), aimed at speciic reductions of the concentration of particulate mater in these areas. These areas will target at a reduction of total coal consumption by 2017 compared to 2012. By 2017, the share of coal in national total energy consumption should be below 65%, down from 68% in 2012 (IEA, 2014b). So apart from caps on provincial coal consumption, 10 of the 31 provinces which account for 38% of total coal consumption in 2012 are targeting at reducing their coal consumption in four years time (Beijing, Tianjin, Hebei, Shandong, Shaanxi, Chongqing, Shanghai, Jiangsu, Zhejiang and Guangdong). Two more (Liaoning and Jilin), accounting for 7% of total coal consumption, aim at reducing growth of coal consumption to below 2% per year (Shuo and Myllyvirta, 2014). Together these 12 provinces – in 2012 accounting for 45% of the national total (NBS, 2014a) – aim at reducing their consumption by 7% or more. In absolute values, this is comparable to the annual CO2 equivalent
greenhouse gas emissions of a country such as the Netherlands. Seventeen more provinces have announced their intention to cap or reduce their coal consumption. Together these 29 provinces cover most of the China’s coal consumption.
In 2012 in 10 provinces, accounting for one quarter of total coal use, coal consumption decreased from 2011 to 2012 on average by 5.8%, contributing to the slowdown in 2012 of the annual growth of total national coal consumption to 2.4% per year. Moreover, from 15 October 2014 onwards China levies import tarifs (3%–6%) on coal import. This will reduce the coal import from Australia and Russia, but not from Indonesia (because of free trade agreement) (Reuters, 2014). The discussion in the media has been intensiied that China nears ‘peak coal consumption’ as a result of new clean air policies combined with policies to improvement energy eiciency and to restructure the economy. These analysis vary in their estimates of the time span when that could be happening, anywhere from around 2030 to even before 2020. Citi (2013) explored the consequences and
Greenpeace East Asia published April 2014 a short brieing summarising the essentials of the recent change in coal
consumption trends in China (Shuo and Myllyvirta, 2014). Many others followed suit, e.g. CarbonTracker (2014), King (2014), Nicola (2014), Pearce (2014), Reuters (2014), Trembath (2014), Tweed (2014) and Vorrath (2014).
Myllyvirta (2014) suggests even that coal consumption may have dropped in the irst half of 2014, based on coal production data for that period that dropped by 1.8% and the growth of imports virtually stopped ater ive years of rapid growth. However, there is considerable uncertainty over the changes in coal stockpiles that could have enabled consumption to grow while production and imports declined.
According to Guay (2014) there is a change from energy-intensive fossil fuel industries such as production of cement, steel and glass and coal-ired power plants to services and other non-energy-intensive economic activities. In fact, the growth in services (excluding real estate) and private consumption has recently outpaced the manufacturing industry.
To meet the carbon intensity target in the 12th Five Year Plan of 17% reduction per unit of GDP in 2015 relative to 2010, China’s carbon intensity needs to continue decreasing at a slightly higher rate (4.6%) for the next three years (Houser, 2013). For 2012, the China Greentech Initiative (2013) concluded that China had made ‘clear progress in meeting targets related to energy supply’ but it ‘will need to focus more on its demand-related targets and on improving industrial energy eiciency (where it is currently falling short)’. For 2013, it concluded that ‘development and installation of wind power, natural gas, and nuclear energy ofer a mixed progress report’. Installed wind power capacity grew by about 25% in 2013, and grid connectivity for wind farms has improved. Only 11% of wind-generated power was not transferred to the grid in 2013, while this was 17% in 2012 and 25% in 2011. Both wind and natural gas power generation capacity seem to be on track based on 12th Five-Year Plan targets. In contrast, nuclear energy has remained relatively stagnant since March 2011’ (China Greentech Initiative, 2014).
A more detailed discussion on the uncertainty in Chinese fuel consumption data as reported by diferent sources is presented in Annex 1, Section A1.4. This discussion, which includes conclusions from recent literature on the accuracy of China’s CO2 emissions (Tu, 2011; Andres et al.,
T
WO
2.2.2 United States
In the United States, in 2013, CO2 emissions increased by
2.5% to 5.3 billion tonnes, following a 3.7% decrease in 2012. The emissions level in 2012 was the lowest since 1993 and occurred while the economy was growing, whereas, since 2007 CO2 emissions had been steadily
decreasing every year, with the exception of 2010. CO2
emissions from fossil-fuel combustion, the main source, increased by 2.5% in 2013 compared to 2012, but are still below the 2011 level. When comparing long term trends, we note that while the United States saw a relatively high annual population increase 26% since 1990, its CO2 emissions increased by 6% in this period (for more details see Section 2.3).
The emissions increase in 2013 was mainly due to an increase of 4.4% in the use of coal (BP, 2014), mostly in power generation where it regained some share from natural gas since April 2012 due to the low coal prices, which are lower than those of gas and oil (EIA, 2013c).
However, the consumption of natural gas also increased, by 2.1% (BP, 2014), primarily due to an increase of 4.8% in the residential sector (EIA, 2014h). The later is due to a much larger demand for space heating in 2013 than in 2012, when the United States experienced abnormally warm winter temperatures (23% more so-called Heating Degree Days; AGA, 2014). In the irst half of 2013 gas consumption by the residential and commercial sectors was 20% above 2012 levels (EIA, 2013e) and also in the industrial sector gas consumption was 3% up from 2012. There was also a lower summer peak load and, therefore, less gas consumed for air conditioning in 2013, due to cooler summer weather compared to 2012 (EIA, 2013c; EIA 2014k).
In contrast, natural gas consumption for electric power production was in the total United States more than 10% lower than in 2012 but still higher than the levels before 2012. Electric power plants are stopped or operated based on their cost of operation, which is determined by the price of the fuel and the plant eiciency (EIA, 2013c). Therefore, trends in gas used for power generation vary signiicantly by region, depending on plant availability, age and eiciency and the relative cost of fuels to operate them (EIA, 2013b).
The large increase in shale gas production (see Olivier et al., 2013) caused natural gas prices to decline in the irst half of 2012 to the lowest level in a decade, leading to a switch to gas-ired power generation and less coal-ired power generation in 2012. Moreover, largely due to these lower gas prices, dry natural gas production showed a much slower growth in 2013 of 0.9% compared to the annual average growth of 4.5% in the preceding years
since 2007 when also shale gas production started. Combined with an increase in total demand that was larger than total supply, gas prices saw an upward pressure in 2013 (EIA, 2013e).
However, 50% of power plant capacity additions in 2013 came from natural gas, with more than half located in California. In contrast, about 10% of the capacity addition came from coal, consisting of two plants which were both delayed (EIA, 2014d), and the remaining part of capacity addition was obtained with renewable energy. The increase in 2013 was mainly due to an increase of 4.4% in the use of coal (BP, 2014), mostly in existing power generation.
The US Environmental Protection Agency (US EPA) in September 2014 proposed emission guidelines for the states to address greenhouse gas emissions from existing fossil fuel-ired electric generating units and designed a rule to cut carbon dioxide emissions from existing coal plants by as much as 30% by 2030, compared with 2005 levels (US EPA, 2014b). Currently, coal-ired power plants emit about 30% of total fossil fuel CO2 emissions in the
United States (see Table 3.1), mainly caused by 63% of the operating coal-ired units with over 40 years age (Eilperin and Mufson, 2014). The proposal relects that diferent states have a diferent mix of sources and opportunities and relects the important role that states have in reducing pollution as partner of the federal government. The EPA plans to inalise the proposal in mid-2015 (US EPA, 2014b). The proposal will mainly afect coal-ired power plants and has generated much debate by industry groups, environmental organisation and politics at state and, most importantly, at national level. Due to the later, the implementation of this proposed reduction policy is uncertain (Eilperin and Mufson, 2014).
The consumption of oil products increased by 1.7% in 2013 (BP, 2014), of which three-thirds was used in the transport sector and the remainder mainly by reineries and the manufacturing and building industries in almost equal shares. According to national statistics, in 2013 total oil consumption in transport increased somewhat by 0.5%, relative to 2012 levels. This is in contrast to most preceding years since 2007, in which annual oil
biomass-T
WO
based diesel consumption 2013, driving up imports to a record level of about half of the domestic consumption (EIA, 2014g).
For a discussion on gas laring including the role of hydraulic fracturing, we refer to Section 2.4. Recent policy developments on oil and gas production by hydraulic fracturing in the United States are presented in Section 2.5. A discussion on the sources renewable energy is given in Section 3.3. It is worth to mention that, for the United States, the power production of non-hydro renewable energy (biomass, biofuel, solar power, wind power, land ill gas and geothermal sources) has been exceeding that of hydropower since the end of 2013 (EIA, 2014f).
2.2.3 European Union
The European Union, as a whole, ater a period of recession saw a slow-moving economic growth in 2013; its GDP in that year increased only by 0.1% compared to 2012 (Eurostat, 2014b) while CO2 emissions decreased
by 1.4%. The economic recession ater 2008 inluenced the emission trend but only explains less than 50% of the greenhouse gas emission reductions over this period (EEA, 2014b; Eurogas, 2014).
The share of the EU28 in global total CO2 emissions was
10.6% in 2013 with Germany (2.4%), the United Kingdom (1.3%) and Italy and France (1% each) the largest contributors. Very diferent trends were noticed in the EU Member States, between 2012 and 2013, with increases in Germany (2.3%), France (1.5%) and Poland (1%) and decreases in Spain (10.8%), Italy (5.5%) and the United Kingdom (2.6%).
For the cement and lime production, between 2012 and 2013 the increase in emissions was 6.8% in the EU28; in particular, emissions increased in France with 6.7%, Germany with 2.7%, Spain with 10.3%, the United Kingdom with 11.7% and in Poland with 9.3%. Only in Italy cement and lime production decreased by 8.6% (USGS, 2014).
Regarding transport sector, CO2 emissions in the EU28
decreased in rail freight by 0.9% between 2012 and 2013 and the road freight increased only by 0.3% (International Transport Forum, 2014).
In 2013, CO2 emissions from fossil fuel combustion in
EU28 declined by 1.4% compared with 2012, which is more than the 0.4% decrease in 2012 in our present dataset. We note that Eurostat, the statistical oice of the European Union, estimates for only CO2 from fossil fuel
combustion a decrease in 2013 of 2.5% compared to a
1.6% decrease in 2012 (Eurostat, 2014b). According to Eurostat, CO2 emissions decreased in almost all Member
States, except Denmark (6.8%), Estonia (4.4%), Portugal (3.6%), Germany (2%), France (0.6%) and Poland (0.3%) (Eurostat, 2014b). The main causes of the decline are decreasing fossil fuel consumption and decreasing CO2
emissions in industry and power plants that are part of the EU Emissions Trading System (ETS) (see below).
The EU’s primary energy consumption of oil, gas and coal decreased in 2013 by 2.2%, 1.4% and 2.7%, respectively (BP, 2014). These decreases were mainly driven by a 1.2% reduction in electricity production, increased competition from renewable energy, and a decline by 0.5% of average industrial production in the EU28 compared with 2012 afected the demand from industry (Eurogas, 2014; Eurostat, 2014c).
Emissions from power plants and manufacturing industry installations in the EU28 participating in the EU Emissions Trading System decreased by 3% in 2013 (EC, 2014b). Further reductions are expected also in the other sectors under
Efort Sharing Decision (ESD) policy instrument, which establishes binding annual targets for GHG emissions not covered by EU ETS for all Member States for the 2013– 2020 period (Eurostat, 2014c).
Coal consumption decreased by 2.7% for the EU28 primarily by a decline of 6.5% in the United Kingdom (ater an increase of 24% in 2012), 31.7% in Spain (ater an increase of 23% a year before), 4.5% in Czech Republic and 10.5% in Italy, versus increases in France, Germany, Poland and the Netherlands of 6.7%, 1.5%, 3.3% and 1.7%, respectively (BP, 2014). Almost all coal consumption in these countries was for power generation, except in a few of them, where iron and steel production also had substantial shares. For example, in 2013 Germany contributed to the global iron and steel production by 2.5%, Italy by 1.5%, and Spain and France by 1% each (USGS, 2014; WSA, 2014).
In Europe, there is considerable dynamics around the (expected) decommissioning of old coal-ired power plants, the mothballing of both coal and gas plants and the construction of new plants as older coal-ired power stations are to be replaced by new more eicient coal-ired or natural gas plants, or by wind and solar power (see e.g. Cardecot and McDaniels, 2014). Some of the main changes in the coming years in coal-ired power production are described below.
T
WO
place for coal and lignite. Coal mining in Germany is subsidised until 2018; lignite production does not need subsidies and more than 90% is used for electricity and heat generation (Poyry, 2013). In 2011 and 2012, old coal-ired power plants with a total capacity of 1,700 MW were permanently closed down. However, also 2 new coal-ired plants with a total capacity of 2,700 MW started production in 2012, 2 plants with a total capacity of 1,500 MW started production in 2013, and 8 are currently (2014) under construction, which will provide a total additional capacity of 7,000 MW in the coming year (Sourcewatch, 2013a; Bundesnetzagentur, 2014).
In the Netherlands, three new coal-ired power plants with a total capacity of 2,700 MW started production in 2014. These plants will not replace closed down old power plants, but have been built in anticipation of the closure of some old plants, for which complying with the emission standards set in the Large Combustion Plants Directive (LCPD, 2011) is expensive. For example, 85% of Poland’s power generation is supplied for about 85% by coal-ired plants, of which two thirds are over 30 years old (CCE Bankwatch, 2013). In most EU Member States, these new coal plants are said to be ‘CCS ready’, i.e. the infrastructure would allow for a carbon capture and storage (CCS) facility next to the power plant.
The United Kingdom has not constructed any new coal-ired power plants over the last decade (DECC, 2012). Moreover, it has already converted three plants to biomass with a total capacity of 5,160 MW, and closed another four coal-ired plants with a total capacity of 14,670 MW (Sourcewatch, 2013b; Reuters, 2012d; Airlie, 2011).
Spain has also decreased the share of coal in its power generation, considerably, and continues to do so by quadrupling the tax rate on coal and not renewing the subsidies for such coal-ired plants. Since 2010, Spain has been delivering more than 20% of its electricity from renewable sources by widespread deployment of wind power and is investing further in wind and solar technologies (Poyry, 2013). Recently, Spain has made a series of large legislative changes to its renewable energy policy, in order to control the country’s growing electricity tarif deicit, turning renewable energy into a fully regulated business resulting in a levelling-of of further growth (Economist, 2013b; Ernst and Young, 2012).
The European Council gives strategic orientations with respect to consensus on ETS, non-ETS, interconnections and energy eiciency and agreed in October 2014 on the 2030 Climate and Energy Policy Framework (EC, 2014h), commiting mainly to:
– A binding target of at least 40% domestic reduction in GHG emissions by 2030 compared to 1990, delivered by the European Union collectively through reduc-tions in the ETS and non-ETS sectors;
– A binding target of at least 27% in 2030 is set for the share of renewable energy consumed collectively in the European Union and 27% for improving the energy eiciency;
– To ensure the achievement of a minimum target of 10% of existing electricity interconnections by 2020; – To increase the EU’s energy security for electricity
and gas.
To achieve the overall 40% target, the sectors covered by the EU emissions trading system (EU ETS) would have to reduce their emissions by 43% compared to 2005. Emissions from sectors outside the EU ETS would need to be cut by 30% below the 2005 level. The new Energy Eiciency Directive entered into force in December 2012 and establishes a common framework of measures for the promotion of energy eiciency within the Union in order to ensure the achievement of the Union’s 2020 20 % headline target on energy eiciency and further improvements towards 2030 (EC, 2014c). The European Council agreed to review by 2020 the 2030 targets, which remain so far indicative. The willingness of all 28 EU Member States to go together for 40-27-27 by 2030 sends a clear message for the next UNFCCC round of COP21 in Paris, 2015. The unanimous backing of the Council on the 40% reduction target, including a 43% target compared to 2005 for the ETS sectors also sends a political signal to the market that the EU ETS remains a major greenhouse gas reduction mechanism for the European Union.
During the irst two phases, the EU ETS struggled by oversupply and falling carbon prices – up to one order of magnitude. In addition, so-called windfall proit increased due to free allowances (given through grandfathering) to sectors that can include these potential costs in their price seting. In the irst phase from 2005-2007 oversupply was a genuine issue because the Member States had allocated too much, while in the second period 2008-2012 the oversupply was due to a larger than expected emissions drop caused the economic recession. During the third EU ETS phase (from 2013 to 2020) auctioning of allowances (for the power generation) was introduced progressively from January 2013 onwards. Some estimates suggest that the current surplus of allowances amount to 1.5 billion – 2 billion tonnes of carbon and might even worsen before the end of Phase 3 in 2020. The surplus prompted the
T
WO
A new instrument, rendering the supply of emission allowances on auction more lexible and making the ETS more resilient to any future large-scale event that may severely disturb the supply–demand balance was considered: a Market Stability Reserve of CO2 (MRS), which
will be introduced from 2021 onwards (EC, 2014b).
2.2.4 India
India, where domestic demand makes up three-quarters of the national economy (Damodaran, 2011), has been relatively unafected by the global inancial recession because this recession in fact stimulated the already high share of domestic consumption in total national expenditure. Nevertheless, ater an increase of about 10% in 2010, India’s GDP growth has slowed in recent years; in 2012 the GDP increased by 4.7% and in 2013 by 5.0% that is comparable to a 4% GDP growth in 2008, which was the lowest in a decade (World Bank, 2014).
India’s CO2 emissions in 2013 continued to increase by
4.4% to about 2.1 billion tonnes, making it the fourth largest CO2 emiting country, following closely the
European Union, and well ahead of the Russian Federation, which is the ith largest emiting country (Figure 2.2). This high ranking is partly caused by the size of its population and economy; the workforce is expanding in the industry and services sectors, partially because of international outsourcing (World Bank, 2014). Per capita, India’s CO2 emissions were much lower than
those of most developed countries and China (Figure 2.4).
The increase in 2013 was mainly caused by a 7.3% increase in coal consumption, which accounted for 59% of India’s total fossil-fuel primary energy consumption and 55% of its total primary energy consumption (BP, 2014). This growth rate was lower than in the previous year, but much higher than those of 2010 and 2011. Coal-based power production, accounting for almost 70% of all of India’s coal-related CO2 emissions, grew by about 13% in
2012, the highest annual growth ever. Both the additional capacity and generation level were higher (Saikia and Sarkar, 2013). This coal share of 59% in India is smaller than those of China and South Africa (74% share of coal in their fossil-fuel mix) but similar to that of Poland and Kazakhstan, other countries with large coal resources, and larger than the global average share in 2013 of 34.4%.
In the last ive years the amount of imported coal and