Studies in Big Data 50
Francesco Corea
An
Introduction
to Data
Studies in Big Data
Volume 50
Series editor
The series“Studies in Big Data”(SBD) publishes new developments and advances in the various areas of Big Data—quickly and with a high quality. The intent is to cover the theory, research, development, and applications of Big Data, as embedded in thefields of engineering, computer science, physics, economics and life sciences. The books of the series refer to the analysis and understanding of large, complex, and/or distributed data sets generated from recent digital sources coming from sensors or other physical instruments as well as simulations, crowd sourcing, social networks or other internet transactions, such as emails or video click streams and other. The series contains monographs, lecture notes and edited volumes in Big Data spanning the areas of computational intelligence incl. neural networks, evolutionary computation, soft computing, fuzzy systems, as well as artificial intelligence, data mining, modern statistics and Operations research, as well as self-organizing systems. Of particular value to both the contributors and the readership are the short publication timeframe and the world-wide distribution, which enable both wide and rapid dissemination of research output.
Francesco Corea
An Introduction to Data
Everything You Need to Know About AI,
Big Data and Data Science
Francesco Corea
Department of Management Ca’Foscari University Venice, Italy
ISSN 2197-6503 ISSN 2197-6511 (electronic) Studies in Big Data
ISBN 978-3-030-04467-1 ISBN 978-3-030-04468-8 (eBook) https://doi.org/10.1007/978-3-030-04468-8
Library of Congress Control Number: 2018961695
©Springer Nature Switzerland AG 2019
This work is subject to copyright. All rights are reserved by the Publisher, whether the whole or part of the material is concerned, specifically the rights of translation, reprinting, reuse of illustrations, recitation, broadcasting, reproduction on microfilms or in any other physical way, and transmission or information storage and retrieval, electronic adaptation, computer software, or by similar or dissimilar methodology now known or hereafter developed.
The use of general descriptive names, registered names, trademarks, service marks, etc. in this publication does not imply, even in the absence of a specific statement, that such names are exempt from the relevant protective laws and regulations and therefore free for general use.
The publisher, the authors and the editors are safe to assume that the advice and information in this book are believed to be true and accurate at the date of publication. Neither the publisher nor the authors or the editors give a warranty, express or implied, with respect to the material contained herein or for any errors or omissions that may have been made. The publisher remains neutral with regard to jurisdictional claims in published maps and institutional affiliations.
Preface
This book aims to be an introduction to big data, artificial intelligence and data science for anyone who wants to learn more about those domains. It is neither a fully technical book nor a strategic manual, but rather a collection of essays and lessons learned doing this job for a while.
In that sense, this book is not an organic text that should be read from thefirst page onwards, but rather a collection of articles that can be read at will (or at need). The structure of the chapter is very similar, so I hope the reader won’tfind diffi-culties in establishing comparisons or understanding the differences between specific problems AI is being used for. I personally recommend reading the first three-four chapters in a row to have a general overview of the technologies and then jump around depending on what topic interests you the most.
The book also replicates some of the contents already introduced in previous research as well as shows new material created working as a data scientist, as a startup advisor as an investor. It is therefore to some extent both a new book and a 2.0 version of some previous work of mine, but for sure the content is reorganized in a completely new way and gets new meaning when read in a different context. Artificial intelligence is certainly a hot topic nowadays, and this book wants to be both a guide on the past and a tool to look into the future. I always tried to maintain a balance between explaining concepts, tools and ways in which AI has been used, andpotentialapplications or trends for future. I hope the reader mayfind himself not only grasping how relevant AI, big data and data science are for our progress as a society, but also wonderingwhat’s next.
The book is structured in such a way that thefirst few chapters explain the most relevant definitions and business contexts where AI and big data can have an impact. The rest of the book looks instead at specific sectorial applications, issues or more generally subjects that AI is meaningfully changing.
Finally, I am writing this book hoping that it will be valuable for some readers in how they think and use technologies to improve our lives and that it could stimulate conversations or projects that could produce a positive impact in our society.
Venice, Italy Francesco Corea
Contents
1 Introduction to Data. . . 1
References . . . 4
2 Big Data Management: How Organizations Create and Implement Data Strategies . . . 7
References . . . 13
3 Introduction to Artificial Intelligence . . . 15
3.1 Basic Definitions and Categorization . . . 15
3.2 A Bit of History. . . 18
3.3 Why AI Is Relevant Today . . . 20
References . . . 22
4 AI Knowledge Map: How to Classify AI Technologies . . . 25
References . . . 29
5 Advancements in the Field . . . 31
5.1 Machine Learning. . . 31
5.2 Neuroscience Advancements . . . 34
5.3 Hardware and Chips . . . 36
References . . . 38
6 AI Business Models. . . 41
Reference. . . 46
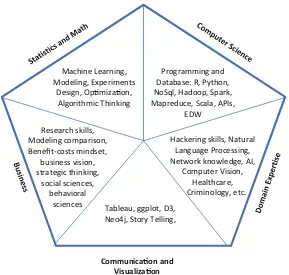
7 Hiring a Data Scientist . . . 47
References . . . 51
8 AI and Speech Recognition. . . 53
8.1 Conversation Interfaces. . . 53
8.2 The Challenges Toward Master Bots . . . 54
8.3 How Is the Market Distributed?. . . 55
14.2 The Advantages of Patenting Your Product . . . 94
14.3 Reasons Behind not Looking for Patent Protection . . . 96
14.4 The Patent Landscape . . . 98
14.5 Conclusions . . . 99
References . . . 99
15 AI and Venture Capital . . . 101
15.1 The Rationale. . . 101
15.2 Previous Studies. . . 102
15.2.1 Personal and Team Characteristics . . . 102
15.2.2 Financial Considerations. . . 104
15.2.3 Business Features. . . 104
15.2.4 Industry Knowledge. . . 105
15.2.5 An Outsider Study: Hobos and Highfliers . . . 105
15.3 Who Is Using AI in the Private Investment Field . . . 107
15.4 Conclusions . . . 108
References . . . 108
16 A Guide to AI Accelerators and Incubators . . . 111
16.1 Definitions . . . 111
16.2 Are They Worth Their Value?. . . 112
16.2.1 Entrepreneur Perspective: To Join or not to Join . . . 112
16.2.2 Investor Perspective: Should I Stay or Should I Go. . . 113
16.2.3 Accelerators Assessment Metrics: Is the Program Any Good? . . . 114
16.3 A Comparison Between Accelerators. . . 115
16.4 Final Thoughts. . . 115
References . . . 118
Appendix A: Nomenclature for Managers . . . 119
Appendix B: Data Science Maturity Test. . . 123
Appendix C: Data Scientist Extended Skills List (Examples in Parentheses). . . 127
Appendix D: Data Scientist Personality Questionnaire. . . 129
List of Figures
Fig. 2.1 Big data lean deployment approach. . . 8
Fig. 2.2 Big data maturity map. . . 11
Fig. 2.3 Maturity stage transitions. . . 12
Fig. 2.4 Data analytics organizational models. . . 13
Fig. 3.1 Artificial intelligence trend for the period 2012–2016. . . 19
Fig. 4.1 AI knowledge map. . . 26
Fig. 6.1 Artificial intelligence classification matrix. . . 45
Fig. 7.1 Data scientist core skills set. . . 48
Fig. 7.2 Data science value chain . . . 50
Fig. 8.1 Bots classification matrix. . . 55
Fig. 10.1 Innovation transfer: the biopharma industry. . . 64
List of Tables
Table 2.1 Data stage of development structure . . . 9
Table 7.1 Data scientists’personality assessment and classification. . . 50
Table 15.1 Taxonomy of signals to predict probability of startup success. . . 106
Table 16.1 AI accelerators and incubators. . . 116
Table B.1 Data science maturity test classification. . . 125
Table D.1 Data scientist personality classification . . . 131
Chapter 1
Introduction to Data
There are many ways to define what big data is, and this is probably why it still remains a really difficult concept to grasp. Today, someone describes big data as dataset above a certain threshold, e.g., over a terabyte (Driscoll2010), others as data that crash conventional analytical tools like Microsoft Excel. More renowned works though identified big data as data that display features of Variety, Velocity, and Volume (Laney 2001; McAfee and Brynjolfsson 2012; IBM 2013; Marr 2015). Even though they are all partially true, there is a definition that seems to better capture this phenomenon (Dumbill2013; De Mauro et al. 2015; Corea 2016): big data analytics is an innovative approach that consists of different technologies and processes to extract worthy insights from low-value data that do not fit, for any reason, the conventional database systems.
In the last few years the academic literature on big data has grown extensively (Lynch2008). It is possible tofind specific applications of big data to almost any field of research (Chen et al.2014). For example, big data applications can be found in medical-health care (Murdoch and Detsky2013; Li et al.2011; Miller2012a,b); biology (Howe et al. 2008); governmental projects and public goods (Kim et al. 2014; Morabito2015);financial markets (Corea2015; Corea and Cervellati2015). In other more specific examples, big data have been used for energy control (Moeng and Melhem 2010), anomaly detection (Baah et al. 2006), crime prediction (Mayer-Schönberger and Cukier 2013), and risk management (Veldhoen and De Prins2014).
No matter what business is considered, big data are having a strong impact on every sector: Brynjolfsson et al. (2011) proved indeed that a data-driven business performs between 5 and 6% better than its competitors. Other authors instead focused their attention on organizational and implementation issues (Wielki2013; Mach-Król et al.2015). Marchand and Peppard (2013) indicatedfive guidelines for a successful big data strategy: (i) placing people at the heart of Big Data initiatives; (ii) highlighting information utilization to unlock value; (iii) adding behavioral scientists to the team; (iv) focusing on learning; and (v) focusing more on business problems than technological ones. Barton and Court (2012) on the other hand
©Springer Nature Switzerland AG 2019
F. Corea,An Introduction to Data, Studies in Big Data 50, https://doi.org/10.1007/978-3-030-04468-8_1
identified three different key features for exploiting big data potential: choosing the right data, focusing on biggest driver of performance to optimize the business, and transforming the company’s capabilities.
Data are quickly becoming a new form of capital, a different coin, and an innovative source of value. It has been mentioned above how relevant it is to channel the power of the big data into an efficient strategy to manage and grow the business. But it is also true that big data strategies may not be valuable for all businesses, mainly because of structural features of the business/company itself. However, it is certain that a data strategy is still useful, no matter the size of your data. Hence, in order to establish a data framework for a company, there arefirst of all few misconceptions that need to be clarified:
i) More data means higher accuracy. Not all data are good quality data, and tainting a dataset with dirty data could compromise the final products. It is similar to a blood transfusion: if a non-compatible blood type is used, the out-come can be catastrophic for the whole body. Secondly, there is always the risk of overfitting data into the model, yet not derive any further insight—“if you torture the data enough, nature will always confess”(Coase2012). In all applications of big data, you want to avoid striving for perfection: too many variables increase the complexity of the model without necessarily increasing accuracy or efficiency. More data always implies higher costs and not nec-essarily higher accuracy. Costs include: higher maintenance costs, both for the physical storage and for model retention; greater difficulties in calling the shots and interpreting the results; more burdensome data collection and time-opportunity costs. Undoubtedly the data used do not have to be orthodox or used in a standard way—and this is where the real gain is locked in—and they may challenge the conventional wisdom, but they have to be proven and validated. In summary, smart data strategies always start from analyzing internal datasets, before integrating them with public or external sources. Do not store and process data just for data’s sake, because with the amount of data being generated daily, the noise increases faster than the signal (Silver2013). Pareto’s 80/20 rule applies: the 80% of the phenomenon could be probably explained by the 20% of the data owned.
ii) If you want to do big data,you have to start big. A good practice before investing heavily in technology and infrastructures for big data is to start with few high-value problems that validate whether big data may be of any value to your organization. Once the proof of concept demonstrates the impact of big data, the process can be scaled up.
iii) Data equals Objectivity. First of all, data need to be contextualized, and their “objective”meaning changes depending on the context. Even though it may sound a bit controversial, data can be perceived as objective—when it captures facts from natural phenomena—or subjective—if it reflects pure human or social constructs. In other words, data can be factual, i.e., the ones that are univocally the same no matter who is looking at them, orconventional/social —the more abstract data, which earn its right to representativeness from the
general consensus. Think about this second class of data as the notions of value, price, and so forth. It is important to bear this distinction in mind because the latter class is easier to manipulate or can be victim of a self-fulfilling prophecy. As stated earlier on, the interpretation of data is the quintessence of its value to business. Ultimately, both types of data could provide different insights to different observers due to relative problem frameworks or interpretation abilities (the so-calledframing effect). Data sci-ence will therefore never be a proper scisci-ence, because it will lack of full objectivity and full replicability, and because not every variable can be pre-cisely quantified, but only approximated.
Let’s also not forget that a wide range of behavioral biases that may invalidate the objectivity of the analysis affects people. The most common ones between both scientists and managers are:apophenia(distinguishing patterns where there are not),narrative fallacy(the need to t patterns to series of disconnected facts), confirmation bias (the tendency to use only information that confirms some priors)—and his corollary according to which the search for evidences will eventually end up with evidences discovery—andselection bias(the propensity to use always some type of data, possibly those that are best known). Afinal interesting big data curse to be pointed out is nowadays getting known as the “Hathaway’s effect”: it looked like that where the famous actress appeared positively in the news, Warren Buffett’s Berkshire Hathaway company observed an increase in his stock price. This suggests that sometime there exist correlations that are either spurious or completely meaningless and groundless.
iv) Your data will reveal you all the truth. Data on its own are meaningless, if you do not pose the right questionsfirst. Readapting what DeepThought says inThe Hitchhikers’Guide to the Galaxywritten by Adams many years ago, big data can provide thefinal answer to life, the universe, and everything, as soon as the right question is asked. This is where human judgment comes into: posing the right question and interpreting the results are still competence of the human brain, even if a precise quantitative question could be more efficiently replied by any machine.
The alternative approach that implements a random data discovery—the so-called“let the data speak”approach—is highly inefficient, resource consuming and potentially value-destructive. An intelligent data discovery process and exploratory analysis therefore is highly valuable, because“we don’t know what we don’t know”(Carter2011).
The main reasons why data mining is often ineffective is that it is undertaken without any rationale, and this leads to common mistakes such as false positives, overfitting, ignoring spurious relations, sampling biases, causation-correlation reversal, wrong variables inclusion or model selection (Doornik and Hendry2015; Harford 2014). A particular attention has to be put on the causation-correlation problem, since observational data only take into account the second aspect. However, According to Varian (2013) the problem can be solved through experimentations.
References
Baah, G. K., Gray, A., Harrold, M. J. (2006). Online anomaly detection of deployed software: A statistical machine learning approach. InProceedings of the 3rd International Workshop on Software Quality Assurance, 70–77.
Barton, D., & Court, D. (2012). Making advanced analytics work for you.Harvard Business Review, 90(10), 78–83.
Brynjolfsson, E., Hitt, L. M., & Kim, H. H. (2011). Strength in numbers: How does data-driven decision making affect firm performance?. Available at SSRN: http://ssrn.com/abstract= 1819486.
Carter, P. (2011). Big data analytics: Future architectures, skills and roadmaps for the CIO.IDC White Paper, Retrieved from http://www.sas.com/resources/asset/BigDataAnalytics-FutureArchitectures-Skills-RoadmapsfortheCIO.pdf.
Chen, M., Mao, S., Zhang, Y., Leung, V.C. (2014). Big data: Related technologies, challenges and future prospects, SpringerBriefs in Computer Science, 59.
Coase, R. H. (2012).Essays on economics and economists, University of Chicago Press. Corea, F. (2015). Why social media matters: the use of Twitter in portfolio strategies.International
Journal of Computer Applications, 128(6), 25–30.
Corea, F. (2016).Big data analytics: A management perspective.Studies Series in Big Data, 21. Springer International Publishing.
Corea, F., & Cervellati, E. M. (2015). The power of micro-blogging: How to use twitter for predicting the stock market.Eurasian Journal of Economics and Finance, 3(4), 1–6. De Mauro, A., Greco, M., & Grimaldi, M. (2015). What is big data? A consensual definition and a
review of key research topics.AIP Conference Proceedings, 1644,97–104.
Doornik, J. A., & Hendry, D. F. (2015). Statistical model selection with big data. Cogent Economics & Finance, 3,1045216.
Driscoll, M. E. (2010, Dec. 20). How much data is“Big Data”?, [Msg 2]. Message posted to https://www.quora.com/How-much-data-is-Big-Data.
Dumbill, E. (2013). Making sense of big data.Big Data, 1(1), 1–2.
Harford, T. (2014). Big data: Are we making a big mistake? Financial Times. Retrieved fromhttp:// www.ft.com/cms/s/2/21a6e7d8-b479-11e3-a09a-00144feabdc0.html#ixzz2xcdlP1zZ. Howe, A. D., Costanzo, M., Fey, P., Gojobori, T., Hannick, L., Hide, W.…Rhee, S. Y. (2008).
Big data: The future of biocuration.Nature,455(7209), 47–50.
IBM (2013). The four V’s of big data. Retrieved from http://www.ibmbigdatahub.com/ infographic/four-vs-big-data.
Kim, G. H., Trimi, S., & Chung, J. H. (2014). Big-data applications in the government sector. Communications of the ACM, 57(3), 78–85.
Laney, D. (2001). 3D data management: Controlling data volume, velocity, and variety. META group Inc. https://blogs.gartner.com/doug-laney/fi les/2012/01/ad949-3D-Data-Management-Controlling-Data-Volume-Velocity-and-Variety.pdf. Accessed on Oct 27, 2015.
Li, Y., Hu, X., Lin, H., & Yang, Z. (2011). A framework for semisupervised feature generation and its applications in biomedical literature mining. IEEE/ACM Transactions on Computational Biology and Bioinformatics (TCBB), 8(2), 294–307.
Lynch, C. (2008). Big data: How do your data grow?Nature, 455,28–29.
Mach-Król, M., Olszak, C. M., Pełech-Pilichowski, T. (2015). Advances in ICT for business, industry and public sector.Studies in Computational Intelligence. Springer, 200 pages. Marchand, D., & Peppard, J. (2013). Why IT fumbles analytics.Harvard Business Review, 91(1/
2), 104–113.
Marr, B. (2015).Big data: Using SMART big data, analytics and metrics to make better decisions and improve performance. Wiley, 256 pages.
Mayer-Schönberger, V.,Cukier, K. (2013). Big data: A revolution that will transform how we live, work, and think. Eamon Dolan/Houghton Mifflin Harcourt.
McAfee, A., & Brynjolfsson, E. (2012). Big data: The management revolution.Harvard Business Review, 90(10), 60–66.
Miller, K. (2012a). Leveraging social media for biomedical research: How social media sites are rapidly doing unique research on large cohorts.Biomedical Computation Review(available at http://biomedicalcomputationreview.org/content/leveraging-social-media-biomedical-research. Accessed October 27, 2015).
Miller, K. (2012b). Big data analytics in biomedical research.Biomedical Computation Review (available at https://biomedicalcomputationreview.org/content/big-data-analytics-biomedical-research. Accessed October 27, 2015).
Moeng, M., Melhem, R. (2010). Applying statistical machine learning to multicore voltage and frequency scaling. InProceedings of the 7th ACM international conference on Computing frontiers, 277–286.
Morabito, V. (2015). Big data and analytics: Strategic and organizational impacts. Springer International Publishing, 183 pages.
Murdoch, T. B., & Detsky, A. S. (2013). The inevitable application of big data to health care. JAMA, 309(13), 1351–1352.
Silver, N. (2013).The signal and the noise: The art and science of prediction. Penguin. Varian, H. (2013). Beyond big data. NABE annual meeting, San Francisco, CA, September 10th,
2013.
Veldhoen, A., De Prins, S. (2014). Applying big data to risk management.Avantage Reply Report, 1–14.
Wielki, J. (2013). Implementation of the Big Data concept in organizations—possibilities, impediments, and challenges. InProceedings of the 2013 Federated Conference on Computer Science and Information Systems, 985–989.
Chapter 2
Big Data Management: How
Organizations Create and Implement
Data Strategies
It has been mentioned above how relevant it is to channel the power of the big data into an effective strategy to manage and grow the business. However, a consensus on how and what to implement is difficult to be achieved and what is then proposed is only one possible approach to the problem.
Following the guidelines given by Doornik and Hendry (2015), wefind a lean approach to data problem to be not only useful but above all efficient. It actually reduces time, effort and costs associated with data collection, analysis, technolog-ical improvements and ex-post measuring. The relevance of the framework lies in avoiding the extreme opposite situations, namely collecting all or no data at all. The Fig. 2.1illustrates key steps towards this lean approach to big data: first of all, business processes have to be identified, followed by the analytical framework that has to be used. These two consecutive stages have feedback loops, as well as the definition of the analytical framework and the dataset construction, which has to consider all the types of data, namely data at rest (static and inactively stored in a database), at motion (inconstantly stored in temporary memory), and in use (con-stantly updated and store in database). The modeling phase is crucial, and it embeds the validation as well, while the process ends with the scalability implementation and the measurement. A feedback mechanism should prevent an internal stasis, feeding the business process with the outcomes of the analysis instead of improving continuously the model without any business response.
Data need to be consistently aggregated from different sources of information, and integrated with other systems and platforms; common reporting standards should be created—the master copy—and any information should need to be eventually validated to assess accuracy and completeness. Finally, assessing the skills and profiles required to extract value from data, as well as to design efficient data value chains and set the right processes, are two other essential aspects. Having a solid internal data management, jointly with a well-designed golden record, helps to solve the huge issue ofstratified entrance: dysfunctional datasets resulting from different people augmenting the dataset at different moments or across different layers.
©Springer Nature Switzerland AG 2019
F. Corea,An Introduction to Data, Studies in Big Data 50, https://doi.org/10.1007/978-3-030-04468-8_2
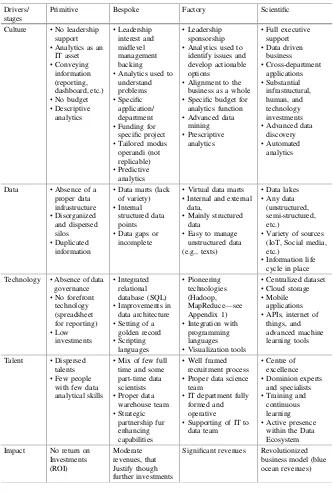
Even if a data lean approach is used, companies may incur many problems. It is essential then to develop a framework to track internal developments and obstacles, as well as to draw the next steps in the analytics journey. A Data Stage of Development Structure(DS2) is a maturity model built for this purpose, a roadmap developed to implement a revenue-generating and impactful data strategy. It can be used to assess a company’s current situation, and to understand the future steps to undertake to enhance internal big data capabilities.
Table2.1provides a four by four matrix where the increasing stages of evolution are indicated asPrimitive,Bespoke,Factory, andScientific, while the metrics they are considered through areCulture,Data,Technology, and Talent. Thefinal con-siderations are drawn in the last row, the one that concerns thefinancial impact on the business of a well-set data strategy.
Stage one is about raising awareness: the realization that data science could be relevant to the company business. In this phase, there are neither any governance structures in place nor any pre-existing technology, and above all no organization-wide buy-in. Yet, tangible projects are still the result of individual’s data enthusi-asm being channeled into something actionable. The set of skills owned is still rudimental, and the actual use of data is quite rough. Data are used only to convey basic information to the management, so it does not really have any impact on the business. Being at this stage does not mean being inevitably unsuccessful, but it simply shows that the projects performance and output are highly variable, con-tingent, and not sustainable. The second Phase is the reinforcing: it is actually an exploration period. The pilot has proved big data to have a value, but new com-petencies, technologies, and infrastructures are required—and especially a new data governance, in order to also take track of possible data contagion and different Fig. 2.1 Big data lean deployment approach
actors who enter the data analytics process at different stages. Since management’s contribution is still very limited, the potential applications are relegated to a single department or a specific function. The methods used although more advanced than in Phase one are still highly customized and not replicable. By contrast, Phase three adopts a more standardized, optimized, and replicable process: access to the data is much broader, the tools are at the forefront, and a proper recruitment process has been set to gather talents and resources. The projects benefit from regular bud-get allocation, thanks to the high-level commitment of the leadership team. Step four deals with the business transformation: every function is now data-driven, it is led by agile methodologies (i.e., deliver value incrementally instead of at the end of the production cycle), and the full-support from executives is translated into a series of relevant actions. These may encompass the creation of a Centre of Excellence (i.e., a facility made by top-tier scientists, with the goal of leveraging and fostering research, training and technology development in thefield), high budget and levels of freedom in choosing the scope, or optimized cutting-edge technological and architectural infrastructures, and all these bring a real impact on the revenues’flow. A particular attention has to be especially put on data lakes, repositories that store data in native formats: they are low costs storage alternatives, which supports manifold languages. Highly scalable and centralized stored, they allow the com-pany to switch without extra costs between different platforms, as well as guarantee a lower data loss likelihood. Nevertheless, they require a metadata management that contextualizes the data, and strict policies have to be established in order to safe-guard the data quality, analysis, and security. Data must be correctly stored, studied through the most suitable means, and to be breach-proof. An information lifecycle has to be established and followed, and it has to take particular care of timely efficient archiving, data retention, and testing data for the production environment. Afinal consideration has to be spared about cross-stage dimension“culture”. Each stage has associated a different kind of analytics, as explained in Davenport (2015). Descriptive analytics concerned what happened, predictive analytics is about future scenarios (sometimes augmented by diagnostic analytics, which investigates also the causes of a certain phenomenon), prescriptive analytics sug-gests recommendations, and finally, automated analytics are the ones that take action automatically based on the analysis’results.
data variety used in the different stages, meaning structure, semi-structured, or unstructured data (i.e., IoT, sensors, etc.). The orange diagonal represents what kind of data are used: from closed systems of internal private networks in the bottom left quadrant to market/public and external data in the top right corner.
Once the different possibilities and measurements have been identified (see the Appendix II or Corea2016for the full details on the framework), they can be used to understand what stage afirm belongs to. It is also useful to see how a company could transition from one level to the next and in the following figure some rec-ommended procedures have been indicated to foster this transition.
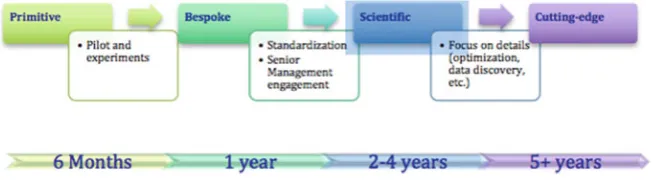
In order to smoothly move from thePrimitivestage to the Bespoke, it is nec-essary to proceed by experiments run from single individuals, who aim to create proof of concepts or pilots to answer a single small question using internal data. If these questions have a good/high-value impact on the business, they could be acknowledged faster. Try to keep the monetary costs low as possible (cloud, open source, etc.), since the project will be already expensive in terms of time and manual effort. On a company level, the problem of data duplication should be addressed. The transition fromBespoketoFactoryinstead demands the creation of standard procedures and golden records, and a robust project management support. The technologies, tools, and architecture have to be experimented, and thought as they are implemented or developed to stay. The vision should be medium/long term then. It is essential to foster the engagement of the higher- senior management level. At a higher level, new sources and type of data have to be promoted, data gaps have to be addressed, and a strategy for platforms resiliency should be developed. In particular, it has to be drawn down the acceptable data loss (Recovery Point Objective), and the expected recovered time for disrupted units (Recovery Time Objective). Finally, to become data experts and leaders and shifting to theScientific level, it is indispensable to focus on details, optimize models and datasets, improve Fig. 2.2 Big data maturity map
the data discovery process, increase the data quality and transferability, and iden-tifying a blue ocean strategy to pursue. Data security and privacy are essential, and additional transparency on the data approach should be released to the shareholders. A Centre of Excellence (CoE) and a talent recruitment value chain play a crucial role as well, with thefinal goal to put the data science team in charge of driving the business. The CoE is indeed fundamental in order to mitigate the short-term per-formance goals that managers have, but it has to be reintegrated at some point for the sake of scalability. It would be possible now to start documenting and keeping track of improvements and ROI. From thefinal step on, a process of continuous learning and forefront experimentations is required to maintain a leadership and attain respectability in the data community.
In Fig.2.3 it has also been indicated a suggested timeline for each step, respectively up to six months for assessing the current situation, doing some research and starting a pilot; up to one year for exploiting a specific project to understand the skills gap, justify a higher budget allocations, and plan the team expansion; two to four years to verify the complete support from every function and level within thefirm, andfinally at leastfive years to achieving a fully-operationally data-driven business. Of course, the time needed by each company varies due to several factors, so it should be highly customizable.
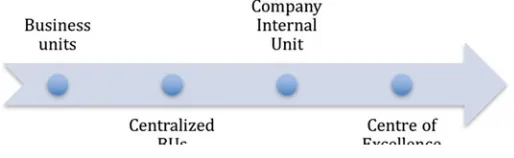
A few more words should be spent regarding the organizational home for data analytics (Pearson and Wegener2013). We claimed that the Centre of Excellence is the cutting-edge structure to incorporate and supervise the data functions within a company. Its main task is to coordinate cross-units’ activities, which embeds: maintaining and upgrading the technological infrastructures; deciding what data have to be gathered and from which department; helping with the talents recruit-ment; planning the insights generation phase, and stating the privacy, compliance, and ethics policies. However, other forms may exist, and it is essential to know them since sometimes they mayfit better into the preexisting business model.
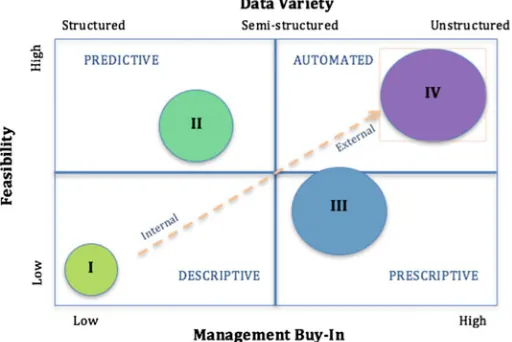
Figure2.4 shows different combinations of data analytics independence and business models. It ranges between business units (BUs) that are completely independent one from the other, to independent BUs that join the efforts in some specific projects, to an internal (corporate center) or external (center of excellence) center that coordinates different initiatives.
Fig. 2.3 Maturity stage transitions
In spite of everything, all the considerations made so far mean different things and provide singular insights depending on thefirm’s peculiarities. In particular, the different business life cycle phase in which the company is operating deeply influences the type of strategy to be followed, and it is completely unrelated to the maturity data stage to which they belong (i.e., a few months old company could be aScientificfirm, while a big investment bank only aPrimitiveone).
References
Corea, F. (2016).Big Data Analytics: A Management Perspective. Studies Series in Big Data,21. Springer International Publishing.
Davenport, T. H. (2015). The rise of automated analytics.The Wall Street Journal, January 14th 2015. Accessed on October 30th 2015 (available athttp://www.tomdavenport.com/wp-content/ uploads/The-Rise-of-Automated-Analytics.pdf).
Doornik, J. A., & Hendry, D. F. (2015). Statistical model selection with big data. Cogent Economics & Finance, 3,1045216.
Pearson, T., Wegener, R. (2013). Big data: the organizational challenge, Bain & Company White paper.
Fig. 2.4 Data analytics organizational models
Chapter 3
Introduction to Arti
fi
cial Intelligence
Artificial Intelligence (AI) represents nowadays a paradigm shift that is driving at the same time the scientific progress as well as the industry evolution. Given the intense level of domain knowledge required to really appreciate the technicalities of the artificial engines, what AI is and can do is often misunderstood: the general audience is fascinated by its development and frightened by terminator-like sce-narios; investors are mobilizing huge amounts of capital but they have not a clear picture of the competitive drivers that characterize companies and products; and managers are rushing to get their hands on the last software that may improve their productivities and revenues, and eventually their bonuses.
Even though the general optimism around creating advancements in artificial intelligence is evident (Muller and Bostrom 2016), in order to foster the pace of growth facilitated by AI I believe it would be necessary to clarify some concepts. The intent of this work is then manifold: explaining and defining few relevant terms, summarizing history of AI as well as literature advancements; investigating further innovation that AI is bringing both in scientific and business models terms; understanding where the value lies for investors; and eventually stimulating dis-cussion about risk and future developments driven by AI.
3.1
Basic De
fi
nitions and Categorization
First, let’s describe what artificial intelligence means. According to Bostrom (2014), AI today is perceived in three different ways: it is something that might answer all your questions, with an increasing degree of accuracy (“the Oracle”); it could do anything it is commanded to do (“the Genie”), or it might act autonomously to pursue a certain long-term goal (“the Sovereign”). However, AI should not be defined by what it can do or not, and thus a broader definition is appropriate.
©Springer Nature Switzerland AG 2019
F. Corea,An Introduction to Data, Studies in Big Data 50, https://doi.org/10.1007/978-3-030-04468-8_3
An artificial intelligence is a system that can learn how to learn, or in other words a series of instructions (an algorithm) that allows computers to write their own algorithms without being explicitly programmed for.
Although we usually think about intelligence as the computational part of our ability to achieve certain goals, it is rather the capacity to learn and solve new problems in a changing environment. In a primordial world then, it is simply the attitude to foster survival and reproduction (Lo2012,2013; Brennan and Lo2011,
2012). A living being is then defined as intelligent if she is driving the world into states she is optimizing for.
No matter how accurately we defined this concept, we can intuitively understand that the level of intelligence machines are provided with today is years far from the average level of any human being. While human being actions proceed from observing the physical world and deriving underlying relationships that link cause and effect in natural phenomena, an artificial intelligence is moved entirely by data and has no prior knowledge of the nature of the relationship among those data. It is then“artificial”in this sense because it does not stem from the physical law but rather from pure data.
We then have just defined what artificial intelligence is and what mean to us. In addition to that, though, there are two other concepts that should be treated as part of this introduction to AI: first of all, how AI is different and/or related to other buzzwords (big data, machine learning, etc.); second, what features a system has to own to be defined intelligent.
I think of AI as an interdisciplinaryfield, which covers (and requires) the study of manifold sub-disciplines, such as natural language processes, computer vision, as well as Internet of things and robotics. Hence, in this respect, AI is an umbrella term that gathers a bucket of different aspects. We can somehow look at AI to be similar to a fully-functional living being, and we can establish comparisons tofigure out the degree of relationship between AI and other (sub)fields. If AI and the human body are alike, it has to possess a brain, which carries out a variety of tasks and is in charge of specific functions such the language (NLP), the sight (computer vision), and so on so forth. The body is made of bones and muscles, as much as a robot is made by circuits and metals. Machine learning can be seen as specific movements, action or thoughts we develop and that wefine-tune by doing. The Internet of things (IoT) corresponds to the human senses, which is the way in which we perceive the world around us. Finally, big data is the equivalent of the food we eat and the air we breathe, i.e., the fuel that makes us tick, as well as every input we receive from the external world that is captured by our senses. It is a quite rough comparison, but it conveys a simple way on how all the terms are related to each other.
Although many other comparisons may be done, and many of them can be correct simultaneously, the choice of what kind of features a system should have to be a proper AI is still quite controversial. In my opinion, the system should be endowed with a learning structure, an interactive communication interface, and a sensorial-like input digestion. Unfortunately, this idea is not rigorous from a sci-entific point of view, because it would involve a series of ethical, psychological, and philosophical considerations that should be taken into account.
Instead of focusing much longer on this not-provable concept, I rather prefer to illustrate how those characteristics would reflect the different types of AI we are (and we will) dealing with. An AI can indeed be classified in three ways: a narrow AI, which is nothing more than a specific domain application or task that gets better by ingesting further data and“learns”how to reduce the output error. An example here is Deep Blue for the chess game, but more generally this group includes all the functional technologies that serve a specific purpose. These systems are usually quite controllable because limited to specific tasks. When a program is instead not programmed for completing a specific task, but it could eventually learn from an application and apply the same bucket of knowledge to different environments, we face an Artificial General Intelligence (AGI). This is nottechnology-as-a-serviceas in the narrow case, but rathertechnology-as-a-product. The best example for this subgroup is Google DeepMind, although it is not a real AGI in all respects. We are indeed not there yet because even DeepMind cannot perform an intellectual task as a human would. In order to get there, much more progress on the brain structure functioning, brain processes optimization, and portable computing power devel-opment have to be made. Someone might think that an AGI can be easily achieved by piling up many narrow AIs, but in fact, this is not true: it is not a matter of number of specific skills a program can carry on, but rather the integration between all those abilities. This type of intelligence does not require an expert to work or to be tuned, as it would be the case for narrow AI, but it has a huge limitation: at the current state, it can be reached only through continuously streaming an infiniteflow of data into the engine.
The final stage is instead called Super intelligent AI (ASI): this intelligence exceeds largely the human one, and it is able of scientific and creative thinking; it is characterized by general common wisdom; it has social skills and maybe an emotional intelligence. Although we often assume this intelligence to be a single super computer, it is more likely that it is going to be made by a network or a swarm of several intelligences.
The way in which we will reach the different stages is though still controversial, and many schools of thoughts exist. The symbolic approach claims that all the knowledge is symbolic and the representation space is limited, so everything should be stated in formal mathematical language. This approach has historically analyzed the complexity of the real world, and it had suffered at the same time from com-putational problems as well as understanding the origination of the knowledge itself. The statistical AI instead focuses on managing the uncertainty in the real world (Domingos et al.2006), which lives in the inference realm contrarily to the more deductive logical AI. On a side then, it is not clear yet to what degree the human brain should be taken as an example: biological neural network seems to provide a great infrastructure for developing an AI, especially regarding the use of sparse distributed representations (SDRs) to process information.
3.2
A Bit of History
In spite of all the current hype, AI is not a newfield of study, but it has its ground in thefifties. If we exclude the pure philosophical reasoning path that goes from the Ancient Greek to Hobbes, Leibniz, and Pascal, AI as we know it has been officially founded in 1956 at Dartmouth College, where the most eminent experts gathered to brainstorm on intelligence simulation. This happened only a few years after Asimov set his own three laws of robotics, but more relevantly after the famous paper published by Turing (1950), where he proposes for the first time the idea of a thinking machine and the more popular Turing test to assess whether such machine shows, in fact, any intelligence. As soon as the research group at Dartmouth publicly released the contents and ideas arisen from that summer meeting, aflow of government funding was reserved for the study of creating an intelligence that was not human.
At that time, AI seemed to be easily reachable, but it turned out that was not the case. At the end of the sixties, researchers realized that AI was indeed a toughfield to manage, and the initial spark that brought the funding started dissipating. This phenomenon, which characterized AI along its all history, is commonly known as “AI effect”, and is made of two parts:first, the constant promise of a real AI coming in the next ten years; and second, the discounting of behavior of AI after it mastered a certain problem, redefining continuously what intelligent means.
In the United States, the reason for DARPA to fund AI research was mainly due to the idea of creating a perfect machine translator, but two consecutive events wrecked that proposal, beginning what it is going to be called later on thefirst AI winter. In fact, the Automatic Language Processing Advisory Committee (ALPAC) report in US in 1966, followed by the “Lighthill report” (1973), assessed the feasibility of AI given the current developments and concluded negatively about the possibility of creating a machine that could learn or be considered intelligent. These two reports, jointly with the limited data available to feed the algorithms, as well as the scarce computational power of the engines of that period, made the field col-lapsing and AI fell into disgrace for the entire decade.
In the eighties, though, a new wave of funding in UK and Japan was motivated by the introduction of“expert systems”, which basically were examples of narrow AI as above defined. These programs were, in fact, able to simulate skills of human experts in specific domains, but this was enough to stimulate the new funding trend. The most active player during those years was the Japanese government, and its rush to create thefifth-generation computer indirectly forced US and UK to rein-state the funding for research on AI.
This golden age did not last long, though, and when the funding goals were not met, a new crisis began. In 1987, personal computers became more powerful than Lisp Machine, which was the product of years of research in AI. This ratified the start of the second AI winter, with the DARPA clearly taking a position against AI and further funding.
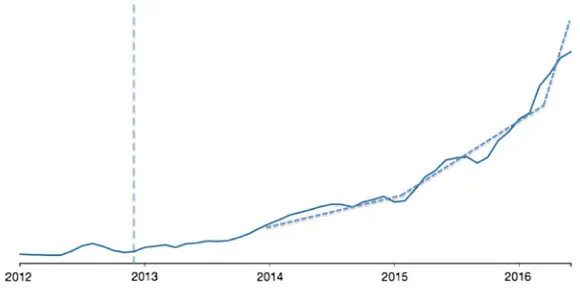
Luckily enough, in 1993 this period ended with the MIT Cog project to build a humanoid robot, and with the Dynamic Analysis and Replanning Tool (DART)— that paid back the US government of the entire funding since 1950—and when in 1997 DeepBlue defeated Kasparov at chess, it was clear that AI was back to the top. In the last two decades, much has been done in academic research, but AI has been only recently recognized as a paradigm shift. There are of course a series of causes that might bring us to understand why we are investing so much into AI nowadays, but there is a specific event we think it is responsible for the lastfive-years trend. If we look at Fig.3.1, we notice that regardless all the developments achieved, AI was not widely recognized until the end of 2012. Thefigure has been indeed created using CB Insights Trends, which basically plots the trends for specific words or themes (in this case, Artificial Intelligence and Machine Learning).
More in details, I draw a line on a specific date I thought to be the real trigger of this new AI optimistic wave, i.e., Dec. 4th 2012. That Tuesday, a group of researchers presented at the Neural Information Processing Systems (NIPS) con-ference detailed information about their convolutional neural networks that granted them thefirst place in the ImageNet Classification competition few weeks before (Krizhevsky et al.2012). Their work improved the classification algorithm from 72 to 85% and set the use of neural networks as fundamental for artificial intelligence. In less than two years, advancements in the field brought classification in the ImageNet contest to reach an accuracy of 96%, slightly higher than the human one (about 95%). The picture shows also three major growth trends in AI development, outlined by three major events: the 3-years-old DeepMind being acquired by Google in Jan. 2014; the open letter of the Future of Life Institute signed by more than 8000 people and the study on reinforcement learning released by Deepmind (Mnih et al.2015) in February 2015; andfinally, the paper published on Nature in Jan. 2016 by DeepMind scientists on neural networks (Silver et al.2016) followed by the impressive victory of AlphaGo over Lee Sedol in March.
Fig. 3.1 Artificial intelligence trend for the period 2012–2016
AI is intrinsically highly dependent on funding because it is a long-term research
field that requires an immeasurable amount of effort and resources to be fully depleted. There are then raising concerns that we might currently live the next peak phase (Dhar 2016), but also that the thrill is destined to stop soon. However, I believe that this new era is different for three main reasons: (i) (big) data, because wefinally have the bulk of data needed to feed the algorithms; (ii) the technological progress, because the storage ability, computational power, better and greater bandwidth, and lower technology costs allowed us to actually make the model digesting the information they needed; and (iii) the resources democratization and efficient allocation introduced by Uber and AirBnb business models, which is reflected in cloud services (i.e., Amazon Web Services) and parallel computing operated by GPUs.
3.3
Why AI Is Relevant Today
The reason why we are studying AI right now more actively is clearly because of the potential applications it might have, because of the media and general public attention it received, as well as because of the incredible amount of funding investors are devoting to it as never before.
Machine learning is being quickly commoditized, and this encourages a more profound democratization of intelligence, although this is true only for low-order knowledge. If from one hand a large bucket of services and tools are now available tofinal users, on the other hand, the real power is concentrating into the hands of few major incumbents with the data availability and computational resources to really exploit AI to a higher level.
Apart from this technological polarization, the main problem the sector is experiencing can be divided into two key branches: first, the misalignments of (i) the long term AGI research sacrificed for the short-term business applications, and (ii) what AI can actually do against what people think or assume it does. Both the issues stem from the high technical knowledge intrinsically required to understand it, but they are creating hype around AI. Part of the hype is clearly justified, because AI has been useful in those processes that are historically hard to be automated because of the requirement of some degree of domain expertise.
Secondly, the tight relationship machine and humans have, and how they interact with each other. We are participating to an enormous cultural shift in the last few years because the human being was originally the creature in charge of acting, while the machine was the security device for unwanted scenarios. However, nowadays the roles have been inverted, and machines are often in charge while the humans are simply monitoring. Even more important, this relationship is changing our own being: people normally believe that machines are making humans more similar to them as humans are trying to do the same with computers, but there are thinkers who judge this cross-pollination as a way for humans to become even more humans (Floridi2014). The only thing that seems to be commonly accepted is that fact that,
in order to shorten the AI adoption cycle, we should learn how to not trust our intuition all the time, and let the machine changing us either in a more human or more mechanical way.
So the natural question everyone is asking is“where machines stand with respect to humans?”Well, the reality is that we are still far from the point in which a superintelligence will exceed human intelligence—the so-called Singularity (Vinge
1993). The famous futurist Raymond Kurzweil proposed in1999the idea of the law of accelerating returns, which envisages an exponential technological rate of change due to falling costs of chips and their increasing computational capacity. In his view, the human progress is S-shaped with inflection points corresponding to the most relevant technological advancements, and thus proceeds by jumps instead of being a smooth and uniform progress. Kurzweil also borrowed Moore’s law to estimate accurately the precise year of the singularity: our brain is able of 1016 calculations per second (cps) and 1013 bits of memory, and assuming Moore’s law to hold, Kurzweil computed we will reach an AGI with those capabilities in 2030, and the singularity in 2045.
I believe though this is a quite optimistic view because the intelligence the machines are provided with nowadays is still only partial. They do not possess any common sense, they do not have any sense of what an object is, they do not have any earlier memory of failed attempts, they are not conscious—the so-called the“Chinese room”argument, i.e., even if a machine can perfectly translate Chinese to English and vice versa, it does not really understand the content of the conversation. On the other side, they solve problems through structured thinking, they have more storage and reliable memory, and raw computational power. Humans instead tried to be more efficient and select ex-ante data that could be relevant (at the risk of losing some important information), they are creative and innovative, and extrapolate essential information better and faster from only a few instances, and they can transfer and apply that knowledge to unknown cases. Humans are better generalists and work better in an unsupervised learning environment. There are easy intuitive tasks almost impossible for computer (what humans do “without thinking”), while number-intensive activities are spectacularly easy for a machine (the“hard-thinking”moments for our brain)—in other words, activities essential for survival that have to be per-formed without effort are easier for human rather than for machines. Part of this has been summarized by Moravec’s paradox with a powerful statement: high-level rea-soning requires little computation, and it is then feasible for a machine as well, while very simple low-level sensorimotor skills would demand a gigantic computational effort.
All the considerations made so far do not end in themselves but are useful to sketch the important design aspects to be taken into account when building an AI engine. In addition to those, few characteristics emerged as fundamental for pro-gressing toward an AGI: robustness, safety, and hybridization. As intended in Russell et al. (2015), an AI has to be verified (acting under formal constraints and conforming to formal specifications); validated (do not pursue unwanted behaviors under the previous constraints); secure (preventing intentional manipulation by third parties, either outside or inside); and controlled (humans should have ways to
reestablish control if needed). Second, it should be safe according to Igor Markov’s view: AI should indeed have key weaknesses; self-replication of software and hardware should be limited; self-repair and self-improvement should be limited; and finally, access to energy should be limited. Last, an AI should be created through a hybrid intelligence paradigm, and this might be implemented following two different paths: letting the computer do the work, and then either calling in humans in for ambiguous situations or calling them to make thefinal call. The main difference is that thefirst case would speed things up putting the machines in charge of deciding (and would use humans as feedback) but it requires high data accuracy. The conclusion of this first section can then be summarized as follows: AI is coming, although not as soon as predicted. This AI spring seems to be different from previous phases of the cycle for a series of reasons, and we should dedicate resources and effort in order to build an AI that would drive us into an optimistic scenario.
References
Bostrom, N. (2014).Superintelligence: Paths, dangers, strategies. Oxford: OUP Oxford. Brennan, T. J., & Lo, A. W. (2011). The origin of behavior.Quarterly Journal of Finance,7,
1043–1050.
Brennan, T. J., & Lo, A. W. (2012). An evolutionary model of bounded rationality and intelligence.PLoS ONE,7(11), e50310.
Dhar, V., (2016). The future of artificial intelligence. InBig data,4(1), 5–9.
Domingos, P., Kok, S., Poon, H., Richardson, M., & Singla, P. (2006). Unifying logical and statistical AI. InProceeding of the 21st National Conference on Artificial Intelligence.(Vol. 1, pp. 2–7).
Floridi, L. (2014).The fourth revolution: How the infosphere is reshaping human reality. Oxford: OUP Oxford.
Krizhevsky, A., Sutskever, I., & Hinton, G. E. (2012). Imagenet classification with deep convolutional neural networks. In Advances in neural information processing systems (pp. 1097–1105).
Kurzweil, R. (1999).The age of spiritual machines: When computers exceed human intelligence. London: Penguin Books.
Lighthill, J. (1973). Artificial intelligence: A general survey. InArtificial intelligence: A paper symposium, Science Research Council.
Lo, A. W. (2012). Adaptive markets and the new world order.Financial Analysts Journal,68(2), 18–29.
Lo, A. W. (2013). The origin of bounded rationality and intelligence. InProceedings of the American Philosophical Society,157(3), 269–280.
Mnih, V., et al. (2015). Human-level control through deep reinforcement learning.Nature,518, 529–533.
Müller, V. C., & Bostrom, N. (2016). Future progress in artificial intelligence: A survey of expert opinion. In V. C. Müller (Ed.), Fundamental issues of artificial intelligence (pp. 553–571). Berlin: Springer.
Russell, S., Dewey, D., & Tegmark, M. (2015). Research priorities for robust and beneficial artificial intelligence.AI Magazine, 36(4), 105–114.
Silver, D., et al. (2016). Mastering the game of go with deep neural networks and tree search. Nature, 529,484–489.
Turing, A. M. (1950). Computing machinery and intelligence.Mind,49, 433–460.
Vinge, V. (1993). The coming technological singularity: How to survive in the post-human era. In NASA. Lewis Research Center,Vision 21: Interdisciplinary science and engineering in the era of cyberspace(pp. 11–22).
Chapter 4
AI Knowledge Map: How to Classify
AI Technologies
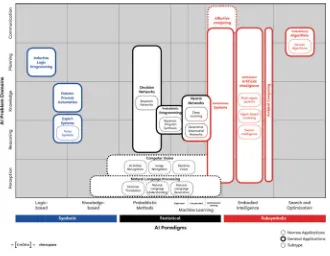
We have seen AI is a broadfield and encompasses multiple type of technologies. The ways in which they could be classified are very different, but in this chapter, we will try to provide a new visual form to capture all the most relevant AI-related technologies.
Working with strategic innovation agency Axilo, we wanted to create avisual tool for people to grasp at a glance the complexity and depthof this toolbox, as well as laying down a map that could help people orientating in the AI jungle. You should look at the following graph as a way toorganize unstructured knowledge into a sort of ontologywith thefinal aim not to accurately represent all the existing information on AI but rather to have a toolto describe and access part of that information set.
What follows in Fig. 4.1is then an effort to draw an architecture to access knowledge on AI and follow emergent dynamics, a gateway on pre-existing knowledge on the topic that will allow you to scout around for additional infor-mation and eventually create new knowledge on AI.
The utility of the final work should therefore help you achieve three things:
making senseof what is going on and have a map to follow the path; understanding
where machine intelligence is used today(with respect to where was not used for in the past); understanding what and how manyproblems are reframedto make possible for AI to tackle them (if you are familiar with the work of Agrawal et al.
2018those are direct consequences of the drop in cost ofprediction technologies). So let’s jump tothe AI Knowledge Map (AIKM)now.
On the axes, you willfind two macro-groups, i.e., the AI Paradigms and the AI Problem Domains. TheAI Paradigms(X-axis) are really the approaches used by
This classification originally appeared on Forbes:https://www.forbes.com/sites/cognitiveworld/ 2018/08/22/ai-knowledge-map-how-to-classify-ai-technologies/#641e430d7773. The AI knowl-edge map was developed with strategic innovation consultancy Axilo, for activities on their Chôra platform.
©Springer Nature Switzerland AG 2019
F. Corea,An Introduction to Data, Studies in Big Data 50,
https://doi.org/10.1007/978-3-030-04468-8_4
AI researchers to solve specific AI-related problems (it does include the approaches we are aware of up to date). On the other side, theAI Problem Domains(Y-axis) are historically the type of problems AI can solve. In some sense, it also indicates the potential capabilities of an AI technology.
Hence, I have identified the following the AI paradigms:
– Logic-based tools: tools that are used for knowledge representation and problem-solving;
– Knowledge-based tools: tools based on ontologies and huge databases of notions, information, and rules;
– Probabilistic methods: tools that allow agents to act in incomplete information scenarios;
– Machine learning: tools that allow computers to learn from data;
– Embodied intelligence: engineering toolbox, which assumes that a body (or at least a partial set of functions such as movement, perception, interaction, and visualization) is required for higher intelligence;
– Search and optimization: tools that allow intelligently searching through many possible solutions.
Those six paradigms also fall into three different macro-approaches, namely Symbolic,Sub-symbolicandStatistical(represented by different colors). Briefly, the
Symbolic approach states that human intelligence could be reduced to symbol
Fig. 4.1 AI knowledge map
manipulation, theSub-symbolicone that no specific representations of knowledge should be provided ex-ante, while the Statistical approach is based on mathe-matical tools to solve specific sub-problems.
A quick additional note: you might hear people talking about “AI tribes”, a concept proposed by Pedro Domingos (2015) that clusters researchers in groups based on the approaches they use to solve problems. You can easily map thosefive tribes with our paradigm classification (not considering the embodied intelligence group), i.e. Symbolists with Logic-based approach (they use logical reasoning based on abstract symbols); Connectionists with Machine learning (they are inspired by the mammalian brain);Evolutionaries with Search and Optimization (they are inspired by the Darwinian evolution); Bayesians with Probabilistic methods (they use probabilistic modeling); and finally Analogizers with Knowledge-based methods, since they try to extrapolate from existing knowledge and previous similar cases.
The vertical axis instead lays down the problems AI has been used for, and the classification here is quite standard:
– Reasoning: the capability to solve problems;
– Knowledge: the ability to represent and understand the world; – Planning: the capability of setting and achieving goals;
– Communication: the ability to understand language and communicate; – Perception: the ability to transform raw sensorial inputs (e.g., images, sounds,
etc.) into usable information.
I am still interrogating myself whether this classification is large enough to capture all the spectrum of problems we are currently facing or whether more instances should be added (e.g.,CreativityorMotion). For the time being though, I will stick with the 5-clusters one.
The patterns of the boxes instead divide the technologies into two groups, i.e.,
narrow applications andgeneral applications. The words used are on purpose slightly misleading but bear with me for one second and I will explain what I meant. For anyone getting started in AI, knowing the difference betweenWeak/Narrow AI (ANI), Strong/General AI (I), and Artificial Super Intelligence (ASI) is paramount. For the sake of clarity, ASI is simply a speculation up to date, General AI is thefinal goal and holy grail of researchers, while narrow AI is what we really have today, i.e., a set of technologies which are unable to cope with anything outside their scope (which is the main difference with AGI).
The two types of lines used in the graph (continuous and dotted) then want to explicitly point to that distinction and make you confident that when you will read some other introductory AI material you won’t be completely lost. However, at the same time, the difference here outlines technologies that can onlysolve a specific task(usually better than humans—Narrowapplications) and others thatcan today or in the future solve multiple tasksand interact with the world (better than many humans—Generalapplications).
Finally, let’s see what there is within the graph itself. In the map, the different classes of AI technologies are represented. Note, I am intentionally not naming specific algorithms but rather clustering them into macro-groups. I am not either providing you with a value assessment of what it works and what it does not, but simply listing what researchers and data scientists can tap into.
So how do you read and interpret the map? Well, let me give you two examples to help you do that. If you look at Natural Language Processing, this embeds a class of algorithms that use a combination of a knowledge-based approach, machine learning and probabilistic methods to solve problems in the domain of perception. At the same time though, if you look at the blank space at the intersection between Logic-based paradigm and Reasoning problems, you might wonder why there are not technologies there. What the map is conveying is not that it does not cate-gorically exist a method that can fill up that space, but rather that when people approach a reasoning problem they rather prefer to use a Machine Learning approach, for instance.
To conclude this explanation, this is the full list of technologies included with their own definitions:
– Robotic Process Automation (RPA): technology that extracts the list of rules and actions to perform by watching the user doing a certain task;
– Expert Systems: a computer program that has hard-coded rules to emulate the human decision-making process. Fuzzy systems are a specific example of rule-based systems that map variables into a continuum of values between 0 and 1, contrary to traditional digital logic which results in a 0/1 outcome;
– Computer Vision (CV): methods to acquire and make sense of digital images (usually divided into activities recognition, images recognition, and machine vision);
– Natural Language Processing (NLP): sub-field that handles natural language data (three main blocks belong to thisfield, i.e.,language understanding, lan-guage generation, andmachine translation);
– Neural Networks (NNs or ANNs): a class of algorithms loosely modeled after the neuronal structure of the human/animal brain that improves its performance without being explicitly instructed on how to do so. The two majors and well-known sub-classes of NNs areDeep Learning(a neural net with multiple layers) and Generative Adversarial Networks (GANs—two networks that train each other);
– Autonomous Systems: sub-field that lies at the intersection between robotics and intelligent systems (e.g., intelligent perception, dexterous object manipu-lation, plan-based robot control, etc.);
– Distributed Artificial Intelligence (DAI): a class of technologies that solve problems by distributing them to autonomous “agents”that interact with each other. Multi-agent systems (MAS), Agent-based modeling (ABM), and
Swarm Intelligence are three useful specifications of this subset, where col-lective behaviors emerge from the interaction of decentralized self-organized agents;