Advances in Intelligent Systems and Computing
392
Paul Chung
Andrea Soltoggio
Christian W. Dawson
Qinggang Meng
Matthew Pain
Editors
Proceedings of the
10th International
Symposium on
Advances in Intelligent Systems and Computing
Volume 392
Series editor
About this Series
The series“Advances in Intelligent Systems and Computing”contains publications on theory, applications, and design methods of Intelligent Systems and Intelligent Computing. Virtually all disciplines such as engineering, natural sciences, computer and information science, ICT, economics, business, e-commerce, environment, healthcare, life science are covered. The list of topics spans all the areas of modern intelligent systems and computing.
The publications within“Advances in Intelligent Systems and Computing”are primarily textbooks and proceedings of important conferences, symposia and congresses. They cover significant recent developments in thefield, both of a foundational and applicable character. An important characteristic feature of the series is the short publication time and world-wide distribution. This permits a rapid and broad dissemination of research results.
Advisory Board
Chairman
Nikhil R. Pal, Indian Statistical Institute, Kolkata, India e-mail: [email protected]
Members
Rafael Bello, Universidad Central“Marta Abreu”de Las Villas, Santa Clara, Cuba e-mail: [email protected]
Emilio S. Corchado, University of Salamanca, Salamanca, Spain e-mail: [email protected]
Hani Hagras, University of Essex, Colchester, UK e-mail: [email protected]
LászlóT. Kóczy, Széchenyi István University, Győr, Hungary e-mail: [email protected]
Vladik Kreinovich, University of Texas at El Paso, El Paso, USA e-mail: [email protected]
Chin-Teng Lin, National Chiao Tung University, Hsinchu, Taiwan e-mail: [email protected]
Jie Lu, University of Technology, Sydney, Australia e-mail: [email protected]
Patricia Melin, Tijuana Institute of Technology, Tijuana, Mexico e-mail: [email protected]
Nadia Nedjah, State University of Rio de Janeiro, Rio de Janeiro, Brazil e-mail: [email protected]
Ngoc Thanh Nguyen, Wroclaw University of Technology, Wroclaw, Poland e-mail: [email protected]
Jun Wang, The Chinese University of Hong Kong, Shatin, Hong Kong e-mail: [email protected]
Paul Chung
•Andrea Soltoggio
Christian W. Dawson
•Qinggang Meng
Matthew Pain
Editors
Proceedings of the 10th
International Symposium
on Computer Science
in Sports (ISCSS)
Editors Advances in Intelligent Systems and Computing
ISBN 978-3-319-24558-4 ISBN 978-3-319-24560-7 (eBook) DOI 10.1007/978-3-319-24560-7
Library of Congress Control Number: 2015950434 Springer Cham Heidelberg New York Dordrecht London ©Springer International Publishing Switzerland 2016
This work is subject to copyright. All rights are reserved by the Publisher, whether the whole or part of the material is concerned, specifically the rights of translation, reprinting, reuse of illustrations, recitation, broadcasting, reproduction on microfilms or in any other physical way, and transmission or information storage and retrieval, electronic adaptation, computer software, or by similar or dissimilar methodology now known or hereafter developed.
The use of general descriptive names, registered names, trademarks, service marks, etc. in this publication does not imply, even in the absence of a specific statement, that such names are exempt from the relevant protective laws and regulations and therefore free for general use.
The publisher, the authors and the editors are safe to assume that the advice and information in this book are believed to be true and accurate at the date of publication. Neither the publisher nor the authors or the editors give a warranty, express or implied, with respect to the material contained herein or for any errors or omissions that may have been made.
Printed on acid-free paper
Preface
The 10th International Symposium of Computer Science in Sport (IACSS/ISCSS 2015), sponsored by the International Association of Computer Science in Sport and in collaboration with the International Society of Sport Psychology (ISSP), took place between September 9–11, 2015 at Loughborough, UK. Similar to pre-vious symposia, this symposium aimed to build the links between computer science and sport, and report on results from applying computer science techniques to address a wide number of problems in sport and exercise sciences. It provided a good platform and opportunity for researchers in both computer science and sport to understand and discuss ideas and promote cross-disciplinary research.
This year the symposium covered the following topics: • Modelling and Analysis
• Artificial Intelligence in Sport • Virtual Reality in Sport • Neural Cognitive Training • IT Systems for Sport • Sensing Technologies • Image Processing
We received 39 submitted papers and all of them underwent strict reviews by the Program Committee. Authors of the thirty-three accepted papers were asked to revise their papers carefully according to the detailed comments so that they all meet the expected high quality of an international conference. After the conference selected papers will also be invited to be extended for inclusion in the IACSS journal.
Three keynote speakers and authors of the accepted papers presented their contributions in the above topics during the 3-day event. The arranged tour gave the participants an opportunity to see the Loughborough University campus, and facilities in the National Centre for Sport and Exercise Medicine and the Sports Technology Institute.
We thank all the participants for coming to Loughborough and hope you had enjoyed the event. We also thank the Program Committee members, the reviewers and the invited speakers for their contributions to make the event a success.
Paul Chung, General Chair Qinggang Meng, Program Chair Matthew Pain, Program Co-Chair
Programme Committee
Ali Arya, Canada Arnold Baca, Austria Firat Batmaz, UK Maurizio Bertollo, Italy Bettina Bläsing, Germany James Cochran, USA Chris Dawson, UK Eran Edirisinghe, UK Hayri Ertan, Turkey Kai Essig, Germany Shaheen Fatima, UK Daniel Fong, UK Cornelia Frank, Germany Iwan Griffiths, UK Ben Halkon, UK
Dan Witzner Hansen, Danemark Mark Jones, UK
Larry Katz, Canada Rajesh Kumar, India Martin Lames, Germany William Land, USA Heiko Lex, Germany Baihua Li, UK Keith Lyons, Australia Andres Newball, Colombia Jürgen Perl, Germany Edmond Prakash, UK Hock Soon Seah, Singapore
Thomas Schack, Germany Didier Seyfried, France Michael Stöckl, Austria Martin Sykora, UK Josef Wiemeyer, Germany Kerstin Witte, Germany Hui Zhang, China
External Reviewers
Mickael Begon, Canada Glen Blenkinsop, UK Graham Caldwell, USA John Challis, USA Simon Choppin, UK Cathy Craig, UK
Peter Dabnichki, Australia Zac Domire, USA Paul Downward, UK Hayri Ertan, Turkey
Pablo Fernandez-De-Dios, UK Sofia Fonseca, Portugal Steph Forrester, UK Ian Heazlewood, Australia Ben Heller, UK
Nic James, UK Mark King, UK Axel Knicker, Germany Jon Knight, UK Daniel Link, Germany Zhen Liu, China Antonio Lopes, Portugal Daniel Memmert, Germany Toney Monnet, France Peter O’Donoghue, UK Kevin Oldham, UK Leser Roland, Austria Dietmar Saupe, Germany Andrea Soltoggio, UK Grant Trewartha, UK Brian Umberger, USA
Jos Vanrenterghem, UK Tomi Vänttinen, Finland Sam Winter, UK Helmut Wöllik, Austria Jiachen Yang, China Fred Yeadon, UK Erika Zemkova, Slovakia
Invited Keynote Speakers
• Prof. Arnold Baca, University of Vienna, Austria • Dr. Michael Hiley, Loughborough University, UK • Prof. Thomas Schack, Bielefeld University, Germany
Contents
Part I Image Processing in Sport
Non-Invasive Performance Measurement in Combat Sports. . . 3 Soudeh Kasiri Behendi, Stuart Morgan and Clinton B. Fookes
Comparison Between Marker-Less Kinect-Based and Conventional 2D Motion Analysis System on Vertical Jump Kinematic Properties
Measured From Sagittal View . . . 11 Shariman Ismail, Effirah Osman, Norasrudin Sulaiman and Rahmat
Adnan
Test of Ball Speed in Table Tennis Based on Monocular Camera . . . . 19 Hui Zhang, Ling-hui Kong, Ye-peng Guan and Jin-ju Hu
Table Tennis and Computer Vision: A Monocular Event Classifier. . . 29 Kevin M. Oldham, Paul W. H. Chung, Eran A. Edirisinghe
and Ben. J. Halkon
3D Reconstruction of Ball Trajectory From a Single Camera
in the Ball Game. . . 33 Lejun Shen, Qing Liu, Lin Li and Haipeng Yue
Part II It System for Sport
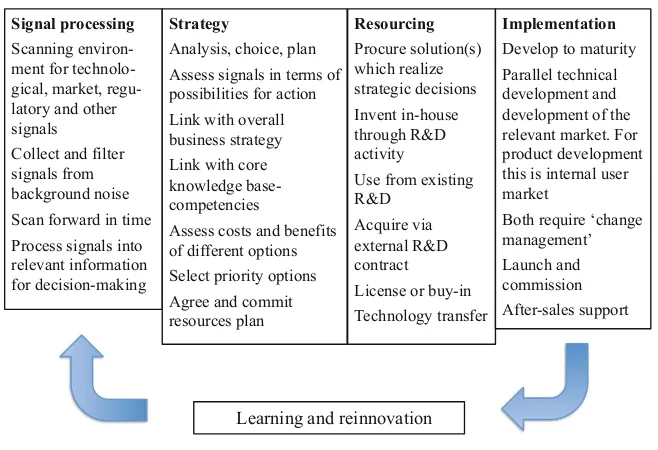
Towards a Management Theory for the Introduction
of IT Innovations in Top Level Sports . . . 43 Mina Ghorbani and Martin Lames
Information Systems for Top Level Football. . . 51 Thomas Blobel and Martin Lames
Frame by Frame Playback on the Internet Video . . . 59 Chikara Miyaji
Part III Ai in Sport
Computational System for Strategy Design and Match Simulation
in Team Sports. . . 69 Leonardo Lamas, Guilherme Otranto and Junior Barrera
Soccer Analyses by Means of Artificial Neural Networks, Automatic Pass Recognition and Voronoi-Cells: An Approach of Measuring
Tactical Success. . . 77 Jürgen Perl and Daniel Memmert
An Interval Type-2 Fuzzy Logic Based Classification Model for Testing Single-Leg Balance Performance of Athletes
After Knee Surgery. . . 85 Owais Ahmed Malik and S.M.N. Arosha Senanayake
A Comparison of Classification Accuracy for Gender Using Neural Networks Multilayer Perceptron (MLP), Radial Basis Function (RBF) Procedures Compared to Discriminant Function Analysis and Logistic Regression Based on Nine Sports Psychological Constructs to Measure Motivations
to Participate in Masters Sports Competing at the 2009
World Masters Games. . . 93 Ian Heazlewood, Joe Walsh, Mike Climstein, Jyrki Kettunen,
Kent Adams and Mark DeBeliso
Detection of Individual Ball Possession in Soccer. . . 103 Martin Hoernig, Daniel Link, Michael Herrmann, Bernd Radig
and Martin Lames
Towards Better Measurability—IMU-Based Feature Extractors
For Motion Performance Evaluation . . . 109 Heike Brock and Yuji Ohgi
Part IV Modelling and Analysis
The Aikido Inspiration to Safety and Effciency:
An Investigation on Forward Roll Impact Forces . . . 119 Andrea Soltoggio, Bettina Bläsing, Alessandro Moscatelli
and Thomas Schack
To Evaluate the Relative Influence of Coefficient
of Friction on the Motion of a Golf Ball (Speed and Roll)
During a Golf Putt . . . 129 Iwan Griffiths, Rory Mckenzie, Hywel Stredwick
and Paul Hurrion
Modelling the Tactical Difficulty of Passes in Soccer. . . 139 Michael Stöckl, Dinis Cruz and Ricardo Duarte
Convergence and Divergence of Performances Across
the Athletic Events for Men and Women: A Cross-Sectional Study
1960–2012. . . 145 Ian Heazlewood and Joe Walsh
Introduction of the Relative Activity Index: Towards a Fair Method to Score School Children’s Activity
Using Smartphones . . . 153 Emanuel Preuschl, Martin Tampier, Tobias Schermer
and Arnold Baca
Performance Analysis in Goalball: Semiautomatic Specific Software
Tools. . . 157 Christoph Weber and Daniel Link
Markov Simulation by Numerical Derivation in Table Tennis. . . 161 Sebastian Wenninger and Martin Lames
Prediction and Control of the Individual Heart Rate Response
in Exergames . . . 171 Katrin Hoffmann, Josef Wiemeyer and Sandro Hardy
Evaluation of Changes in Space Control Due to Passing Behavior
in Elite Soccer Using Voronoi-Cells . . . 179 Robert Rein, Dominik Raabe, Jürgen Perl and Daniel Memmert
What is the Best Fitting Function? Evaluation of Lactate Curves
with Common Methods From the Literature. . . 185 Stefan Endler, Christian Secker and Jörg Bügner
Computer Analysis of Bobsleigh Team Push. . . 193 Peter Dabnichki
Part V Virtual Reality
Development of a Novel Immersive Interactive Virtual Reality
Cricket Simulator for Cricket Batting. . . 203 Aishwar Dhawan, Alan Cummins, Wayne Spratford, Joost C. Dessing
and Cathy Craig
Multi-Level Analysis of Motor Actions as a Basis for Effective
Coaching in Virtual Reality. . . 211 Felix Hülsmann, Corneli Frank, Thomas Schack, Stefan Kopp and
Mario Botsch
Part VI Sensing Technology
Evaluating the Indoor Football Tracking Accuracy
of a Radio-Based Real-Time Locating System. . . 217 Thomas Seidl, Matthias Völker, Nicolas Witt, Dino Poimann, Titus
Czyz, Norbert Franke and Matthias Lochmann
Stance Phase Detection for Walking and Running
Using an IMU Periodicity-based Approach. . . 225 Yang Zhao, Markus Brahms, David Gerhard and John Barden
Gamification of Exercise and Fitness Using Wearable
Activity Trackers. . . 233 Zhao Zhao, S. Ali Etemad and Ali Arya
Part VII Neural Cognitive Training
Training of Spatial Competencies by Means
of Gesture-controlled Sports Games. . . 243 Aleksandra Dominiak and Josef Wiemeyer
Methods to Assess Mental Rotation and Motor Imagery. . . 251 Melanie Dietz and Josef Wiemeyer
Self-Regulated Multimedia Learning in Sport Science
Concepts and a Field Study. . . 259 Josef Wiemeyer and Bernhard Schmitz
Author Index . . . 267
Non-Invasive Performance Measurement in
Combat Sports
Soudeh Kasiri Behendi1, Stuart Morgan2, and Clinton B. Fookes1
1 Queensland University of Technology, Brisbane, Australia 2 Australian Institute of Sport, Canberra, Australia
Abstract. Computer vision offers a growing capacity to detect and clas-sify actions in a large range of sports. Since combat sports are highly dynamic and physically demanding, it is difficult to measure features of performance from competition in a safe and practical way. Also, coaches frequently wish to measure the performance characteristics of other com-petitors. For these reasons it is desirable to be able to measure features of competitive performance without using sensors or physical devices. We present a non-invasive method for extracting pose and features of behaviour in boxing using vision cameras and time of flight sensors. We demonstrate that body parts can be reliably located, which allow punch-ing actions to be detected. Those data can then visualised in a way that allows coaches to analysis behaviour.
1
Introduction
Recent advances in computer vision have enabled many examples of non-invasive measurement of performance in the sports domain including player position tracking [12, 10], and action recognition [14, 1]. Some work has also demonstrated action recognition in challenging conditions such as the aquatic environment in swimming [18, 19]. Broadly, the aim in much of the work for computer vision has been to measure features of performance without the use of invasive tracking devices or sensors. This can be described as non-invasive performance measure-ment. The historical alternative to non-invasive performance measurement (ex-cluding the use of sensors or tracking devices) has been notational analysis, such that the analyst manually notates events from a competition using some prede-fined scheme of events and actions (See [9]). Human notational analysis, however, is notoriously vulnerable to errors such as inconsistent interpretation of event labels. Further, the manual nature of most notational analysis methods makes large-scale analyses difficult to implement. Additionally, for some dynamic and high-impact sports such as boxing, it could be dangerous for participants to wear devices of any type due to the potential risk of injury. Therefore non-invasive methods for reliable and accurate performance analysis are highly desirable.
Time of flight (ToF) sensors are a modern tool used in a range of computer vision and robotics applications where depth information is a desirable addi-tion or replacement for convenaddi-tional RGB cameras. Depth data has been widely
ÓSpringer International Publishing Switzerland 2016 3
used in gesture and action recognition [2–4, 17]. While computer vision has en-abled many novel and exciting insights into sports performance, there are other instances where vision alone is insufficient for extract meaningful performance features, and in those instance 3D data may provide a practical solution. For instance Behendi et.al., attempted to classify punching types in boxing using overhead depth imagery [11]. In that work, punches were classified by six basic actions, straight, hook anduppercut (each forrear and lead hand). The direc-tion of a boxer’s forearm movement and the elbow angle were key features to determine punch types, and boxers usually throw uppercut punches from a lower initial glove position compared to hook or straight punches. Since it was not pos-sible to differentiate between different glove positions from overhead vision alone (as illustrated in Figure 1), the main motivation for using depth data in that study was to exploit differences in the depth values of the forearm to classify uppercut punches.
(a) Lead Uppercut (b) Lead Hook
Fig. 1: Visual similarities between hook and uppercut punches [11].
Sports analytics research in boxing is limited, and remains a difficult problem due to the high speed of action, and occlusions in the visibility of performance features from most viewing angles. Most examples of performance analysis or activity profiling in boxing rely on slow-motion review of video footage (e.g.[5, 6]). Some efforts, such as ”Box-Tag” have been made to automate scoring in boxing, which can provide additional insight to coaches about certain features of performance [7, 8]. Additionally, Morita et al [16] described a system to dif-ferentiate between punches based on gyroscopic signals providing insight on the offensive patterns of boxers.
However, despite these innovations, there are additional features of perfor-mance that are not easily extracted with existing methods. For instance, the relative position of boxers in the ring may be of significant interest to coaches, but there are no existing, non-invasive positioning methods for available for box-ing. Also, the vertical movements of a boxer might be used to infer features of performance such as fatigue. Since there are no existing methods for estimating the ”bouncing” of a boxer in competition, new solutions are required.
In this paper we propose a combat sports video analysis framework and demonstrate a method for extracting specific performance features in boxing using overhead depth imagery.
2
Methods
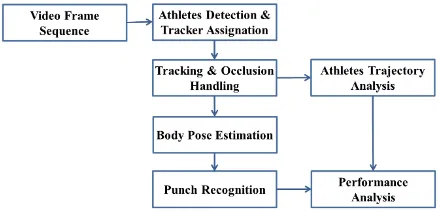
The general framework of the method is given in Figure 2. In this framework athletes are tracked to obtain their trajectories and analyse their movement. In the first frame, athletes are detected and trackers are assigned. Detected athletes are represented by their contour and head position. Contour tracking is used to handle partial occlusion between athletes. Finally, athletes trajectories are obtained and mapped on the ring canvas for further analysis. These stages are further described in the following sections.
Fig. 2: Combat-sport movement analysis framework.
2.1 Depth Sensor
A MESA Imaging SwissRanger (SR4000) ToF sensor was used to measure ac-tivities in the boxing ring. The device was mounted approximately 6 meters above the level of the canvas ring surface. The SR4000 device generates a point cloud with a 176(h)×144(w) pixel resolution, a functional range of 10 meters, and a 69×55◦FOV. The maximum sampling rate is 50 f.p.s. The output from the device consists of a 3×176×144 element array for calibrated distances in 3-dimensional cartesian coordinates. Viewed from above, a representation of cal-ibrated distance values corresponding to a vision camera (mounted in tandem) is shown in Figure 3.
(a) Coordinate System (b) Machine Vision (c) Depth Image
Fig. 3: Swissranger SR-4000 Coordinate System (Courtesy Mesa Imaging AG), Machine Vision Image and Matching Depth Image.
2.2 Athlete Detection
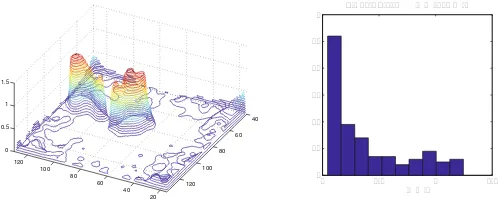
This section describes the process of detecting boxers from overhead depth data. Previous research using overhead depth data leverages the shape of the head and shoulders for finding head candidates[13]. However, low resolution overhead data from ToF can make detecting the those features difficult especially when their hands are closed. A histogram of the depth data is obtained to extract the boxing canvas depth level and depth values are translated based on the obtained ring depth level. A precise contour of the boxer’s form is obtained using the normalised histogram of foreground contours at different depth levels (Fig. 4). Detecting boxers head position can be challenging since boxers frequently lean
20
Fig. 4: Depth level contours and histogram of contour elements.
to different angles, such that the visible shape of head varies. However, detecting the posterior location of a boxer’s neck in overhead images is more reliable. A 2D chamfer distance of a boxer contour is obtained to estimate the boxer’s neck position. The properties of a boxer’s contour can be ”fuzzified” by assigning a continuous probabilistic range to the boundary state, as opposed to a discrete binary state. The neck position of the boxer is selected using the product t-norm of fuzzified values of the candidate boxer’s contour chamfer distance and depth value [11],
wherezis the normalized depth value, andDchis the chamfer distance computed over the detected boxer contour.
2.3 Tracking and Occlusion Handling
Once candidate boxers have been detected in first frame, they can then be tracked over consecutive frames to obtain a continuous movement trajectory.
Boxers are non-rigid objects and occlude each other frequently (Fig. 5). The boxers’ head and shoulders are relatively stable features and provide continuity of position over successive frames such that contour tracking can be used to obtain boxers trajectories. Contour tracking handles topological changes, such as merging and splitting of object regions. When occlusion occurs, the contours of the athletes are merged. At the end of the occlusion, the group contour is split and each athlete is tracked individually. The main problem in an occlusion situation is identifying each boxer and determining their positions after the oc-clusion. Although boxers occlude each other and their contours are merged, it is usually partial occlusion from overhead view. Regional maxima of thefz·fd for the merged contours are obtained and neck positions are estimated, which is illustrated in Fig. 5. Detected heads in occluded contour are shown by red and pink points in Fig. 5(e).
Robust position tracklets can then be derived using the calibrated x-y po-sition coordinate system provided by the raw data files. Tracking data is then retained in the form of frame-based rows, each consisting of X, Y, Z cartesian coordinates where the origin is at the canvas level in the approximate centre of the ring.
(a)
(b) (c)
(d) (e)
Fig. 5: Intermediate results of boxers detection: (a) the depth 3d mesh, (b) con-tour of the merged boxers, (c)fd, (d)fz, and (e)fz·fd.
2.4 Athletes Movement Analysis
Performance Analysts for combat sports are frequently interested in physical proximity of two boxers, and the extent to which they each move in and out of an effective striking range. Using the position estimates extracted using the methods described above the momentary distance between the boxers can be derived as a 3-D Euclidean distance using:
dt(p, q) =
3
i=1
(pi−qi)2 (2)
Local point values can be visualised for coaching purposes using a bespoke interactive visualisation tool developed using OpenGL at the Australian Institute of Sport [15]. Exemplar results are shown in Figure 6.
Fig. 6: Tracking and Inter-boxer distance estimates derived from position track-ing.
3
Results
We evaluated our method using a sequence of depth arrays taken at the Aus-tralian Institute of Sport from boxing sparring. A time series of the inter-boxer distance can be calculated for greater understanding of the fluctuations in prox-imity between boxers as a function of various actions and behaviours (Figure 7a). In this instance the raw distance estimates are smoothed using the Tukey’s (Run-ning Median) Smoothing function: smooth{stats}, in R (version 3.2.0). Similarly, the vertical oscillations of two boxers in sparring may be related to evidence of physical fatigue. As such performance analysts are interested in monitoring the amount of ”bouncing” that occurs over time in a bout. These data can be simply extracted as time series data from the calibrated z-axis, and an exemplar is show in Figure 7b. Discrete estimates of the degree of vertical oscillations could be further derived using measures of dispersion over a sample, or to analyse the data in the frequency domain.
4
Conclusions
Computer vision is becoming increasingly important in sports analytics as a non-invasive method for extracting the occurrence of actions in competition, and for understanding the features of sports performance without impacting on the performance environment with physical motion sensors. Boxing and combat sports represent a particularly challenging domain for action recognition with vision, and demonstrate a method for extracting features of performance using ToF sensors. Our results demonstrate that it is possible to track multiple boxers in a sparring contest, and to extract additional features including punch types, ring position, vertical movement, and the inter-boxer distance. Future work will aim to integrate previous punch classification work with athlete positioning to demonstrate a unified performance analysis system.
0 200 400 600 800
0.6
1.0
1.4
1.8
time
interbo
x
erdistance
(a) Time series analysis of exemplar inter-boxer distances in sparring.
(b) Time series analysis of exemplar vertical oscillations for two boxers.
Fig. 7: Performance feature extractions from boxer head/neck tracking.
5
Acknowledgments
The authors gratefully acknowledge the support from the Australian Institute of Sport Combat Centre, and in particular from Emily Dunn, Michael Maloney, Clare Humberstone, and David T Martin.
References
1. Agarwal, A., Triggs, B.: Recovering 3D human pose from monocular images. Pat-tern Analysis and Machine Intelligence, IEEE Transactions on 28(1), 44–58 (Jan 2006)
2. Aggarwal, J., Xia, L.: Human activity recognition from 3d data: A review. Pattern Recognition Letters (2014)
3. Baak, A., M ˜AŒller, M., et al.: A data-driven approach for real-time full body pose reconstruction from a depth camera. In: Consumer Depth Cameras for Computer Vision, pp. 71–98. Springer (2013)
4. Chen, L., Wei, H., Ferryman, J.: A survey of human motion analysis using depth imagery. Pattern Recognition Letters 34(15), 1995 – 2006 (2013), smart Approaches for Human Action Recognition
5. Davis, P., Benson, P., Waldock, R., Connorton, A.: Performance analysis of elite female amateur boxers and comparison to their male counterparts. International journal of sports physiology and performance (2015)
6. Davis, P., Benson, P.R., Pitty, J.D., Connorton, A.J., Waldock, R.: The activity profile of elite male amateur boxing. International journal of sports physiology and performance (10), 53–57 (2015)
7. Hahn, A., Helmer, R., Kelly, T., Partridge, K., Krajewski, A., Blanchonette, I., Barker, J., Bruch, H., Brydon, M., Hooke, N., et al.: Development of an automated scoring system for amateur boxing. Procedia Engineering 2(2), 3095–3101 (2010) 8. Helmer, R., Hahn, A., Staynes, L., Denning, R., Krajewski, A., Blanchonette, I.:
Design and development of interactive textiles for impact detection and use with an automated boxing scoring system. Procedia Engineering 2(2), 3065–3070 (2010) 9. Hughes, M., Franks, I.M.: Notational analysis of sport: Systems for better coaching
and performance in sport. Psychology Press (2004)
10. Kasiri-Bidhendi, S., Safabakhsh, R.: Effective tracking of the players and ball in indoor soccer games in the presence of occlusion. In: 14th International CSI Com-puter Conference. pp. 524–529. IEEE (2009)
11. Kasiri-Bidhendi, S., Fookes, C., Morgan, S., Martin, D.T.: Combat sports analytics: Boxing punch classification using overhead depth imagery. In: Image Processing (ICIP), 2015 IEEE International Conference on (2015)
12. Liu, J., Carr, P., Collins, R.T., Liu, Y.: Tracking sports players with context-conditioned motion models. In: Computer Vision and Pattern Recognition (CVPR), 2013 IEEE Conference on. pp. 1830–1837. IEEE (2013)
13. Migniot, C., Ababsa, F.: 3d human tracking in a top view using depth information recorded by the xtion pro-live camera. In: Advances in Visual Computing, pp. 603–612. Springer (2013)
14. Moeslund, T.B., Hilton, A., Kr¨uger, V.: A survey of advances in vision-based human motion capture and analysis. Computer vision and image understanding 104(2), 90–126 (2006)
15. Morgan, S.: 3dviewkit, openGL software application; Australian Institute of Sport. 16. Morita, M., Watanabe, K., et al.: Boxing punch analysis using 3D gyro sensor. In: SICE Annual Conference (SICE), 2011 Proceedings of. pp. 1125–1127 (Sept 2011) 17. Munaro, M., Basso, A., Fossati, A., Van Gool, L., Menegatti, E.: 3d reconstruction of freely moving persons for re-identification with a depth sensor. In: Robotics and Automation (ICRA), 2014 IEEE International Conference on. pp. 4512–4519 (May 2014)
18. Sha, L., Lucey, P., Morgan, S., Pease, D., Sridharan, S.: Swimmer localization from a moving camera. In: Digital Image Computing: Techniques and Applications (DICTA), 2013 International Conference on. pp. 1–8. IEEE (2013)
19. Sha, L., Lucey, P., Sridharan, S., Morgan, S., Pease, D.: Understanding and analyz-ing a large collection of archived swimmanalyz-ing videos. In: Applications of Computer Vision (WACV), 2014 IEEE Winter Conference on. pp. 674–681. IEEE (2014)
Comparison between Marker-less Kinect-based and
Conventional 2D Motion Analysis System on Vertical
Jump Kinematic Properties Measured from Sagittal View
Shariman Ismadi Ismail*, Effirah Osman, Norasrudin Sulaiman, Rahmat Adnan
Faculty of Sports Science & Recreation, Universiti Teknologi MARA, 40450 Shah Alam, Selangor, Malaysia
Abstract. Marker-less motion analysis system is the future for sports motion study. This is because it can potentially be applied in real time competitive matches because no marking system is required. The purpose of this study is to observe the suitability and practicality of one of the basic marker-less motion analysis system applications on human movement from sagittal view plane. In this study, the movement of upper and lower extremities of the human body during a vertical jump act was chosen as the movement to be observed. One skilled volleyball player was recruited to perform multiple trials of the vertical jump (n=90). All trials were recorded by one depth camera and one Full HD video camera. The kinematics of shoulder joint was chosen to represent the up-per body extremity movement while knee joint was chosen as the representative of the lower body extremity movement during the vertical jump’s initial posi-tion to take-off posiposi-tion (IP-TP) and take-off posiposi-tion to highest posiposi-tion (TP-HP). Results collected from depth camera-based marker less motion analysis system were then compared with results obtained from a conventional video-based 2-D motion analysis system. Results indicated that there were significant differences between the two analysis methods in measuring the kinematic prop-erties in both lower (knee joint) and upper (shoulder joint) extremity body movements (p < .05). It was also found that a lower correlation between these two analysis methods was more obvious for the knee joint movement [38.61% matched, r = 0.12 (IP-TP) and r =0.01 (TP-HP)] compared to the shoulder joint movement [61.40% matched, r =0.10 (IP-TP) and r =0.11 (TP-HP)].
Keywords: Motion analysis, marker less, depth camera, vertical jump
1
Introduction
The capture technique of human movement is one of the crucial parts recently used by biomechanics to study the musculoskeletal movement and is also being used by phys-iologists to diagnose an injury problem. According to Krosshaug et al (2007), analysis of human motion is very useful in establishing injury risks through joint position
[email protected] / [email protected]
ÓSpringer International Publishing Switzerland 2016
P. Chung et al. (eds.),Proceedings of the 10th International Symposium on Computer Science in Sports (ISCSS), Advances in Intelligent Systems and Computing 392, DOI 10.1007/978-3-319-24560-7_2
measurement and orientation of body segments, as well as analyzing the technique in sports (Lees, 2002). Thus, it is important to obtain the robustness and accuracy of the results in order to detect every single motion involved in particular human move-ments.
There are several approaches recommended for use as simple setup tools in order to obtain stable, accurate, and real-time motion capturing performances. The marker-based system tool has been proven to be suitable for in-vitro (laboratory marker-based) stud-ies where the subject has to wear an obstructive device, a marker which is more com-plicated, hard to maintain, and even quite expensive. Although the application de-mands to use these tools have increased during a real-time competitive sporting event, but it is difficult for athletes to do their normal routines with the marker placed on their body (Wheat, Fleming, Burton, Penders, Choppin, & Heller, 2012; Zhang, Sturm, Cremers, & Lee, 2012).
The marker-less based system tools have come out with attractive solutions to solve problems associated with marker-based system tools. Microsoft launched the low cost marker-less camera-based Kinetics which originally was used for Xbox 360 gaming, with the capability for tracking the users’ body segment positions and 3D orientations in real situations. These cameras require minimal calibration by standing in a specific position only for a few seconds with no marker required on the body. However, this tool also has their own limitations resulting in low accuracy and less supported on motions with high speed (Choppin & Wheat, 2012). With a lower price compared to other depth camera, these cameras are only capable of capturing 30 frames per second. It means that these cameras have the capability only for capturing certain basic motions or movements like walking or jumping, rather than fast move-ments (Corazza et al., 2006; Zhang et al., 2012).
Therefore, this study was designed to observe the suitability and practicality of depth camera applications in vertical jump focusing on upper and lower extremity body movements when located at the sagittal plane with respect to the movement.
2
Method
2.1 Subject
One skilled amateur volleyball player (age 24 years, height 178 cm, weight 75 kg with 10 years of competitive volleyball playing experience) was recruited to partici-pate in this study. Consent from the subject and approval from the research ethics committee from the research organization was obtained before the study was conduct-ed.
2.2 Instrumentation
One depth camera (Microsoft’s Kinect) and one Full HD video camera (Sony-60 FPS) were utilized in this study. The depth camera has the capability of depth data capture at 30FPS with a resolution of 640 x 480 pixels. It is capable of tracking various types of joint angles. Depth Biomechanics by Sheffield Hallam University (Depth Biome-chanics, 2015) was the software utilized in this study to process the data captured by the depth camera. KINOVEA software (v. 0.8.15) (Kinovea, 2015) was used to ana-lyze the video. Two units of reflective markers (d=14mm) were located at the right side of the subject’s shoulder and knee joint. Subject was asked to perform warm up and stretching exercises for 5 to 10 minutes prior to performing the jump. All cameras were set at the sagittal view of the subject’s body, as shown in Fig. 1. Typical calibra-tion of the depth camera (front view calibracalibra-tion) was performed before the recording took place.
Fig. 1. Instrumentation setup (Top View)
2.3 Data collection and processing
In this study, the shoulder joint was chosen as a representative of upper body extremi-ty, while the knee joint represents the lower body extremity. From these two major parts, each part consists of two different types of phases to be analyzed, which include initial position to take-off phase (IP-TP), and take-off position to the highest phase (TP-HP), as shown in Fig. 2.
Fig. 2. Vertical Jump phases used to measure displacement
According to Adams and Beam (2008), proper jumping maneuver for the vertical jump was 3 trials with about 20 – 30 s of recovery between trials. Each of these 3 trials is considered as 1 set of jumps. Throughout this study, the subject performs 35 sets of jumps. Between each set, the subject will rest between 1-3 minutes. From all trials recorded, 90 trials were selected for further analysis.
Synchronization of the frame rate between the video camera-based and depth cam-era-based data were required prior to data analysis. In order to synchronize it, the time frame and joint displacement obtained from the video analysis by Kinovea were con-verted to coordinate system, to make it similar to the output obtained from Depth Biomechanics. This study tends to evaluate the two methods of analysis at its most optimum setting. Therefore the video camera was set at full high definition resolution (1920 x1080) with 60 FPS. Since the data from the depth camera was 30 FPS (resolu-tion at 640 x 480), therefore the time-frame rate need to be adjusted for both sources to be in-sync before the results were analyzed. Finite forward difference method was utilized in order to calculate the joint displacement based on the coordinates obtained from both depth and video cameras. Independent t-test was used to compare data from the two methods of analysis. Lastly, correlation analysis was performed to observe how strong the results between the two methods of analysis were similar.
3
Results and Discussion
The result of the study showed that there were significant differences between the two methods analyzed in all jumping phases (Table 1). It was also found that a lower cor-relation between these two analysis methods were more obvious for the knee joint
14 S.I. Ismail et al.
movement [r= 0.12 (IP-TP) and r=0.01 (TP-HP)] compared to the shoulder joint movement [r=0.10 (IP-TP) and r=0.11 (TP-HP)]. This result can be explained based on the differences in speed in each of the phases. Although it was not shown here, but the speed of TP-HP was faster than the movements during the IP-TP phases. It is also worthwhile mentioning that based on point-to-point data comparison in each trial, the data for knee joint displacement (lower body movement) only achieved 38.61% matching results and the data from the shoulder joint displacement (upper body movement) achieved 61.40% matching results when compared between the two types of analysis methods.
Microsoft Kinect depth camera has its own limitation resulting in low accuracy and less support on motions with high speed (Choppin & Wheat, 2012). With a lower price than the other depth cameras, these cameras have capabilities only for capturing certain basic motions or movements like walking or jumping, rather than fast move-ments (Corazza et al., 2006; Zhang et al., 2012). This study shows that the accuracy level reduces when the depth camera measures a higher speed motion.
These types of depth camera with capturing capabilities of 30 frames per second at 640 x 480 resolutions are more accurate when used at the frontal plane. In gaming situations, the upper extremity is used more frequently rather than the lower extremi-ty. Also, the camera is typically located in the frontal view, and not from the sagittal view. The calibration procedure was also only based on frontal view calibration and not the sagittal view.
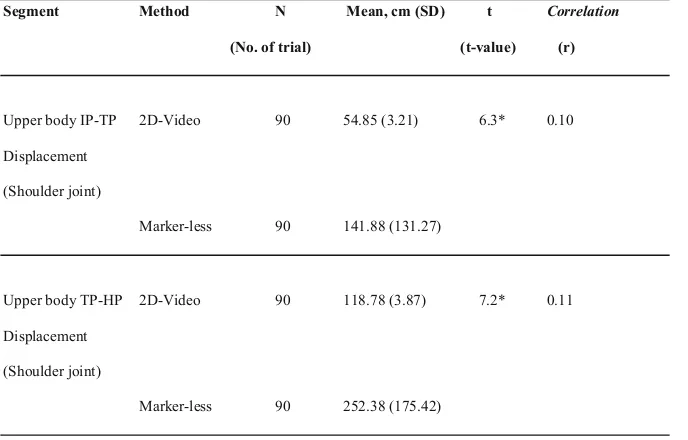
Table 1. Comparison of Displacement Measurement between 2D Video-based and Marker-less Motion Analysis.
Segment Method N Mean, cm (SD) t Correlation
(No. of trial) (t-value) (r)
Upper body IP-TP 2D-Video 90 54.85 (3.21) 6.3* 0.10
Displacement
(Shoulder joint)
Marker-less 90 141.88 (131.27)
Upper body TP-HP 2D-Video 90 118.78 (3.87) 7.2* 0.11
Displacement
(Shoulder joint)
Marker-less 90 252.38 (175.42)
Lower body IP-TP 2D-Video 90 24.00 (5.65) 3.5* 0.12
Displacement
(Knee joint)
Marker-less 90 62.42 (104.80)
Lower body TP-HP 2D-Video 90 74.39 (16.48) 6.4* 0.01
Displacement
(Knee joint)
Marker-less 90 196.23 (179.79)
*Mean values between the two method are significantly different (p < 0.05)
If a depth camera is to be utilized from sagittal view in a motion analysis involving rapid movement, a higher specification of the camera in terms of the frame rate should be considered. There must also be a calibration procedure involving sagittal view. However, further studies are still needed to suggest that a higher frame rate and additional calibration steps could improve data captured from other viewing angles or planes, beside the frontal view. Also, the resolution of the camera could also be a factor that influenced accuracy. A depth camera with a higher resolution, higher than 640x480, might provide an improvement to the marker-less motion analysis method.
4
Conclusion
From this study, it can be concluded that video-based analysis and depth camera-based analysis have significant differences on the upper extremity and lower extremi-ty towards the vertical jump motion, when captured from the sagittal view. In terms of accuracy between the upper body and the lower body based analysis by the Microsoft Kinect depth camera, the upper body was slightly more accurate than the lower body. A depth camera with 30 FPS was less suitable when capturing fast movements, espe-cially from the sagittal view plane. It would be interesting to note whether these types of tools can come out with high level of accuracy towards other movements such as kicking or throwing if the frame rate was to be improved. In order to get higher accu-racy, it is recommended that 2 or more Microsoft Kinect depth cameras be used to detect the full capturing angles; frontal plane and sagittal planes. By using more than one depth camera, the validity of the 3D data capturing ability can be observed from different viewpoints.
Acknowledgment
This work was supported by the Malaysian Ministry of Education’s Sports Grant (Geran Sukan KPT) [100-RMI/GOV 16/6/2 (3/2014) ]
References
1. Krosshaug, T., Slauterbeck, J. R., Engebretsen, L., & Bahr, R. (2007). Biomechanical analysis of anterior cruciate ligament injury mechanisms: Three-dimensional motion reconstruction from video sequences. Scandinavian Journal of Medicine & Science in Sports, 17(5), 508-519. doi: 10.1111/j.1600-0838.2006.00558.x
2. Lees, A. (2002). Technique analysis in sports: A critical review. Journal of Sports Sciences, 20(10), 813-828. doi: 10.1080/026404102320675657
3. Wheat, J., Fleming, R., Burton, M., Penders, J., Choppin, S., & Heller, B. (2012). Establishing the accuracy and feasibility of microsoft kinect in various multidisciplinary contexts. EFL Kinect: Project Report.
4. Zhang, L., Sturm, J., Cremers, D., & Lee, D. (2012). Real-time human motion tracking
us-ing multiple depth cameras Retrieved from
https://www.zotero.org/groups/3d_mapping_with_kinect/items/itemKey/AMEVV4XS 5. Choppin, S., & Wheat, J. (2012). Marker-less tracking of human movement using
microsoft kinect. Paper presented at the 30th Anual Conference of Biomechanics in Sports. 6. Corazza, S., Mundermann, L., Chaudhari, A. M., Demattio, T., Cobelli, C., & Andriacchi, T. P. (2006). A markerless motion capture system to study musculoskeletal biomechanics: Visual hull and simulated annealing approach. Annals of Biomedical Engineering,, 34(6), 1019–1029. doi: 10.1007/s10439-006-9122-8
7. Depth Biomechanics manual.2015.
http://www.depthbiomechanics.co.uk/?s=manual (Acessed 2015-07-07)
8. KINOVEA manual.2015.
http://www.kinovea.org/help/en/index.htm (Accessed 2015-07-07)
9. Adams, G. M., & Beam, W. C. (2008). Maximal oxygen consumption. In C. Johnson (Ed.), Exercise physiology laboratory manual (5th ed., pp. 149-168). New York: McGraw-Hill.
Test of ball speed in table tennis
based on monocular camera
Hui Zhang1, Ling-hui Kong2, Ye-peng Guan3 and Jin-ju Hu4
1 Sport Science Department, College of Education, Zhejiang University, Hangzhou 310028,
China
2China Table Tennis College, Shanghai University of Sport, Shanghai 200438, China 3School of Communication & Information Engineering, Shanghai University, Shanghai
200444, China
4School of Sport Journalism and Foreign Studies, Shanghai University of Sport, Shanghai
200438, China
Abstract: This paper has designed and developed a platform for testing table tennis ball speed, which are used in the tests of 5 top Chinese female table ten-nis players in three of their practices. The results show that the ball speeds of LI and DING are faster than those of LIU, ZHU and CHEN. LI’s ball speed over the net is the fastest in all exercises, especially in forehand loop-drive against backspin and forehand moving loop-drive. DING’s ball speed over the net is the second-fastest in different practices (except for forehand loop-drive in the Two to One practice). LIU, ZHU and CHEN’s ball speeds are slower, among which, the relatively slower ball speeds over the net were LIU’s backhand loop-drive in the Two to One practice, ZHU’s forehand loop-drive in the Two to One exer-cise and in the forehand loop-drive against backspin, and CHEN’s forehand moving loop-drive.
Key words: Table tennis, loop-drive, ball speed over the net, ball speed re-bounded from the table
1
Introduction
Speed and spin are the two most important properties in table tennis sport. WU and QIN et al (1988) have conducted tests on table tennis spins using their self-developed testing instrument. SUN and YU et al (2008), through solving the math models of table tennis sport, have analyzed the moving path of loop-drives and their general rules of movement in different circumstances. FANG (2003), JIANG and LI et al (2008), FANF and ZHANG et al (2011) and YANG and YUAN et al (2014), through table tennis simulation, have conducted researches on table tennis collision process, flying path and bouncing features. However, due to technical reasons, the testing methods on spins and speeds accomplished in the lab, or the researches on the flying path and bouncing speed based on simulation cannot be widely used in real life prac-tice. Hence, the present research has designed and developed a platform for testing the
ÓSpringer International Publishing Switzerland 2016
P. Chung et al. (eds.),Proceedings of the 10th International Symposium on Computer Science in Sports (ISCSS), Advances in Intelligent Systems and Computing 392, DOI 10.1007/978-3-319-24560-7_3
ball speed of table tennis players using the monocular camera, which has already been put into practice in female elite table tennis players.
2
Methods
2.1 Participants
The five top players from Chinese national women team (Xiao-xia LI, Ning DING, Shi-wen LIU, Yu-ling ZHU and Meng CHEN, all world champions) participated in this test during the assembled training session.
2.2 Testing method of ball speed
Table-Camera mapping relation
The location of each point in the flat surface of the camera image is related to the its geometric position of the correspondent object in the three dimensional space. In oth-er words, the spacial location of a three-dimensional object is closely correspondent to its planimetric position in the two-dimensional image. The correspondent relation is determined by the geometric model of the camera. Therefore, based on the differences between the physical features of the three dimensional table and its background im-age, the visual features can be obtained of the edges of the table and the net, and the mapping model can be constructed of the three dimensional table and the planimetric camera imaging.
Determining the parameters of camera imaging
»
Among them, s is the arbitrary number except 0; u, v are the respective pixel coor-dinate of the three dimensional points mapped onto the camera plane; mi (i=1, 2,…,
12) are the camera projection matrix; X, Y, Z are the respective world coordinate of the three dimensional space points.
Using four or the above mentioned three-dimensional points (X, Y, Z) on the table tennis platform and their correspondent pixels in the camera plane imaging㸦u, v㸧 and based on singular value equation, determine the geometrical parameter during the camera plane imaging mi (i=1, 2,…, 12).
Based on the constructed mapping model of the three dimensional table and the pla-nimetric camera imaging, the image coordinate system, camera coordinate system and the world coordinate system concerned with the parameters involved in camera imag-ing have the followimag-ing relationship:
Extraction of table tennis visual features
Due to the complicated and changeable background and circumstances in table tennis training and competition venues, and also because of the uncontrollable and unpre-dictable outer environmental factors㸦lights, people in and out), the venue back-ground needs to be self adaptively updated. Since players in the foreback-ground have higher range of movement features, and any of the observed moving targets in the foreground can be reflected in the changes of sequence of scene images, therefore, the pixel range of the adjacent foreground targets can be obtained. If the differences be-tween the obtained adjacent objects exceed certain range, it shows that the back-ground has changed and needs to be self updated.
Based on the self-adaptively updated background, using methods of multi-scale wavelet and particle dynamics, the moving video objects are segmented and the table tennis foreground objects are extracted from the video pictures. Then according to the color ratio invariance property of table tennis foreground object, the ghost shadows extracted from balls’ flying path are suppressed, which has overcome many defects in the current segmentation methods of foreground moving objects in videos, such as defects of manual correction or human judgment, priori hypothesis, as well as the sensitivity towards dynamic scenes and noise interventions.
Table tennis ball three dimensional coordinates
Based on the extracted table tennis ball visual features, the visual pixel points are extracted about the table tennis balls in the up, down, left and right edges. And ac-cording to the geometrical parameters mi (i=1,2,…12) established during the camera
plane imaging and the geometrical invariance nature in the camera plane imaging, eight linear equations are established with formula (1). With the least square methods, the three dimensional coordinates (X, Y, Z) are to be calculated of the table tennis ball central points.
Establishment of table tennis ball speed/accelerated speed
And the ball’s three dimensional coordinates established in different video times, the flying distance of the ball is calculated, and then its flying speed as well as its acceler-ated speed, according to the camera video frame rate established by camera encoding and decoding.
2.3 Experiment
The experiment was conducted at the second-floor training hall in the Chengdu Table Tennis Athletic School (National Table Tennis Training Base) during March 10 and April 20, 2014. The tests were done in the second, seventh and tenth units of the as-sembled training session. The whole training process of the five players on the three training items were recorded and used for analysis with the specially developed table tennis software. And the real time speed was captured of the ball over the net when the players stroke.
Test contents
In order to reflect the real life striking speed of the players, the coach group of the national women table tennis teams had serious discussions and finally decided on the following three training items for testing:
1.Two to One method: It refers to the strategy that two practice team members train together with one tested player. The practice team member strikes the ball to the full court of the tested player and the tested player strikes back with forehand or backhand loop-drive.
2.Forehand loop-drive against backspin: It refers to the practice that one coach serves backspin ball (multi-ball practice), and the tested player strikes back with forehand loop-drive in full court.
3.Forehand moving loop-drive: It refers to the strategy that the one practice team member strikes the ball to the forehand, mid-route and backhand of the tested play-er, and the tested player strikes back with forehand loop-drives.
Test method and data processing.
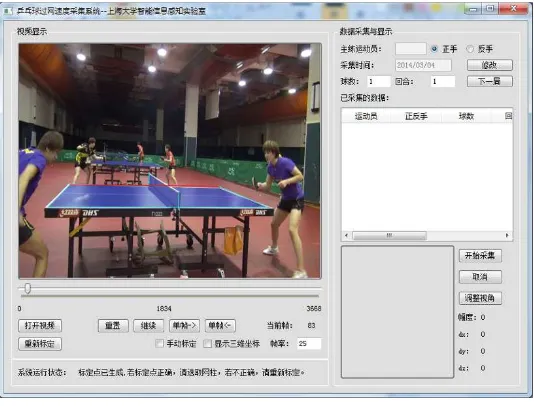
The complete training period of the above five players were recorded and analyzed using the special table tennis software, and the instant speed is obtained when the ball crossed the net. The ball speed analysis is done on the experimental platform which catches and stores the ball speeds when crossing the net and bouncing after crossing the net. The platform is developed by the intellectual information sensory lab of Shanghai University under the environment of VC++2010, which can be operated in Window 7 system with 32 units (Figure 1).
Fig. 1. The platform of table tennis ball speed testing
3
Results
3.1 General features of striking speed of top female players
The general features of the ball speed after striking of top female players are shown in table 1. Among all the tests on each training item, the net crossing speed and bounc-ing speed after crossbounc-ing the net are the quickest with the forehand loop-drive against backspin, 12.245 m/s and 10.966 m/s respectively. The forehand moving loop-drive comes the second, 11.589 m/s and 10.316 m/s each. And the third comes with the forehand loop-drive in the Two to One practice, with the speed of 9.049 m/s and 7.968 m/s respectively. In the forehand loop-drive against backspin practice, the play-ers have enough time adjusting their positions, so they can take the time driving and pulling powerfully, and hence resulting in the quickest net crossing speed and bounc-ing speed after crossbounc-ing the net.
Table 1. Data on General features of ball speed of elite female players’ striking
N Ball speed over the net (m/s)
Mean Sd. Min. Max.
Two to One method
(fore-hand loop-drive) 829 10.675 2.134 3.755 16.705
Two to One method
(backhand loop-drive) 1147 9.049 1.470 3.552 14.498
Forehand loop-drive
against backspin 822 12.245 1.763 5.938 18.118
Forehand moving
loop-drive: 2010 11.589 1.598 4.831 16.559
N Ball speed rebounded from the table (m/s)
Mean Sd. Min. Max.
Two to One method
(fore-hand loop-drive) 829 9.473 2.051 2.534 14.825
Two to One method
(backhand loop-drive) 1147 7.968 1.454 3.109 13.512
Forehand loop-drive
against backspin 822 10.966 1.759 5.773 17.650
Forehand moving
loop-drive: 2010 10.316 1.660 3.549 14.957
according to the placement, speed, spin of the coming ball. This is why there is such great difference.
Besides, because the forehand striking in table tennis belongs to the open skill and the backhand striking the closed skill, the backswing and power with the forehand would be better than the backhand. Therefore, both the net-crossing speed and the after-net bouncing speed of the forehand loop-drives are faster than those of backhand loop-drives. On the other hand, the stability of the closed technique is better than the open technique, so the standard deviation of net-crossing speed and the after-net bouncing speed of the backhand drives is smaller than that of the forehand loop-drive.
3.2 Comparison of ball speed of forehand loop-drive in the Two to One practice
Table 2. Data on ball speed of forehand loop-drive in the Two to One practice
N Ball speed over the net (m/s)
Mean Sd. Min. Max.
LI 216 10.911 2.064 4.063 15.152
DING 136 10.534 2.023 5.260 15.143
LIU 165 10.728 1.324 6.630 13.477
ZHU 186 10.349 2.975 3.755 16.705
CHEN 126 10.834 1.646 6.613 14.571
N Ball speed rebounded from the table (m/s)
Mean Sd. Min. Max.
LI 216 9.567 2.031 3.307 14.825
DING 136 9.598 1.932 4.072 14.141
LIU 165 9.475 1.468 6.273 12.809
ZHU 186 9.170 2.738 2.534 13.992
CHEN 126 9.623 1.623 6.257 13.282
The net-crossing speed with forehand loop-drives in the Two to One practice ranks as this: LI > CHEN > LIU > DING > ZHU, while the ranking of the after-net bouncing speed goes as: CHEN > DING > LI > LIU > ZHU (Table 2). The inconsistency of the rankings between the net-crossing speed and the after-net bouncing speed may be resulted from the spinning of the loops. The present research didn’t monitor over the ball spinning speed of the players, therefore, the reason for this phenomenon cannot be fully explained. But the statistical test proves that the above differences have no significance (F=2.106, P>0.05).
3.3 Comparison of ball speed of backhand loop-drive in the Two to One practice
Table 3. Data on ball speed of backhand loop-drive in the Two to One practice
N Ball speed over the net (m/s)
Mean Sd. Min. Max.
LI 292 9.391 1.667 3.552 13.799
DING 195 9.310 1.217 5.544 13.104
LIU 282 8.607 1.257 4.611 11.691
ZHU 190 9.043 1.878 3.754 14.498
CHEN 188 8.913 0.906 5.451 11.033
N Ball speed rebounded from the table (m/s)
Mean Sd. Min. Max.
LI 292 8.098 1.701 3.178 12.526
DING 195 8.269 1.281 4.052 13.033
LIU 282 7.602 1.154 3.934 11.093
ZHU 190 7.977 1.792 3.109 13.512
CHEN 188 7.996 1.091 4.665 10.655
3.4 Comparison of ball speed in forehand loop-drive against backspin practice
The net-crossing speed and the after-net bouncing speed with forehand loop-drive against backspin are showed in table 4. The net-crossing speed of CHEN, LIU and ZHU is obviously slower than that of DING and LI (F=28.577㸪P<0.01), showing very significant differences. Their after-net bouncing speed is also obviously slower than that of DING and LI. Besides, DING’s ball speed is clearly slower than that of LI, also showing very significant differences (F=31.561㸪P<0.01).
Table 4. Data on ball speed in forehand loop-drive against backspin practice
N Ball speed over the net (m/s)
Mean Sd. Min. Max.
LI 152 13.202 1.820 5.938 16.651
DING 154 12.832 1.329 9.009 15.701
LIU 137 11.695 1.500 6.969 15.004
ZHU 185 11.645 1.925 6.440 17.416
CHEN 194 11.987 1.578 8.150 18.118
N Ball speed rebounded from the table (m/s)
Mean Sd. Min. Max.
LI 152 11.988 1.640 5.773 15.589
LIU 137 10.482 1.381 6.495 14.084
ZHU 185 10.268 1.710 6.135 14557
CHEN 194 10.729 1.763 6.024 17.650
3.5 Comparison of ball speeds in forehand moving loop-drive practice
Table 5 shows the net-crossing speed and the after-net bouncing speed of LI are the fastest in the forehand moving loop-drive practice. Among them, the net-crossing speed and the after-net bouncing speed of CHEN, LIU and ZHU are obviously slower than those of DING and LI, and the net-crossing speed and the after-net bouncing speed of DING are also clearly slower than that of LI (F=26.626㸪P<0.01㸹
F=25.481㸪P<0.01) showing very significant differences.
Table 5. Data on ball speed in forehand moving loop-drive practice
N Ball speed over the net (m/s)
Mean Sd. Min. Max.
LI 318 12.262 1.859 5.167 16.559
DING 396 11.825 1.784 5.365 15.711
LIU 512 11.394 1.341 4.831 14.312
ZHU 449 11.456 1.399 6.733 14.547
CHEN 335 11.148 1.469 6.362 14.544
N Ball speed rebounded from the table (m/s)
Mean Sd. Min. Max.
LI 318 11.020 2.067 4.073 14.957
DING 396 10.469 1.652 5.186 13.994
LIU 512 10.188 1.456 3.549 12.550
ZHU 449 10.166 1.427 5.600 13.084
CHEN 335 9.830 1.590 4.506 13.297
4
Conclusion
The platform designed and developed in this paper for measuring table tennis ball speeds can be conveniently used in elite players training. In the above five top play-ers, the ball speeds of LI and DING are faster than those of LIU and ZHU and CHEN. LI ranks No. 1 in ball speed in all training practices, especially in her forehand loop-drive against backspin and moving loop-loop-drive practice. Ding ranks the second in the net-crossing speed in all practices except with the forehand loop-drive in the Two to One practice. LIU, ZHU and CHEN had relatively slower ball speeds. Among them, LIU had slower net-crossing speed with her backhand loop-drive in the Two to One practice; ZHU had slower net-crossing speed with her forehand loop-drive in the Two
to One practice and forehand loop-drive against backspin; while CHEN was slower in her forehand moving loop-drive practice.
References
1. Fang, J. (2003). Research on Table Tennis Collision Using the Simulation Model of the Computer. Journal of TJIPE, 18(3): 47-49.
2. Fang, J., Zhang, H., & Yang, J. (2011). Establishment of Simulation System on Throwing Service of Table Tennis. Journal of Capital Institute of Physical Education, 23(2): 188-192.
3. Jiang, F., Li, X., & Xu, Q. (2008). Flight Simulation of Table Tennis Ball. Journal of Qufu Normal University. 34(1): 104-106.
4. Su, Z., Yu, G., Guo, M., Zhu, L., Yang, J., & He, Z. (2008). Aerodynamic Principles of Table Tennis Loop and Numerical Analysis of Its Flying Route. China Sport Science, 28(4):69-71.
5. Wu, H., Qin, Z., Xu, S., & Xi, E. (1988). Experimental Research in Table Tennis Spins. China Sports Science, 8(4): 26-32.
6. Yang, C., Yuan, Z., & Liang, Z. (2014). Simulation of Dynamic Characteristics of Table Tennis Rebound. Computer Simulation, 31(10): 281-285.
Table tennis and computer vision:
a monocular event classifier
Kevin M. Oldham1, Paul W. H. Chung1, Eran A. Edirisinghe1, Ben. J. Halkon2
1Department of Computer Science, 2Wolfson School of Mechanical and Manufacturing Engineering, Loughborough University, Loughborough, LE11 3TU. United Kingdom.
Abstract. Detecting events in table tennis using monocular video sequences for match-play officiating is challenging. Here a low-cost monocular video instal-lation generates image sequences and, using the Horn-Schunck Optical Flow algorithm, ball detection and location processing captures sudden changes in the ball’s motion. It is demonstrated that each abrupt change corresponds to a dis-tinct event pattern described by its combined velocity, acceleration and bearing. Component motion threshold values are determined from the analysis of a range of table tennis event video sequences. The novel event classifier reviews change in motion data against these thresholds, for use in a rules based officiat-ing decision support system. Experimental results usofficiat-ing this method demon-strate an event classification success rate of 95.9%.
Keywords. Event classification, table tennis, ball, segmentation, detection, computer vision, optical flow.
1
Introduction
Use of computer vision (CV) to support umpire officiating exists in sports with high investments and global audiences, such as football and tennis [1]. It is less popular in low investment sports, or those in which the sophisticated installation requirements are too complex for the environment. One example here is table tennis. Yet the high speed nature of table tennis makes umpire decisions complex and one in which CV would bring benefits. Reducing the data input requirements to a monocular device and interrogating the 2-dimension (2D) ball location coordinates produces sufficient information to detect key match-play events. The limitations of 2D positional data have been mitigated by careful positioning of the video camera [2] and the proposed approach for event analysis is to consider only changes in ball motion.
Building on work for event classification using 2D motion in snooker [3], it is pro-posed that key events in table tennis are given a formal definition based on expected changes in motion combined with their pre and post event states stored in a finite-state machine (FSM). Motion is analysed using a running mean of velocity, accelera-tion and bearing. It is suggested that the combinaaccelera-tion of these three characteristics is sufficient for the creation of semantic information required for distinct event identifi-cation. This paper provides evidence of the results of such event detection when
ap-ÓSpringer International Publishing Switzerland 2016
P. Chung et al. (eds.),Proceedings of the 10th International Symposium on Computer Science in Sports (ISCSS), Advances in Intelligent Systems and Computing 392, DOI 10.1007/978-3-319-24560-7_4
plied to the data from video sequences, using the Optical Flow (Horn-Schunck) CV algorithm [4]. Results indicate a high degree of success (95.9%) for event detection using a monocular recording.
2
The proposed classifier
A continuous assessment of sudden changes in motion triggers an event state check. If the ball’s motion matches that of the event description in the FSM then a message is sent to the event engine for evaluation and event state update. To classify events in table tennis, it is proposed that an event is detected by reviewing changes in velocity, acceleration and bearing. The mean ball motion components of velocity, acceleration and bearing are calculated. The temporal motion is compared to the running average of its component motion. If the resulting comparison exceeds the threshold, a confir-mation check is triggered followed by the event classification. Upon successful event detection, running averages are reset and the outputs of the previous event become the inputs of the new event. Any missing frame data is not included in the running aver-age, therefore the mean is unaffected by occlusions or non-detection.
2.1 Event states
For this proposal an event is defined as a significant change in table tennis ball motion from its predicted path, which affects game statistics, scoring or officiating decisions. Only one event can occupy the state of the game at any one time. Any given event can only be preceded and succeeded by a subset of events, as defined by the rules of the game and predictable motion of the ball. Each event, therefore, has a unique defi-nition of both changes in temporal motion data and the preceding and succeeding events. Rule checking is implicit; the predictable sequence of events determines which subsequent event(s) can be valid. If the rule based sequence is broken then the event is a ‘fault’ and the score (if recorded) is updated. Twenty four distinct event components have been identified for table tennis and these events are grouped into seven top-level events (i.e. table bounce, return, net/let, net/collision, service hit, table edge and over the net), each having specific event motion characteristics.
2.2 Event motion thresholds
A description of the combinations of component motion dynamics has been made. These descriptions are placed in the FSM together with valid pre and post event states. The sensitivity of the motion detector must be calibrated to filter motion changes which are not caused by an event. Experimental observations from a range of sequences for each event resulted in a set of distinctive motion change thresholds for each event. The mean measurement of expected minimum change (%) in motion for velocity (min¨v), acceleration (min¨a) and bearing (min¨b) for each top-level event has been calculated (Table 1).
Table 1. Event threshold values
As these are the minimum values detected during the experiments for the available sample size, an assumption is made that this sample size is sufficient to provide accu-rate motion threshold values. As motion tends to the limit, detection becomes re-stricted by available hardware. A number of events require no threshold value in the event test (for example, over-the-net). Instead, these events use current ball location data combined with knowledge of the preceding events in the sequence.
3
Classification results
A summary of the results of the novel classifier is presented in Table 2. Where events occur in both left-to-right and right-to-left play directions (such as a return) the results have been combined.
Table 2. Summary of classification results
Event Sample size
%Success Occlusions %Success without occlusions
The results show a promising application of 2D based CV processing to event classi-fication with an overall success rate of 95.9%. The majority of failures occur when the ball, during a return and service1, is partially occluded by either the player or racket, when using a monocular recording device. Removing occlusion sequences from the ‘return’ and ‘service hit’ events improves success rates for both to 95% (giv-ing a total success rate for event detection of 98.8%). As Wong [5] notes in his as-sessment of ball occlusion during a service ‘the view of the ball is blocked and rule
1 There is also the occlusion caused when the ball strikes the edge of the table opposite the
camera. This is a relatively rare event, and can be easily mitigated by a second camera op-posite the first, if considered a requirement.