Scalable Big Data
Architecture
A practitioner’s guide to choosing relevant
big data architecture
—
Scalable Big Data
Architecture
A Practitioner’s Guide to Choosing
Relevant Big Data Architecture
Copyright © 2016 by Bahaaldine Azarmi
This work is subject to copyright. All rights are reserved by the Publisher, whether the whole or part of the material is concerned, specifically the rights of translation, reprinting, reuse of illustrations, recitation, broadcasting, reproduction on microfilms or in any other physical way, and transmission or information storage and retrieval, electronic adaptation, computer software, or by similar or dissimilar methodology now known or hereafter developed. Exempted from this legal reservation are brief excerpts in connection with reviews or scholarly analysis or material supplied specifically for the purpose of being entered and executed on a computer system, for exclusive use by the purchaser of the work. Duplication of this publication or parts thereof is permitted only under the provisions of the Copyright Law of the Publisher’s location, in its current version, and permission for use must always be obtained from Springer. Permissions for use may be obtained through RightsLink at the Copyright Clearance Center. Violations are liable to prosecution under the respective Copyright Law.
ISBN-13 (pbk): 978-1-4842-1327-8
ISBN-13 (electronic): 978-1-4842-1326-1
Trademarked names, logos, and images may appear in this book. Rather than use a trademark symbol with every occurrence of a trademarked name, logo, or image we use the names, logos, and images only in an editorial fashion and to the benefit of the trademark owner, with no intention of infringement of the trademark.
The use in this publication of trade names, trademarks, service marks, and similar terms, even if they are not identified as such, is not to be taken as an expression of opinion as to whether or not they are subject to proprietary rights.
While the advice and information in this book are believed to be true and accurate at the date of publication, neither the authors nor the editors nor the publisher can accept any legal responsibility for any errors or omissions that may be made. The publisher makes no warranty, express or implied, with respect to the material contained herein.
Managing Director: Welmoed Spahr Lead Editor: Celestin Suresh John Development Editor: Douglas Pundick
Technical Reviewers: Sundar Rajan Raman and Manoj Patil
Editorial Board: Steve Anglin, Pramila Balen, Louise Corrigan, Jim DeWolf, Jonathan Gennick, Robert Hutchinson, Celestin Suresh John, Michelle Lowman, James Markham, Susan McDermott, Matthew Moodie, Jeffrey Pepper, Douglas Pundick, Ben Renow-Clarke, Gwenan Spearing
Coordinating Editor: Jill Balzano
Copy Editors: Rebecca Rider, Laura Lawrie, and Kim Wimpsett Compositor: SPi Global
Indexer: SPi Global Artist: SPi Global
Cover Designer: Anna Ishchenko
Distributed to the book trade worldwide by Springer Science+Business Media New York, 233 Spring Street, 6th Floor, New York, NY 10013. Phone 1-800-SPRINGER, fax (201) 348-4505,
e-mail [email protected], or visit www.springeronline.com. Apress Media, LLC is a California LLC and the sole member (owner) is Springer Science + Business Media Finance Inc (SSBM Finance Inc). SSBM Finance Inc is a Delaware corporation.
For information on translations, please e-mail [email protected], or visit www.apress.com.
Contents at a Glance
About the Author ...
xi
About the Technical Reviewers ...
xiii
■
Chapter 1: The Big (Data) Problem ...
1
■
Chapter 2: Early Big Data with NoSQL ...
17
■
Chapter 3: Defining the Processing Topology ...
41
■
Chapter 4: Streaming Data ...
57
■
Chapter 5: Querying and Analyzing Patterns ...
81
■
Chapter 6: Learning From Your Data? ...
105
■
Chapter 7: Governance Considerations ...
123
Contents
About the Author ...
xi
About the Technical Reviewers ...
xiii
■
Chapter 1: The Big (Data) Problem ...
1
Identifying Big Data Symptoms ...
1
Size Matters ...
1
Typical Business Use Cases ...
2
Understanding the Big Data Project’s Ecosystem ...
3
Hadoop Distribution ...
3
Data Acquisition ...
6
Processing Language ...
7
Machine Learning ...
10
NoSQL Stores ...
10
Creating the Foundation of a Long-Term Big Data Architecture ...
12
Architecture Overview ...
12
Log Ingestion Application ...
13
Learning Application ...
13
Processing Engine ...
14
Search Engine...
15
■
Chapter 2: Early Big Data with NoSQL ...
17
NoSQL Landscape ...
17
Key/Value ...
17
Column ...
18
Document ...
18
Graph ...
19
NoSQL in Our Use Case ...
20
Introducing Couchbase ...
21
Architecture ...
22
Cluster Manager and Administration Console ...
24
Managing Documents ...
28
Introducing ElasticSearch ...
30
Architecture ...
30
Monitoring ElasticSearch ...
34
Search with ElasticSearch ...
36
Using NoSQL as a Cache in a SQL-based Architecture ...
38
Caching Document ...
38
ElasticSearch Plug-in for Couchbase with Couchbase XDCR ...
40
ElasticSearch Only ...
40
Summary ...
40
■
Chapter 3: Defining the Processing Topology ...
41
First Approach to Data Architecture ...
41
A Little Bit of Background ...
41
Dealing with the Data Sources ...
42
Processing the Data...
45
Splitting the Architecture...
49
Batch Processing ...
50
Stream Processing ...
52
■
Chapter 4: Streaming Data ...
57
Streaming Architecture ...
57
Architecture Diagram...
57
Technologies ...
58
The Anatomy of the Ingested Data ...
60
Clickstream Data ...
60
The Raw Data ...
62
The Log Generator ...
63
Setting Up the Streaming Architecture ...
64
Shipping the Logs in Apache Kafka ...
64
Draining the Logs from Apache Kafka ...
72
Summary ...
79
■
Chapter 5: Querying and Analyzing Patterns ...
81
Definining an Analytics Strategy ...
81
Continuous Processing ...
81
Real-Time Querying ...
82
Process and Index Data Using Spark ...
82
Preparing the Spark Project ...
82
Understanding a Basic Spark Application ...
84
Implementing the Spark Streamer ...
86
Implementing a Spark Indexer ...
89
Implementing a Spark Data Processing ...
91
Data Analytics with Elasticsearch ...
93
Introduction to the aggregation framework ...
93
Visualize Data in Kibana ...
100
■
Chapter 6: Learning From Your Data? ...
105
Introduction to Machine Learning ...
105
Supervised Learning ...
105
Unsupervised Learning ...
107
Machine Learning with Spark ...
108
Adding Machine Learning to Our Architecture ...
108
Adding Machine Learning to Our Architecture ...
112
Enriching the Clickstream Data ...
112
Labelizing the Data ...
117
Training and Making Prediction ...
119
Summary ...
121
■
Chapter 7: Governance Considerations ...
123
Dockerizing the Architecture ...
123
Introducing Docker ...
123
Installing Docker ...
125
Creating Your Docker Images ...
125
Composing the Architecture ...
128
Architecture Scalability ...
132
Sizing and Scaling the Architecture ...
132
Monitoring the Infrastructure Using the Elastic Stack ...
135
Considering Security ...
136
Summary ...
137
About the Author
About the Technical Reviewers
Sundar Rajan Raman is a Big Data architect currently working for Bank of America. He has a bachelor’s of technology degree from the National Institute of Technology, Silchar, India. He is a seasoned Java and J2EE programmer with expertise in Hadoop, Spark, MongoDB, and Big Data analytics. He has worked at companies such as AT&T, Singtel, and Deutsche Bank. Sundar is also a platform specialist with vast experience in SonicMQ, WebSphere MQ, and TIBCO with respective certifications. His current focus is on Big Data architecture. More information about Raman is available at https://in.linkedin.com/pub/sundar-rajan-raman/7/905/488.
Sundar would like to thank his wife, Hema, and daughter, Shriya, for their patience during the review process.
Manoj R Patil is a principal architect (Big Data) at TatvaSoft, an IT services and consulting organization. He is a seasoned business intelligence (BI) and Big Data geek and has a total IT experience of 17 years with exposure to all the leading platforms like Java EE, .NET, LAMP, and more. In addition to authoring a book on Pentaho and Big Data, he believes in knowledge sharing and keeps himself busy providing corporate training and teaching ETL, Hadoop, and Scala passionately. He can be reached at
The Big (Data) Problem
Data management is getting more complex than it has ever been before. Big Data is everywhere, on everyone’s mind, and in many different forms: advertising, social graphs, news feeds, recommendations, marketing, healthcare, security, government, and so on.
In the last three years, thousands of technologies having to do with Big Data acquisition, management, and analytics have emerged; this has given IT teams the hard task of choosing, without having a
comprehensive methodology to handle the choice most of the time.
When making such a choice for your own situation, ask yourself the following questions: When should I think about employing Big Data for my IT system? Am I ready to employ it? What should I start with? Should I really go for it despite feeling that Big Data is just a marketing trend?
All these questions are running around in the minds of most Chief Information Officers (CIOs) and Chief Technology Officers (CTOs), and they globally cover the reasons and the ways you are putting your business at stake when you decide to deploy a distributed Big Data architecture.
This chapter aims to help you identity Big Data symptoms—in other words when it becomes apparent that you need to consider adding Big Data to your architecture—but it also guides you through the variety of Big Data technologies to differentiate among them so that you can understand what they are specialized for. Finally, at the end of the chapter, we build the foundation of a typical distributed Big Data architecture based on real life examples.
Identifying Big Data Symptoms
You may choose to start a Big Data project based on different needs: because of the volume of data you handle, because of the variety of data structures your system has, because of scalability issues you are experiencing, or because you want to reduce the cost of data processing. In this section, you’ll see what symptoms can make a team realize they need to start a Big Data project.
Size Matters
The two main areas that get people to start thinking about Big Data are when they start having issues related to data size and volume; although most of the time these issues present true and legitimate reasons to think about Big Data, today, they are not the only reasons to go this route.
There are others symptoms that you should also consider—type of data, for example. How will you manage to increase various types of data when traditional data stores, such as SQL databases, expect you to do the structuring, like creating tables?
Yes, it’s good to store unstructured data, but it’s better if you can get something out of it. Another symptom comes out of this premise: Big Data is also about extracting added value information from a high-volume variety of data. When, a couple of years ago, there were more read transactions than write transactions, common caches or databases were enough when paired with weekly ETL (extract, transform, load) processing jobs. Today that’s not the trend any more. Now, you need an architecture that is capable of handling data as it comes through long processing to near real-time processing jobs. The architecture should be distributed and not rely on the rigid high-performance and expensive mainframe; instead, it should be based on a more available, performance driven, and cheaper technology to give it more flexibility.
Now, how do you leverage all this added value data and how are you able to search for it naturally? To answer this question, think again about the traditional data store in which you create indexes on different columns to speed up the search query. Well, what if you want to index all hundred columns because you want to be able to execute complex queries that involve a nondeterministic number of key columns? You don’t want to do this with a basic SQL database; instead, you would rather consider using a NoSQL store for this specific need.
So simply walking down the path of data acquisition, data structuring, data processing, and data visualization in the context of the actual data management trends makes it easy to conclude that size is no longer the main concern.
Typical Business Use Cases
In addition to technical and architecture considerations, you may be facing use cases that are typical Big Data use cases. Some of them are tied to a specific industry; others are not specialized and can be applied to various industries.
These considerations are generally based on analyzing application’s logs, such as web access logs, application server logs, and database logs, but they can also be based on other types of data sources such as social network data.
When you are facing such use cases, you might want to consider a distributed Big Data architecture if you want to be able to scale out as your business grows.
Consumer Behavioral Analytics
Knowing your customer, or what we usually call the “360-degree customer view” might be the most popular Big Data use case. This customer view is usually used on e-commerce websites and starts with an unstructured clickstream—in other words, it is made up of the active and passive website navigation actions that a visitor performs. By counting and analyzing the clicks and impressions on ads or products, you can adapt the visitor’s user experience depending on their behavior, while keeping in mind that the goal is to gain insight in order to optimize the funnel conversion.
Sentiment Analysis
CRM Onboarding
You can combine consumer behavioral analytics with sentiment analysis based on data surrounding the visitor’s social activities. Companies want to combine these online data sources with the existing offline data, which is called CRM (customer relationship management) onboarding, in order to get better and more accurate customer segmentation. Thus, companies can leverage this segmentation and build a better targeting system to send profile-customized offers through marketing actions.
Prediction
Learning from data has become the main Big Data trend for the past two years. Prediction-enabled Big Data can be very efficient in multiple industries, such as in the telecommunication industry, where prediction router log analysis is democratized. Every time an issue is likely to occur on a device, the company can predict it and order part to avoid downtime or lost profits.
When combined with the previous use cases, you can use predictive architecture to optimize the product catalog selection and pricing depending on the user’s global behavior.
Understanding the Big Data Project’s Ecosystem
Once you understand that you actually have a Big Data project to implement, the hardest thing is choosing the technologies to use in your architecture. It is not just about picking the most famous Hadoop-related technologies, it’s also about understanding how to classify them in order to build a consistent distributed architecture.
To get an idea of the number of projects in the Big Data galaxy, browse to https://github.com/zenkay/ bigdata-ecosystem#projects-1 to see more than 100 classified projects.
Here, you see that you might consider choosing a Hadoop distribution, a distributed file system, a SQL-like processing language, a machine learning language, a scheduler, message-oriented middleware, a NoSQL datastore, data visualization, and so on.
Since this book’s purpose is to describe a scalable way to build a distributed architecture, I don’t dive into all categories of projects; instead, I highlight the ones you are likely to use in a typical Big Data project. You can eventually adapt this architecture and integrate projects depending on your needs. You’ll see concrete examples of using such projects in the dedicated parts.
To make the Hadoop technology presented more relevant, we will work on a distributed architecture that meets the previously described typical use cases, namely these:
• Consumer behavioral analytics
• Sentiment analysis
• CRM onboarding and prediction
Hadoop Distribution
In a Big Data project that involves Hadoop-related ecosystem technologies, you have two choices:
• Download the project you need separately and try to create or assemble the
technologies in a coherent, resilient, and consistent architecture.
• Use one of the most popular Hadoop distributions, which assemble or create the
Although the first option is completely feasible, you might want to choose the second one, because a packaged Hadoop distribution ensures capability between all installed components, ease of installation, configuration-based deployment, monitoring, and support.
Hortonworks and Cloudera are the main actors in this field. There are a couple of differences between the two vendors, but for starting a Big Data package, they are equivalent, as long as you don’t pay attention to the proprietary add-ons.
My goal here is not to present all the components within each distribution but to focus on what each vendor adds to the standard ecosystem. I describe most of the other components in the following pages depending on what we need for our architecture in each situation.
Cloudera CDH
Cloudera adds a set of in-house components to the Hadoop-based components; these components are designed to give you better cluster management and search experiences.
The following is a list of some of these components:
• Impala: A real-time, parallelized, SQL-based engine that searches for data in HDFS
(Hadoop Distributed File System) and Base. Impala is considered to be the fastest querying engine within the Hadoop distribution vendors market, and it is a direct competitor of Spark from UC Berkeley.
• Cloudera Manager: This is Cloudera’s console to manage and deploy Hadoop
components within your Hadoop cluster.
• Hue: A console that lets the user interact with the data and run scripts for the
different Hadoop components contained in the cluster.
Figure 1-1 illustrates Cloudera’s Hadoop distribution with the following component classification:
• The components in orange are part of Hadoop core stack.
• The components in pink are part of the Hadoop ecosystem project.
Hortonworks HDP
Hortonworks is 100-percent open source and is used to package stable components rather than the last version of the Hadoop project in its distribution.
It adds a component management console to the stack that is comparable to Cloudera Manager. Figure 1-2 shows a Hortonworks distribution with the same classification that appeared in Figure 1-1; the difference is that the components in green are Hortonworks-specific components.
Figure 1-2. Hortonworks Hadoop distribution
As I said before, these two distributions (Hortonworks and Cloudera) are equivalent when it comes to building our architecture. Nevertheless, if we consider the maturity of each distribution, then the one we should choose is Cloudera; the Cloudera Manager is more complete and stable than Ambari in terms of features. Moreover, if you are considering letting the user interact in real-time with large data sets, you should definitely go with Cloudera because its performance is excellent and already proven.
Hadoop Distributed File System (HDFS)
You may be wondering where the data is stored when it is ingested into the Hadoop cluster. Generally it ends up in a dedicated file system called HDFS.
These are HDFS’s key features:
• Distribution
• High-throughput access
• High availability
• Fault tolerance
• Tuning
• Security
HDFS is the first class citizen for data storage in a Hadoop cluster. Data is automatically replicated across the cluster data nodes.
Figure 1-3 shows how the data in HDFS can be replicated over a cluster of five nodes.
Figure 1-3. HDFS data replication
You can find out more about HDFS at hadoop.apache.org.
Data Acquisition
Data acquisition or ingestion can start from different sources. It can be large log files, streamed data, ETL processing outcome, online unstructured data, or offline structure data.
Apache Flume
When you are looking to produce ingesting logs, I would highly recommend that you use Apache Flume; it’s designed to be reliable and highly available and it provides a simple, flexible, and intuitive programming model based on streaming data flows. Basically, you can configure a data pipeline without a single line of code, only through configuration.
Flume is composed of sources, channels, and sinks. The Flume source basically consumes an event from an external source, such as an Apache Avro source, and stores it into the channel. The channel is a passive storage system like a file system; it holds the event until a sink consumes it. The sink consumes the event, deletes it from the channel, and distributes it to an external target.
With Flume, the idea is to use it to move different log files that are generated by the web servers to HDFS, for example. Remember that we are likely to work on a distributed architecture that might have load balancers, HTTP servers, application servers, access logs, and so on. We can leverage all these assets in different ways and they can be handled by a Flume pipeline. You can find out more about Flume at
flume.apache.org.
Apache Sqoop
Sqoop is a project designed to transfer bulk data between a structured data store and HDFS. You can use it to either import data from an external relational database to HDFS, Hive, or even HBase, or to export data from your Hadoop cluster to a relational database or data warehouse.
Sqoop supports major relational databases such as Oracle, MySQL, and Postgres. This project saves you from writing scripts to transfer the data; instead, it provides you with performance data transfers features.
Since the data can grow quickly in our relational database, it’s better to identity fast growing tables from the beginning and use Sqoop to periodically transfer the data in Hadoop so it can be analyzed.
Then, from the moment the data is in Hadoop, it is combined with other data, and at the end, we can use Sqoop export to inject the data in our business intelligence (BI) analytics tools. You can find out more about Sqoop at sqoop.apache.org.
Processing Language
Once the data is in HDFS, we use a different processing language to get the best of our raw bulk data.
Yarn: NextGen MapReduce
MapReduce was the main processing framework in the first generation of the Hadoop cluster; it basically grouped sibling data together (Map) and then aggregated the data in depending on a specified aggregation operation (Reduce).
In Hadoop 1.0, users had the option of writing MapReduce jobs in different languages—Java, Python, Pig, Hive, and so on. Whatever the users chose as a language, everyone relied on the same processing model: MapReduce.
Since Hadoop 2.0 was released, however, a new architecture has started handling data processing above HDFS. Now that YARN (Yet Another Resource Negotiator) has been implemented, others processing models are allowed and MapReduce has become just one among them. This means that users now have the ability to use a specific processing model depending on their particular use case.
Figure 1-5 shows how HDFS, YARN, and the processing model are organized.
We can’t afford to see all the language and processing models; instead we’ll focus on Hive and Spark, which cover our use cases, namely long data processing and streaming.
Batch Processing with Hive
When you decide to write your first batch-processing job, you can implement it using your preferred programming language, such as Java or Python, but if you do, you better be really comfortable with the mapping and reducing design pattern, which requires development time and complex coding, and is, sometimes, really hard to maintain.
As an alternative, you can use a higher-level language, such as Hive, which brings users the simplicity and power of querying data from HDFS in a SQL-like way. Whereas you sometimes need 10 lines of code in MapReduce/Java; in Hive, you will need just one simple SQL query.
When you use another language rather than using native MapReduce, the main drawback is the performance. There is a natural latency between Hive and MapReduce; in addition, the performance of the user SQL query can be really different from a query to another one, as is the case in a relational database. You can find out more about Hive at hive.apache.org.
Hive is not a near or real-time processing language; it’s used for batch processing such as a long-term processing job with a low priority. To process data as it comes, we need to use Spark Streaming.
Stream Processing with Spark Streaming
Spark Streaming lets you write a processing job as you would do for batch processing in Java, Scale, or Python, but for processing data as you stream it. This can be really appropriate when you deal with high throughput data sources such as a social network (Twitter), clickstream logs, or web access logs.
Spark Streaming is an extension of Spark, which leverages its distributed data processing framework and treats streaming computation as a series of nondeterministic, micro-batch computations on small intervals. You can find out more about Spark Streaming at spark.apache.org.
Spark Streaming can get its data from a variety of sources but when it is combined, for example, with Apache Kafka, Spark Streaming can be the foundation of a strong fault-tolerant and high-performance system.
Message-Oriented Middleware with Apache Kafka
Apache is a distributed publish-subscribe messaging application written by LinkedIn in Scale. Kafka is often compared to Apache ActiveMQ or RabbitMQ, but the fundamental difference is that Kafka does not implement JMS (Java Message Service). However, Kafka is a persistent messaging and high-throughput system, it supports both queue and topic semantics, and it uses ZooKeeper to form the cluster nodes.
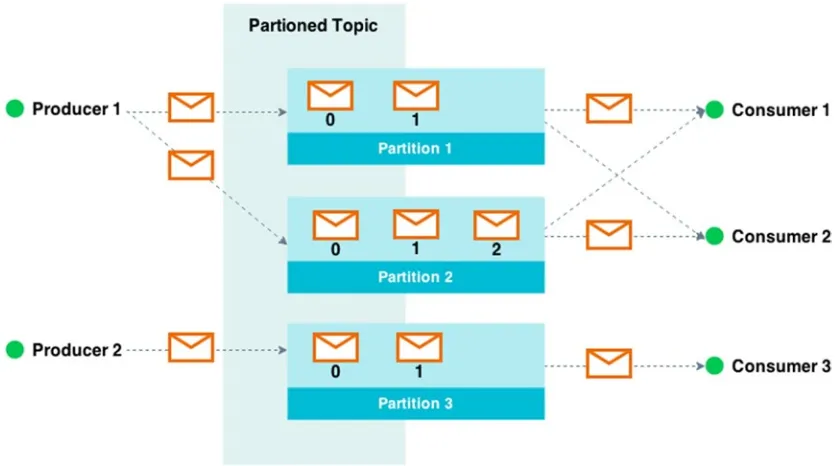
Kafka implements the publish-subscribe enterprise integration pattern and supports parallelism and enterprise features for performance and improved fault tolerance.
Figure 1-6 gives high-level points of view of a typical publish-subscribe architecture with message transmitting over a broker, which serves a partitioned topic.
Figure 1-6. Kafka partitioned topic example
Machine Learning
It’s never too soon to talk about machine learning in our architecture, specifically when we are dealing with use cases that have an infinity converging model that can be highlighted with a small data sample. We can use a machine learning—specific language or leverage the existing layers, such as Spark with Spark MLlib (machine learning library).
Spark MLlib
MLlib enables machine learning for Spark, it leverages the Spark Direct Acyclic Graph (DAG) execution engine, and it brings a set of APIs that ease machine learning integration for Spark. It’s composed of various algorithms that go from basic statistics, logistic regression, k-means clustering, and Gaussian mixtures to singular value decomposition and multinomial naive Bayes.
With Spark MLlib out-of-box algorithms, you can simply train your data and build prediction models with a few lines of code. You can learn more about Spark MLlib at spark.apache.org/mllib.
NoSQL Stores
NoSQL datastores are fundamental pieces of the data architecture because they can ingest a very large amount of data and provide scalability and resiliency, and thus high availability, out of the box and without effort. Couchbase and ElasticSearch are the two technologies we are going to focus on; we’ll briefly discuss them now, and later on in this book, we’ll see how to use them.
Couchbase
Couchbase is a document-oriented NoSQL database that is easily scalable, provides a flexible model, and is consistently high performance. We’ll use Couchbase as a document datastore, which relies on our relational database.
Basically, we’ll redirect all reading queries from the front end to Couchbase to prevent high-reading throughput on the relational database. For more information on Couchbase, visit couchbase.com.
ElasticSearch
ElasticSearch is a NoSQL technology that is very popular for its scalable distributed indexing engine and search features. It’s based on Apache Lucene and enables real-time data analytics and full-text search in your architecture.
ElasticSearch is part of the ELK platform, which stands for ElasticSearch + Logstash + Kibana, which is delivered by Elastic the company. The three products work together to provide the best end-to-end platform for collecting, storing, and visualizing data:
• Logstash lets you collect data from many kinds of sources—such as social data, logs,
messages queues, or sensors—it then supports data enrichment and transformation, and finally it transports them to an indexation system such as ElasticSearch.
• ElasticSearch indexes the data in a distributed, scalable, and resilient system. It’s
Figure 1-7 shows the structure of Elastic products.
Figure 1-7. ElasticSearch products
As you can see in the previous diagram, Elastic also provides commercial products such as Marvel, a monitoring console based on Kibana; Shield, a security framework, which, for example, provides authentication and authorization; and Watcher, an alerting and notification system. We won’t use these commercial products in this book.
Creating the Foundation of a Long-Term
Big Data Architecture
Keeping all the Big Data technology we are going to use in mind, we can now go forward and build the foundation of our architecture.
Architecture Overview
From a high-level point of view, our architecture will look like another e-commerce application architecture. We will need the following:
• A web application the visitor can use to navigate in a catalog of products
• A log ingestion application that is designed to pull the logs and process them
• A learning application for triggering recommendations for our visitor
• A processing engine that functions as the central processing cluster for the
architecture
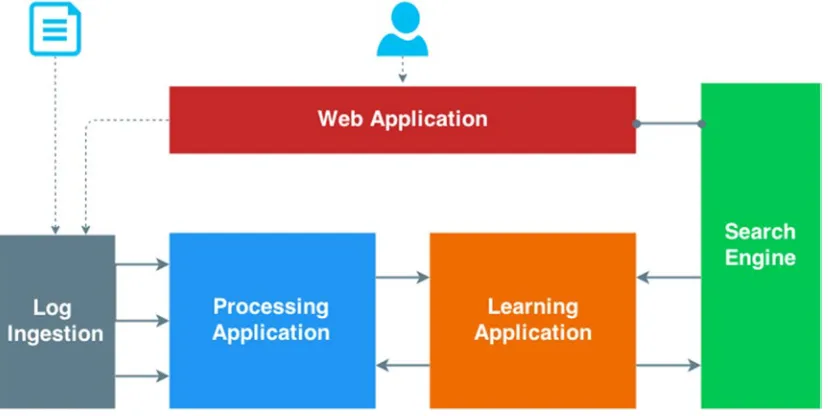
• A search engine to pull analytics for our process data
Figure 1-8 shows how these different applications are organized in such an architecture.
Log Ingestion Application
The log ingestion application is used to consume application logs such as web access logs. To ease the use case, a generated web access log is provided and it simulates the behavior of visitors browsing the product catalog. These logs represent the clickstream logs that are used for long-term processing but also for real-time recommendation.
There can be two options in the architecture: the first can be ensured by Flume and can transport the logs as they come in to our processing application; the second can be ensured by ElasticSearch, Logstash, and Kibana (the ELK platform) to create access analytics.
Figure 1-9 shows how the logs are handled by ELK and Flume.
Figure 1-9. Ingestion application
Using ELK for this architecture gives us a greater value since the three products integrate seamlessly with each other and bring more value that just using Flume alone and trying to obtain the same level of features.
Learning Application
Figure 1-10 shows how the data is received by the learning application in Kafka, is then sent to Spark to be processed, and finally is indexed into ElasticSearch for further usage.
Processing Engine
The processing engine is the heart of the architecture; it receives data from multiple kinds of source and delegates the processing to the appropriate model.
Figure 1-11 shows how the data is received by the processing engine that is composed of Hive for path processing and Spark for real-time/near real-time processing.
Here we use Kafka combined with Logstash to distribute the data to ElasticSearch. Spark lives on top of a Hadoop cluster, which is not mandatory. In this book, for simplicity’s sake, we do not set up a Hadoop cluster, but prefer to run Spark in a standalone mode. Obviously, however, you’re able to deploy your work in your preferred Hadoop distribution.
Figure 1-11. Processing engine
Search Engine
The search engine leverages the data processed by the processing engine and exposes a dedicated RESTful API that will be used for analytic purposes.
Summary
Early Big Data with NoSQL
In this chapter, I provide you with an overview of the available datastore technologies that are use in a Big Data project context. I then focus on Couchbase and ElasticSearch and show you how they can be used and what their differences are.
The first section gives you a better understanding of the different flavors of existing technologies within the NoSQL landscape.
NoSQL Landscape
Relational databases were the choice, almost the only choice, of a lot of developers and database
administrators for traditional three-tier applications. This was the case for many reasons having to do with the data modeling methodology, the querying language that interacted with the data, and the powerful nature of those technologies, which allowed for consistent data stores to be deployed that served complex applications.
Then the needs started to evolve/change in such a way that those data stores could no longer be the solution to all data-store problems. That’s how the term NoSQL arose—it offered a new approach to those problems by first breaking the standardized SQL schema-oriented paradigms.
NoSQL technologies are schemaless and highly scalable, and couple of them are also highly distributed and high-performance. Most of the time, they complete an architecture with an existing RDBMS technology by, for example, playing the role of cache, search engine, unstructured store, and volatile information store.
They are divided in four main categories:
1. Key/value data store
2. Column data store
3. Document-oriented data store
4. Graph data store
Now let’s dive into the different categories and then choose the most appropriate for our use case.
Key/Value
Key/value data stores can also be used in a queuing context to ensure that data won’t be lost, such as in logging architecture or search engine indexing architecture use cases.
Redis and Riak KV are the most famous key/value data stores; Redis is more widely used and has an in-memory K/V store with optional persistence. Redis is often used in web applications to store session-related data, like node or PHP web applications; it can serve thousands of session retrievals per second without altering the performance. Another typical use case is the queuing use case that I describe later in this book; Redis is positioned between Logstash and ElasticSearch to avoid losing streamed log data before it is indexed in ElasticSearch for querying.
Column
Column-oriented data stores are used when key/value data stores reach their limits because you want to store a very large number of records with a very large amount of information that goes beyond the simple nature of the key/value store.
Column data store technologies might be difficult to understand for people coming from the RDBMS world, but actually, they are quite simple. Whereas data is stored in rows in RDBMS, it is obviously stored in columns in column data stores. The main benefit of using columnar databases is that you can quickly access a large amount of data. Whereas a row in an RDBMS is a continuous disk entry, and multiple rows are stored in different disk locations, which makes them more difficult to access, in columnar databases, all cells that are part of a column are stored continuously.
As an example, consider performing a lookup for all blog titles in an RDBMS; it might be costly in terms of disk entries, specifically if we are talking about millions of records, whereas in columnar databases, such a search would represent only one access.
Such databases are indeed very handy for retrieving large amounts of data from a specific family, but the tradeoff is that they lack flexibility. The most used columnar database is Google Cloud Bigtable, but specifically, Apache HBase and Cassandra.
One of the other benefits of columnar databases is ease of scaling because data is stored in columns; these columns are highly scalable in terms of the amount of information they can store. This is why they are mainly used for keeping nonvolatile, long-living information and in scaling use cases.
Document
Columnar databases are not the best for structuring data that contains deeper nesting structures—that’s where document-oriented data stores come into play. Data is indeed stored into key/value pairs, but these are all compressed into what is called a document. This document relies on a structure or encoding such as XML, but most of the time, it relies on JSON (JavaScript Object Notation).
Although document-oriented databases are more useful structurally and for representing data, they also have their downside—specifically when it comes to interacting with data. They basically need to acquire the whole document—for example, when they are reading for a specific field—and this can dramatically affect performance.
You are apt to use document-oriented databases when you need to nest information. For instance, think of how you would represent an account in your application. It would have the following:
• Basic information: first name, last name, birthday, profile picture, URL, creation
date, and so on
• Complex information: address, authentication method (password, Facebook, etc.),
interests, and so on
The most used technologies today are MongoDB, Couchbase, and Apache CouchDB. These are easy to install and start, are well documented, and are scalable, but above all, they are the most obvious choices for starting a modern web application.
Couchbase is one the technologies we are going to use in our architecture specifically because of the way we can store, organize, and query the data using it. I made the choice of Couchbase mainly based on a performance benchmark that reveals that high latency is lower for high operation thoughputs than it is in MongoDB.
Also it’s worth mentioning that Couchbase is the combination of CouchDB and Memcached, and today, from a support perspective, it makes more sense to use Couchbase, more details on this link.
Graph
Graph databases are really different from other types of database. They use a different paradigm to represent the data—a tree-like structure with nodes and edges that are connected to each other through paths called
relations.
Those databases rise with social networks to, for example, represent a user’s friends network, their friends’ relationships, and so on. With the other types of data stores, it is possible to store a friend’s relationship to a user in a document, but still, it can then be really complex to store friends’ relationships; it’s better to use a graph database and create nodes for each friend, connect them through relationships, and browse the graph depending on the need and scope of the query.
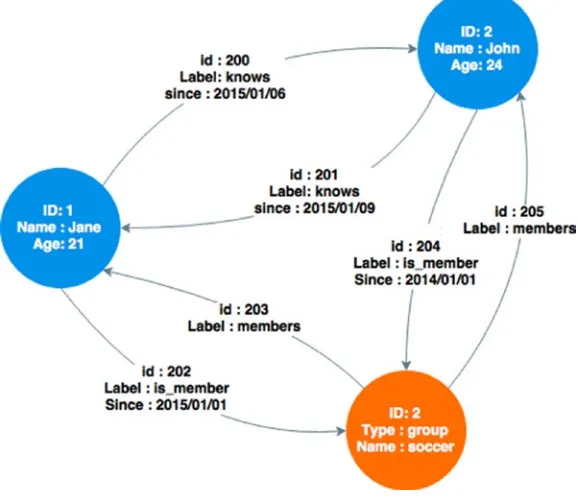
The most famous graph database is Neo4j, and as I mentioned before, it is used for use cases that have to do with complex relationship information, such as connections between entities and others entities that are related to them; but it is also used in classification use cases.
The diagram’s two accounts nodes, Jane and John, connect to each other through edges that define their relationship; they have known each other since a defined date. Another group node connects to the two accounts nodes and this shows that Jane and John have been part of the soccer group since a defined date.
NoSQL in Our Use Case
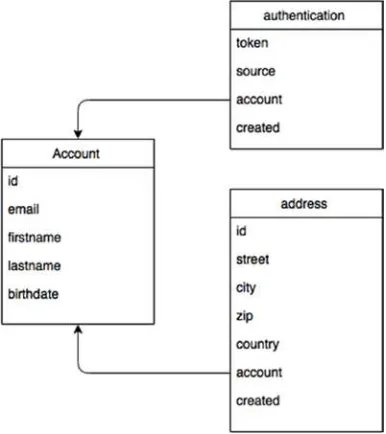
In the context of our use case, we first need a document-oriented NoSQL technology that structures the data contained in our relational database into a JSON document. As mentioned earlier, traditional RDBMSs store data into multiple tables linked with relationships, which makes it harder and less efficient when you want to get the description of a whole object.
Let’s take the example of an account that can be split into the tables shown in Figure 2-2.
Figure 2-2. Account tables
If you want to retrieve all account information, you basically need to make two joins between the three tables. Now think this: I need to do that for all users, every time they connect, and these connections happen for different business logic reasons in my application. In the end, you just want a “view” of the account itself.
What if we can get the whole account view just by passing the account identifier to a method of our application API that returns the following JSON document?
{
"token": "authentication_token_1",
The benefit is obvious: by keeping a fresh JSON representation of our application entities, we can get better and faster data access. Furthermore, we can generalize this approach to all read requests so that all the reading is done on the NoSQL data store, which leaves all the modification requests (create, update, delete) to be made on the RDBMS. But we must implements a logic that transactionally spreads any changes on the RDBMS to the NoSQL data store and also that creates the object from the relational database if it is not found in the cache.
You may wonder why we would keep the RDBMS when we know that creating documents in a NoSQL data store is really efficient and scalable. It is because that is actually not the goal of our application. We don’t want to make a Big Bang effect. Let’s assume that the RDBMS was already there and that we want to integrate a NoSQL data store because of the lack of flexibility in a RDBMS. We want to leverage the best of the two technologies—specifically the data consistency in the RDBMS and the scalability from the NoSQL side.
Beside, this is just a simple query example that we can perform, but we want to go further by, for example, making full-text searches on any field of our document. Indeed, how do we do this with a relational database? There is indexing, that’s true, but would we index all table columns? In fact, that’s not possible; but this is something you can easily do with NoSQL technologies such as ElasticSearch.
Before we dive into such a NoSQL caching system, we need to go through how to use a Couchbase document-oriented database, and then we need to review the limitations that will drive us to switch to ElasticSearch.
We will see that our scalable architecture first relies on Couchbase, but because of some important Couchbase limitations, we’ll first complete the architecture with ElasticSearch before we make a definitive shift to it.
Introducing Couchbase
Couchbase is an open source, document-oriented database that has a flexible data model, is performant, is scalable, and is suitable for applications like the one in our use case that needs to shift its relational database data into a structured JSON document.
Architecture
Couchbase is based on a real shared-nothing architecture, which means that there is no single point of contention because every node in the cluster is self-sufficient and independent. That’s how distributed technologies work—nodes don’t share any memory or disk storage.
Documents are stored in JSON or in binary in Couchbase, are replicated over the cluster, and are organized into units called buckets. A bucket can be scaled depending on the storage and access needs by setting the RAM for caching and also by setting the number of replication for resiliency. Under the hood, a bucket is split into smaller units called vBuckets that are actually data partitions. Couchbase uses a cluster map to map the partition to the server to which it belongs.
A Couchbase server replicates up to three times a bucket within a cluster; every Couchbase server then manages a subset of the active or replica vBuckets. That’s how resiliency works in Couchbase; every time a document is indexed, it’s replicated, and if a node within the cluster goes down, then the cluster promotes a replica partition to active to ensure continuous service.
Only one copy of the data is active with zero or more replicas in the cluster as Figure 2-3 illustrates.
Figure 2-3. Couchbase active document and replicas
As Figure 2-4 shows, the smart-client connects to a Couchbase server instance and first asynchronously writes the document in the managed cache. The client gets a response immediately and is not blocked until the end of the data flow process, but this behavior can be changed at the client level to make the client wait for the write to be finished. Then the document is put in the inter-cluster write queue, so the document is replicated across the cluster; after that, the document is put in the disk storage write queue to be persisted on the related node disk. If multiple clusters are deployed, then the Cross Data Center Replication (XDCR) feature can be used to propagate the changes to other clusters, located on a different data center.
Couchbase has its own way to query the data; indeed, you can query the data with a simple document ID, but the power of Couchbase is inside the view feature. In Couchbase, there is a second-level index called the design document, which is created within a bucket. A bucket can contain multiple types of document, for example, in a simple e-commerce application a bucket would contain the following:
• Account
• Product
• Cart
The way Couchbase splits them logically is through the design document. A bucket can contain multiple design documents, which also contain multiple views. A view is a function that indexes documents contained in the bucket in a user-defined way. The function is precisely a user-defined map/reduce function that maps documents across the cluster and outputs key/value pairs, which are then stored in the index for further retrieval. Let’s go back to our e-commerce website example and try to index all orders so we can get them from the account identifier. The map/reduce function would be as follows:
function(doc, meta) { if (doc.order_account_id)
emit(doc.order_account_id, null); }
The if statement allows the function to focus only on the document that contains the order_account_id field and then index this identifier. Therefore any client can query the data based on this identifier in Couchbase.
Cluster Manager and Administration Console
Cluster manager is handled by a specific node within the cluster, the orchestrator node. At any time, if one of the nodes fails within the cluster, then the orchestrator handles the failover by notifying all other nodes within the cluster, locating the replica partitions of the failing node to promote them to active status. Figure 2-5 describes the failover process.
If the orchestrator node fails, then all nodes detect that through the heartbeat watchdog, which is a cluster component that runs on all cluster nodes. Once the failure is detected, a new orchestrator is elected among the nodes.
All cluster-related features are exposed through APIs that can be used to manage Couchbase, but the good news is that an administration console is shipped out of the box. Couchbase console is a secure console that lets you manage and monitor your cluster; you can choose from the available actions, which include setting up your server, creating buckets, browsing and updating documents, implementing new views, and monitoring vBucket and the disk write queue.
Figure 2-6 shows the Couchbase console home page with an overview of the RAM used by existing buckets, the disk used by data, and the buckets’ activity.
You can perform cluster management in the Server Nodes tab, which lets the user configure failover and replication to prevent them from losing data. Figure 2-7 shows a single node installation that is not safe for failover as the warning mentions.
Figure 2-7. Couchbase server nodes
At any time, you can add a new Couchbase server by clicking the Add Server button; when you do, data will start replicating across nodes to enable failover.
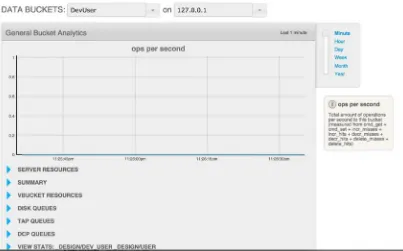
This figure shows a data bucket called DevUser that contains the user-related JSON document. As explained earlier, the process of indexing a new document is part of a complex data flow under the hood. The metrics shown in the monitoring console are essential when you are dealing with a large amount of data that generates a high indexing throughput. For example, the disk queue statistics can reveal bottlenecks when data is being written on the disk.
In Figure 2-9, we can see that the drain rate—the number of items written on the disk from the disk write queue—is alternatively flat on the active side when the replica is written, and that the average age of the active item grows during that flat period. An altering behavior would have been to see the average age of the active item keep growing, which would mean that the writing process was too slow compared to the number of active items pushed into the write disk queue.
Managing Documents
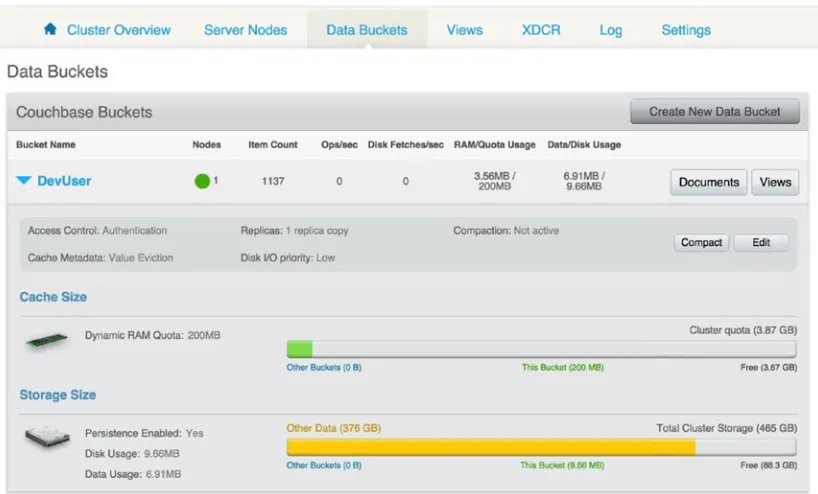
You can manage all documents from the administration console through the bucket view. This view allows users to browse buckets and design documents and views. Documents are stored in a bucket in Couchbase, and they can be accessed in the Data Bucket tab on the administration console as shown in the Figure 2-10.
Figure 2-10. Couchbase console bucket view
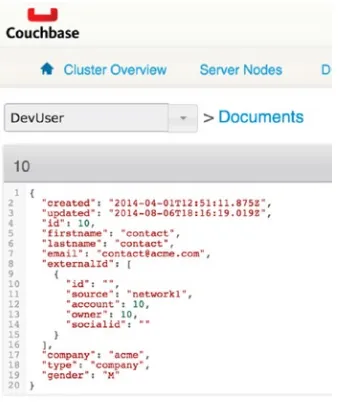
As in the server view, the console gives statistics on the bucket, such as RAM and storage size, as well as the number of operation per second. But the real benefit of this view is that you are able to browse documents and retrieve them by ID as is shown in Figure 2-11.
Figure 2-11. Couchbase document by ID
Figure 2-12. Couchbase console view implementation
In Figure 2-12, I have implemented a view that retrieves documents based on the company name. The administration console is a handy way to manage documents, but in real life, you can start implementing your design document in the administration console, and you can create a backup to industrialize its deployment.
All design documents are stored in a JSON file and a simple structure that describes all the views, similar to what Listing 2-1 shows.
Listing 2-1. Designing a Document JSON Example
[{
... "doc": {
"json": {
"views": {
"by_Id": {"map": "function (doc, meta) {\n emit(doc.id, doc);\n}"},
"by_email": {"map": "function (doc, meta) {\n emit(doc.email, doc);\n}"},
"by_name": {"map": "function (doc, meta) {\n emit(doc.firstname, null);\n}"},
"by_company": {"map": "function (doc, meta) {\n emit(doc.company, null);\n}"},
"by_form": {"map": "function (doc, meta) {\n emit(meta.id, null);\n}"}
As you have seen, you can perform document management through the administration console, but keep in mind that in industrialized architecture, most of the work is done through scripts that use the Couchbase API.
Introducing ElasticSearch
You have seen an example of a NoSQL database with Couchbase; ElasticSearch is also a NoSQL technology but it’s totally different than Couchbase. It’s a distributed datastore provided by the company named Elastic (at the time I’m writing this book, ElasticSearch is in version 2.1).
Architecture
ElasticSearch is a schemaless engine; data is stored in JSON and is partitioned into what we call shards. A shard is actually a Lucene index and is the smallest unit of scale in ElasticSearch. Shards are organized in indexes in ElasticSearch with which an application can make read and write interactions. In the end, an index is just a logical namespace in ElasticSearch that regroups a collection of shards, and when a request comes in, ElasticSearch routes it to the appropriate shards as the Figure 2-13 summarizes.
Figure 2-13. Elasticsearch index and shards
Figure 2-14. ElasticSearch primary shard allocation
The good thing is that ElasticSearch automatically copies the shard over the network on the new node for you as described in Figure 2-14. But what if you want to be sure that you won’t lose data? That’s where replica shards come into play.
Replica shards are made at start for failover; when a primary shard dies, a replica is promoted to become the primary to ensure continuity in the cluster. Replica shards have the same load that primary shards do at index time; this means that once the document is indexed in the primary shard, it’s indexed in the replica shards. That’s why adding more replicas to our cluster won’t increase index performance, but still, if we add extra hardware, it can dramatically increase search performance. In the three nodes cluster, with two primary shards and two replica shards, we would have the repartition shown in Figure 2-15.
Figure 2-15. ElasticSearch primary and replica shards
In addition to increased performance, this use case also helps with balancing requests and getting better performance on the overall cluster.
Here are descriptions of the three types of node:
• Master nodes: These nodes are lightweight and responsible for cluster management.
It means they don’t hold any data, server indices, or search requests. They are dedicated to ensure cluster stability and have a low workload. It’s recommended that you have three dedicated master nodes to be sure that if one fails, redundancy will be guaranteed.
• Data nodes: These nodes hold the data and serve index and search requests.
• Client nodes: These ensure load balancing in some processing steps and can take on
part of the workload that a data node can perform, such as in a search request where scattering the request over the nodes and gathering the output for responses can be really heavy at runtime.
Now that :you understand the architecture of ElasticSearch, let’s play with the search API and run some queries.
Monitoring ElasticSearch
Elastic provides a plug-in called Marvel for ElasticSearch that aims to monitor an ElasticSearch cluster. This plug-in is part of Elastic’s commercial offer, but you can use it for free in Development mode.
You can download Marvel from the following link; the installation process is quite simple:
https://www.elastic.co/downloads/marvel
Marvel relies on Kibana, the visualization console of Elastic, and comes with a bunch of visualization techniques that let an operator be really precise about what happens in the cluster. Figure 2-17 shows the overview dashboard that you see when launching Marvel.
Figure 2-18. Marvel’s shard allocation view
Marvel provides information on nodes, indices, and shards; about the CPU used; about the memory used by the JVM; about the indexation rate, and about the search rate. Marvel even goes down to the Lucene level by providing information about flushes and merges. You can, for example, have a live view of the shard allocation on the cluster, as shown in Figure 2-18.
As you can see, the dashboard is organized in several rows; in fact, there are more than 20 rows that you just can’t see in this screenshot. Each row contains one or visualization about the row topic. In Figure 2-19, you can see that no GET requests are sent to indices; that’s why the line chart is flat on 0.
During the development mode, these statistics will help you scale your server by, for example, starting with a single node cluster and seeing the behavior based on your specific needs. Then in production mode, you are able to follow the life inside your cluster without losing any information about it.
Search with ElasticSearch
Marvel comes with a feature called Sense that is a query editor/helper for ElasticSearch. The real power of Sense is its ability to autocomplete your query, which helps a lot when you are not familiar with all ElasticSearch APIs, as shown in Figure 2-20.
Figure 2-20. Marvel Sense completion feature
You can also export your query to cURLs, for example, so you can use it in a script as show in Figure 2-21.
Figure 2-21. Marvel Sense copy as cURL feature
In this case, the query would give a cURL command, as show in Listing 2-3.
Listing 2-3. Example of cURL Command Generated by Sense
curl -XGET "http://192.168.59.103:9200/yahoo/_search" -d' {
"query": { "match_all": {} }
As a result, we get a document with an array where each item contains the date, the number of the document found in the month period, and the highest value, as shown in Listing 2-4.
Listing 2-4. Aggregation Bucket
{
"key_as_string": "2015-01-01T00:00:00.000Z", "key": 1420070400000,
"doc_count": 20, "by_high_value": {
"value": 120 }
}
Figure 2-22. Marvel Sense Aggregation example
As you can see in the query in Figure 2-22, there are two levels of aggregation: the first is for the date histogram, and the second is for the max value. Indeed, ElasticSearch supports multiple levels of aggregation as long as it make sense from a query point of view.
The search API is really rich, and we can’t browse all features one by one in this book, but you get an introduction to its capabilities and get more information about it on the following documentation link:
https://www.elastic.co/guide/en/elasticsearch/reference/1.4/search-search.html
Now that you are familiar with our two NoSQL technologies, let’s see a different approach to integrating them in an e-commerce application.
Using NoSQL as a Cache in a SQL-based Architecture
At this point, you should understand the benefit of working with a NoSQL technology when compared to a SQL database. But we don’t want to break an existing architecture that is relying on a SQL database. In the following approach, we’ll see how we can complete our architecture so we add more flexibility for accessing data based on a NoSQL technology.
Caching Document
The first thing we need to discuss is how to replicate our data transactionally in our NoSQL backend. What we want is for each time data is written in a SQL database, a document to be created, updated, and enriched in our NoSQL backend. The document can be created because it doesn’t already exist, or a field can be updated, or it can be enriched with a subdocument that corresponds to a table relation in our RDBMS. In terms of accessing the document, whenever an API GET request is made, the underlying implementation should first look in the NoSQL backend and return the document if it’s there.
But what if the document is not present? Then a cache miss event should be triggered and sent to the NoSQL manager implementation to rebuild the document from RDBMS. Sounds great! But what if the insert transaction fails at the SQL level? The framework should be transactional and only trigger a document build if the transaction has been committed in SQL.
Here is a description of what’s going on in Figure 2-23:
• The first diagram shows how an account is created in RDBMS and then how a
document representing the whole account is created in NoSQL.
• The second diagram shows how the API gets an account through the NoSQL store.
• The third diagram shows an example of a cache miss, when the document is not
present in NoSQL and has to be re-created from the RDBMS.
We are actually building a cache for our web application based on NoSQL. This approach relies on the flexibility to access a whole document in NoSQL without the burden of asking to SQL database, and also the flexibility to leverage the distributed aspect of NoSQL. With this approach, we can imagine scaling our cluster as the request rate grows and reducing the demand on our SQL database.
ElasticSearch Plug-in for Couchbase with Couchbase XDCR
To achieve such a caching mechanism, we need to choose a NoSQL technology. My first approach was to use Couchbase alone, but as you have already seen, the search features in Couchbase are not really handy.
Dealing with the map/reduce function to index data is not trivial, specifically when it comes to making a simple aggregation. Couchbase is a fantastic NoSQL database, but implementing a search is a great pain.
Instead, you can use the Couchbase/ElasticSearch integration plug-in, which basically replicates all the data using the Cross Data Center Replication (XDCR) feature to our ElasticSearch cluster (www.couchbase. com/jp/couchbase-server/connectors/elasticsearch).
This way, you can add a Search Manager class to your API that implements an ElasticSearch search API to retrieve the data.
But still, this causes a lot of overhead for just being able to fetch a document from NoSQL instead of our RDBMS. In terms of operational tasks, this makes it so you have three different technologies to maintain: RDBMS, Couchbase, and ElasticSearch.
ElasticSearch Only
Why should we keep using Couchbase, when these are the following are things we need?
• The ability to index an entire object, such as an account from SQL to NoSQL
• The ability to conduct simple to complex searches involving aggregation through a
flexible search API.
In our specific use case, you could have chosen to start with Couchbase because it’s a NoSQL database and, as you know from learned best practices, documents should be stored in a database. When experiencing such an architecture, you learn that what you really need is the most efficient way to access and request your data, and in our case, ElasticSearch is most efficient way.
Summary
At this point, you have seen how NoSQL technologies such as Couchbase or ElasticSearch can bring flexibility to an existing RDBMS-based application.
Also, you have seen that two technologies that are perceived as similar from a high-level point of view can be fundamentally different.
Defining the Processing Topology
In the previous chapter, I explained how to use a NoSQL technology in the architecture that you’re building in this book. The NoSQL technology provides some caching and searching features to the application, but since you want to process data, you need to define an approach to handle various streams of data so you can deliver insights to your users or data services to your applications.
This chapter will explain how to define the processing topology by walking you through a data architecture that is commonly used in IT organizations. Then you’ll see why splitting is something that comes naturally when respecting service level agreements (SLAs). Finally, I’ll discuss a specific kind of architecture, the lambda architecture, which is a combination of different types of architectures.
First Approach to Data Architecture
This section describes the first step of deploying a data architecture using common technologies from the Big Data space.
A Little Bit of Background
A lot of IT organizations are evolving their data architecture today because they are relying on what you could call traditional data architectures. Dealing with multiple data sources is not new at all; these architectures are connected to a multitude of sources such as CRM systems, file systems, and legacy systems. They are mainly running on top of relational databases such as Oracle, DB2, or Microsoft SQL.
Today, the usual data analytics cycle is to run some periodic processes that extract and process data directly from the databases. That is mainly done today by extract, transform, and load (ETL) tools such as Informatica or Talend. The goal is to load the digested data into a data warehouse for further analytics.
Unfortunately, this way of handling data isn’t inline with the business needs at the end of the cycle. These data pipelines can take hours, days, and sometimes weeks to complete, but business decisions need to be made now.
Besides the processing time, there are some fundamental changes in the nature of data that can’t be handled easily by these architectures, such as a data structure that forces the data modeling to be refactored or even a data volume that leads to scalability considerations. Scaling those systems isn’t easy because I’m not talking about a distributed system here. Scaling is expensive in terms of deployment time but also in terms of hardware because databases require highly performant CPUs, RAM, and storage solutions to run.
Today most IT organizations are switching to deploying data architectures based on Hadoop
The following section what covers the data pipeline, what kind of technologies are involved, and the common practices for this type of architecture.
Dealing with the Data Sources
As Figure 3-1 shows, the data can come from multiple internal or external sources, but Big Data particularly comes from internal application and device logs, as well as from social networks, open data, or even sensors.
If you take the example of a social network, data is flooding into IT organizations with interesting information, but this attractive information is drowning among a massive amount of useless information. Therefore, first this data needs to be stored, and then it needs to be processed to extract the important parts. This data is really useful for sales, specifically when you run sentiment analysis on top of it to reveal your social ecosystem’s feeling about your brand or products.
Depending on the provider, data can be structured, semistructured, or unstructured. Listing 3-1 gives an example of a semistructured message.
Listing 3-1. Example of the Semistructured Data of a Tweet
{
"created_at": "Fri Sep 11 12:11:59 +0000 2015", "id": 642309610196598800,
"id_str": "642309610196598785",
"text": "After a period in silent mode, going back to tweet life", "source": "<a href="http://twitter.com/download/iphone" rel="nofollow">
Twitter for iPhone</a>", "truncated": false,