Refer to Important disclosures on the last of this report
Stock DataTarget price (Rp) Rp700
Prior TP (Rp) Rp700
Shareprice (Rp) Rp655
Upside/downside (%) +6.9
Sharesoutstanding (m) 14,426
Marketcap. (US$ m) 633
Semarop Agung 33.5%
Sinarmegah Jayasentosa 6.6%
Public 24.9%
Estimate Change; Vs. Consensus 2018 2019 PT Indo Premier Sekuritas [email protected] +62 21 5793 1168
Good 2Q, but below expectation
Earnings of Rp78bn in 1H18 (+61% yoy), below market expectation
Relatively slow marketing sales of Rp1.9tn in 8M18 (+2% yoy)
Possible earnings growth from debt refinancing of Rp23bn in 2019.
Maintain Hold with unchanged TP of Rp700.
Earnings of Rp78bn in 1H18 (+61% yoy), forming 19% of our forecast.
SMRA
reported earnings of Rp78bn in 1H18 (+61% yoy), which came below
market expectation, forming 19% of our/consensus FY18F forecast. Revenue was
flat -1% yoy, but grew 23% qoq, with margin improvement due to limited
launching, where COGS declined by 7% yoy. In addition, SMRA booked positive
cash flow of Rp184bn in 1H18, which is company’s best performance since 2016.
In quarterly basis, SMRA booked relatively strong earnings of Rp36bn in 2Q18
(-13% qoq), much stronger that 2Q17 and 2Q16 where company booked losses of
Rp23bn and Rp4bn, respectively.
8M18 marketing sales forming only 47% of FY18F guidance.
Due to limited
launching ytd (3 projects), SMRA only booked total marketing sales of Rp1.9tn in
1H18 (+2% yoy), forming only 47% of company’s FY18 guidance of Rp4tn (Ours:
Rp3.8tn). Summarecon Serpong is still the main contributor to the marketing
sales with Rp890bn, followed by Bekasi and Bandung with Rp581bn and Rp167bn,
respectively. Going forward, SMRA will launch four new projects in the remaining
2018 with one major launching of its sixth township, Summarecon Mutiara
Makassar (326ha). In the first phase of development, SMRA targets marketing
sales of Rp240bn from the launching of 200-300 unit houses with ticket price
around Rp1bn. The remaining project launching will be located in SMRA existing
township in Karawang, Bekasi and Serpong.
Potential interest expense savings in 2019 due to debt refinancing.
With
total bonds of Rp2tn due in 2018 and 2019, SMRA plans to issue continuous
bonds to refinancing the bonds with lower interest. Assuming lower blending
interest rate of 10-10.5% (Bond ratings: idA) from current of 11%, the company
would save around Rp13-23bn of interest expense in 2019, which represents
around 3-5% of our FY19F earnings forecast of Rp461bn.
Maintain Hold with TP of Rp700.
Despite relatively weak 1H18 earnings and
slow marketing sales, we still maintain our FY18F/19F earnings forecast, given
potential sizeable land plot sales in 4Q18 and interest expense savings in 2019.
We maintain our Hold rating on SMRA with TP of Rp700, representing FY18F P/E
target of 25.4x. Upside potential to our call might come from huge land plot sales
in last quarter to provide immediate boost to FY18F marketing sales and earnings.
Summarecon Agung
(
SMRA IJ
)
28 September 2018
Source: SMRA, IndoPremier Share Price Closing as of : 28-Sept-2018
SMRA IJ Results Note
2
Refer to Important disclosures on the last of this report
Fig. 1: Earnings to grow by 3% CAGR FY14-FY20F Fig. 2: Recurring and development proportion to revenue
Source: Company, IndoPremier Source: Company, IndoPremier
Fig. 3: 8M18 marketing sales only achieved 47% of guidance Fig. 4: Serpong and Bekasi remains the main contributors
Source: Company, IndoPremier Source: Company, IndoPremier
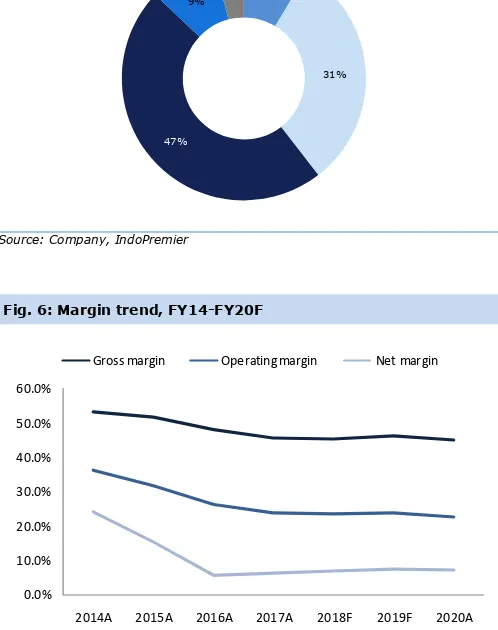
Fig. 5: Payment profile as of 8M18 Fig. 6: Margin trend, FY14-FY20F
Source: Company, IndoPremier Source: Company, IndoPremier
25.7%
2014A 2015A 2016A 2017A 2018F 2019F 2020F
Net profit Growth
(Rp bn)
2014A 2015A 2016A 2017A 2018F 2019F 2020F
Recurring income Development properties
(Rp bn)
8M18 8M17 8M16 8M15 8M14
(Rp Bn)
8M18 Marketing Sales % of FY
9%
31%
47%
9% 4%
Kelapa Gading Bekasi Serpong Bandung Karawang
25%
47% 27%
Cash Cash Installment Mortgage
0.0%
2014A 2015A 2016A 2017A 2018F 2019F 2020A
3
Refer to Important disclosures on the last of this report
Year To 31 Dec (RpBn) 2016A 2017A 2018F 2019F 2020F
Income Statement
Net Revenue 5,398 5,641 5,846 6,119 6,554
Cost of Sales (2,801) (3,074) (3,189) (3,282) (3,604)
Gross Profit 2,597 2,567 2,657 2,836 2,950
SG&A Expenses (1,192) (1,229) (1,298) (1,381) (1,477)
Operating Profit 1,406 1,339 1,358 1,455 1,473
Net Interest (532) (542) (489) (484) (473)
Forex Gain (Loss) 0 0 0 0 0
Others-Net 1 2 3 5 8
Pre-Tax Income 874 799 873 976 1,007
Income Tax (272) (267) (280) (297) (319)
Minorities (293) (170) (190) (217) (220)
Net Income 308 362 403 462 468
Balance Sheet
Cash & Equivalent 2,039 1,482 1,426 1,577 1,884
Receivable 548 661 685 720 816
Inventory 5,531 6,498 7,748 8,748 10,248
Other Current Assets 546 517 577 585 643
Total Current Assets 8,664 9,158 10,437 11,631 13,591
Fixed Assets - Net 11,096 11,179 10,505 9,091 7,896
Goodwill 0 0 0 0 0
Non Current Assets 1,001 1,315 1,560 1,850 2,196
Total Assets 20,771 21,663 22,513 22,583 23,696
ST Loans 1,041 906 1,406 2,406 3,406
Payable 369 423 0 405 444
Other Payables 2,446 3,458 3,600 3,757 4,090
Current Portion of LT Loans 362 1,489 1,841 1,200 700
Total Current Liab. 4,217 6,276 7,240 7,767 8,640
Long Term Loans 6,028 5,598 5,162 4,212 4,012
Other LT Liab. 2,399 1,436 1,505 1,696 1,840
Total Liabilities 12,645 13,309 13,908 13,675 14,491
Equity 1,467 1,467 1,467 1,467 1,467
Retained Earnings 4,776 5,043 5,373 5,754 6,130
Minority Interest 1,923 1,844 1,765 1,686 1,608
Total SHE + Minority Int. 8,166 8,354 8,606 8,908 9,205
Total Liabilities & Equity 20,810 21,663 22,513 22,583 23,696
SMRA IJ Results Note
4
Refer to Important disclosures on the last of this report
Year to 31 Dec 2016A 2017A 2018F 2019F 2020F
Cash Flow
Net Income (Excl.Extraordinary&Min.Int) 602 532 593 679 688
Depr. & Amortization 266 323 337 351 365
Changes in Working Capital (728) (1,297) (1,300) (972) (1,442)
Others (803) (223) 1,571 346 338
Cash Flow From Operating (663) (664) 1,200 404 (51)
Capital Expenditure (910) (720) 92 773 484
Others 101 91 132 132 132
Cash Flow From Investing (808) (630) 224 905 616
Loans 954 562 417 (591) 300
Equity 0 0 0 0 0
Dividends (72) (72) (72) (81) (92)
Others 699 (1,676) (630) (505) (541)
Cash Flow From Financing 1,581 (1,186) (286) (1,177) (333)
Changes in Cash 109 (2,481) 1,139 132 232
Financial Ratios
Gross Margin (%) 48.1 45.5 45.4 46.4 45.0
Operating Margin (%) 26.0 23.7 23.2 23.8 22.5
Pre-Tax Margin (%) 16.2 14.2 14.9 15.9 15.4
Net Margin (%) 5.7 6.4 6.9 7.5 7.1
ROA (%) 1.6 1.7 1.8 2.0 2.0
ROE (%) 3.9 4.4 4.8 5.3 5.2
ROIC (%) 3.1 3.2 3.6 3.9 3.9
Acct. Receivables TO (days) 23.2 38.3 41.2 41.2 41.4
Acct. Receivables - Other TO (days) 0.5 0.8 0.8 0.7 1.4
Inventory TO (days) 0.5 0.5 0.4 0.4 0.4
Payable TO (days) 28.1 47.0 46.7 44.4 43.0
Acct. Payables - Other TO (days) 0.0 0.0 0.0 0.0 0.0
Debt to Equity (%) 91.0 95.7 97.7 87.8 88.2
Interest Coverage Ratio (x) 0.5 0.5 0.5 0.4 0.4
Net Gearing (%) 66.0 77.9 81.1 70.1 67.7
Head Office
PT INDO PREMIER SEKURITAS
Wisma GKBI 7/F Suite 718
Jl. Jend. Sudirman No.28
Jakarta 10210 - Indonesia
p +62.21.5793.1168
f +62.21.5793.1167
INVESTMENT RATINGS
BUY : Expected total return of 10% or more within a 12-month period HOLD : Expected total return between -10% and 10% within a 12-month period SELL : Expected total return of -10% or worse within a 12-month period
ANALYSTS CERTIFICATION.
The views expressed in this research report accurately reflect the analysts personal views about any and all of the subject securities or issuers; and no part of the research analyst's compensation was, is, or will be, directly or indirectly, related to the specific recommendations or views expressed in the report.
DISCLAIMERS