CHAPTER IV
THE RESULT OF THE STUDY
This chapter described the obtained data of the students’ vocabulary score after and before taught by using word wall technique. The presented data consisted of mean, standard deviation, standard error and analysis of hypothesis.
A. Descripton of the data
1. The result of Pre-test Score
a. The result of Pre Test Score of Experiment Class
The students’ pre-test score of experiment class were distributed in the following table (see appendix 5) in order to analyze the students’ knowledge before conducting the treatment. To determine the frequency of score, percent of score, valid percent and cumulative percent calculated using SPSS 16 (see appendix 7).
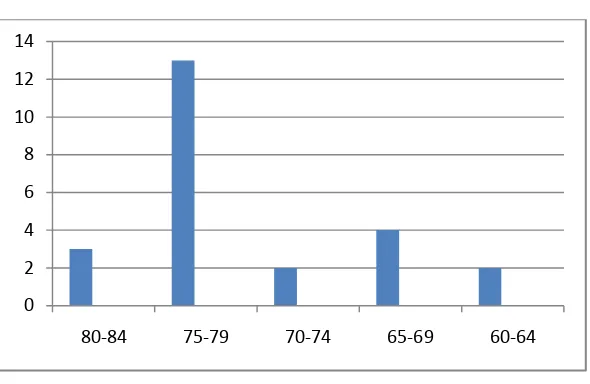
The distribution of students’ pre-test score can also be seen in the following figure.
Figure 4.1
Histogram of Frequency Distribution of Experimental Pre-Test Score
It can be seen from the figure above, the students’ pretest score in experimental class. There was a student who got score 60 and 63. There were two students who got score 65, a students who got score 67 and a student who got score
0 2 4 6 8 10 12 14
80-84 75-79 70-74 65-69 60-64
68. There were a student who got score 70 and a student who got score 72. There were three students who got score 75, three students who got score 76, a student who
got score 77, a student who got score 78 and a student who got score 79. There were three students who got score 80.
The next step, the result calculated the scores of mean, standard deviation,
and standard error using SPSS 16 program and manual calculation as follows:
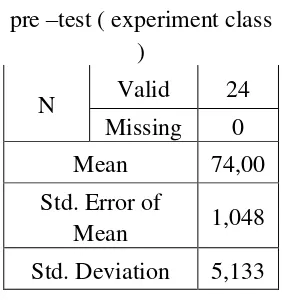
Table 4.1 the Calculation of Mean, SD and SE using SPSS 16 Statistics
pre –test ( experiment class )
N Valid 24
Missing 0
Mean 74,00
Std. Error of
Mean 1,048
Std. Deviation 5,133
Based on the data above, it was known the highest score was 80 and the
lowest score was 60. For the result of manual calculation, it was found that the mean score of pre-test was 74,00, the standard deviation was 5,133 and for the standard
error mean was 1,048 (see appendix 7).
Then, based on the table above, the result calculation using SPSS 16, it was found that the mean of score pre-test was 74,00, the standard deviation 5,133 and the
standard error of mean of the pre-test score was 1,048. b. The result of Pre-test Score of Control Class
The distribution of students’ pre-test score can also be seen in the following figure.
Figure 4.2
Histogram Frequency Distribution of Control Pre-Test Score
It can be seen from the figure above, the students’ pretest score in experimental class. There were a student who got score 61. There were four students
who got score 65 and two students who got score 69. There were two students who got score 70 and a student who got score 72, a student who got score 73, and a
student who got score 74. There were seven students who got score 75, a students who got score 76, two students who got score 79. There were a students who got score 80.
The next step, the result calculated the scores of mean, standard deviation, and standard error using SPSS 16 program and manual calculation as follows :
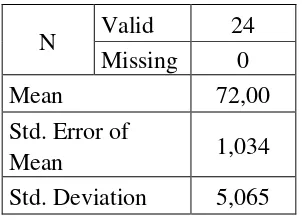
Table 4.2 the Calculation of Mean, SD and SE using SPSS 16
Statistics pre –test (control class)
0 2 4 6 8 10 12
N Valid 24 Missing 0
Mean 72,00
Std. Error of
Mean 1,034
Std. Deviation 5,065
Based on the data above, it was known the highest score was 80 and the
lowest score was 61. For the result of manual calculation, it was found that the mean score of pre-test was 72,00, the standard deviation was 5,065 and for the standard error mean was 1,034 (see appendix 7).
Then, based on the table above, the result calculation using SPSS 16, it was found that the mean of score pre-test was 72,00, the standard deviation 5,065 and the
standard error of mean of the pre-test score was 1,034. c. Testing Normality and Homogenity Using SPSS 16
1. Testing of Data Normality
It used to know the normality of the data that was going to be analyzed whether both groups have normal distribution or not. Because of that, the
normality test used SPSS 21 to measure the normality of the data. Table 4.3 Test of Normality Distribution Test on the
Pre-Test Score of the Experiment and Control Group Using SPSS 16
One-Sample Kolmogorov-Smirnov Test experimen
t Contol
N 24 24
Normal Parametersa Mean 67.12 69.75
Std. Deviation 8.258 7.073 Most Extreme
Differences
Absolute .225 .188
Positive .114 .080
Kolmogorov-Smirnov Z 1.104 .920
Asymp. Sig. (2-tailed) .175 .366
a. Test distribution is Normal. Description:
If respondent > 50 used Kolmogorov-Sminornov
If respondent < 50 used Saphiro-Wilk
The criteria of the normality test pre-test was if the value of (probability value/critical value) was higher than or equal to the level of significance alpha defined
(r > a), it meant that the distribution was normal. Based on the calculation using SPSS 16 above, the value of (probably value/critical value) from pre-test of the experiment
and control class in Kolmogorov-Smirnov table was higher than level of significance alpha used or r = 0,175 > 0,05 (Experiment) and r = 0,366 > 0,05 (Control). So, the distributions were normal. It meant the students’ score of pre-test had normal distribution.
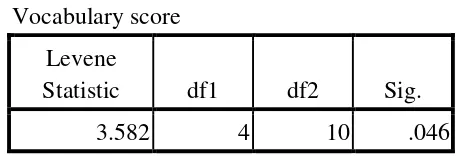
2. Testing of Data Homogenity
Table 4.4 Homogeneity Test Test of Homogeneity of Variances Vocabulary score
Levene
Statistic df1 df2 Sig.
3.582 4 10 .046
The criteria of the homogeneity pre-test was if the value of (probability value/critical value) was higher than or equal to the level significance alpha defined (r > a), it meant the distribution was homogeneity. Based on the
value) from pre-test of experiment and control class on homogeneity of variance in sig column was known that p-value was 0,046. The data in this study fulfilled
homogeneity since the p-value was higher or r = 0,046 > 0,05.
2. The Result of Post-test Score
a. The Result of Post-test of Experiment Class
The students’ post-test score of experiment class were distributed in the following table (see appendix 5) in order to analyze the students’ knowledge after conducting the treatment. To determine the frequency of score, percent of score, valid percent and cumulative percent calculated using SPSS 16 (see appendix 7).
The distribution of students’ pre-test score can also be seen in the following figure.
Figure 4.3
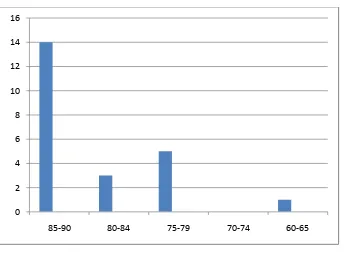
Histogram of Frequency Distribution of Experimental Post-Test Score
It can be seen from the figure above, the students’ post-test score in experimental class. There were one student who got score 65. There were two
0 2 4 6 8 10 12 14 16
students who got score 75, one student who got score 76, and two students who got score 79. There were two students who got score 80, one student who got score 81.
There were two students who got score 85, two students who got score 86, one students who got score 87, four studens who got score 89, and There were five students who got score 90.
The next step, the result calculated the scores of mean, standard deviation, and standard error using SPSS 16 program and manual calculation as follows:
Table 4.5 the Calculation of Mean, SD and SE using SPSS 16 Statistics
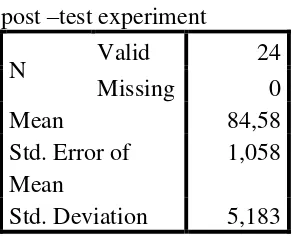
post –test experiment
N Valid 24
Missing 0
Mean 84,58
Std. Error of Mean
1,058
Std. Deviation 5,183
Based on the data above, it was known the lowest score was 65 and the highest score was 95. Then, based on the table above, the result calculation using
SPSS 16, it was found that the mean of score post-test of the experiment class was 84,58, the standard deviation 5,183 and the standard error of mean of the post-test score was 1,058.
b. Result of post test control class
The distribution of students’ pre-test score can also be seen in the following figureThe students’ post-test score of experiment class were distributed in the following table (see appendix 5) in order to analyze the students’ knowledge after conducting the treatment. To determine the frequency of score, percent of score, valid percent and cumulative percent calculated using SPSS 16 (see appendix 7).
The distribution of students’ pre-test score can also be seen in the following figure
Figure 4.4
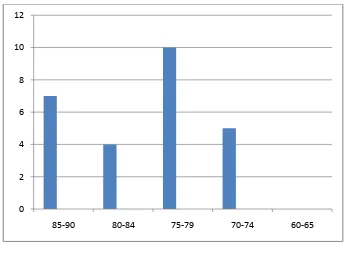
Histogram of Frequency Distribution of control Post-Test Score
It can be seen from the figure above, the students’ post-test score in contol class. There were no one student who got score 60 until 65. There were two students
who got score 70, a student got score 73, and two students who got score 74. Where were four students who got score 75, three students who got score 78, and three students who got score 79. There were two students who got score 80, one student
who got score 82 and a students got sccore 83. There were two students who got score 85, a students who got score 86, a students who got score 87, a studens who
got score 89.
0 2 4 6 8 10 12
The next step, the result calculated the scores of mean, standard deviation, and standard error using SPSS 16 program and manual calculation as follows:
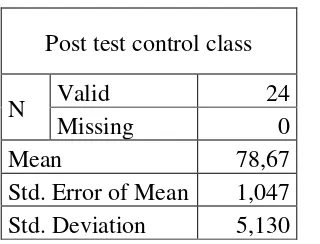
Table 4.6
the Calculation of Mean, SD and SE using SPSS 16
Post test control class
N Valid 24
Missing 0
Mean 78,67
Std. Error of Mean 1,047 Std. Deviation 5,130
Based on the data above, it was known the lowest score was 65 and the
highest score was 95. Then, based on the table above, the result calculation using SPSS 16, it was found that the mean of score post-test of the cotrol class was 78,67, the standard deviation 5,130 and the standard error of mean of the post-test score
was 1,047.
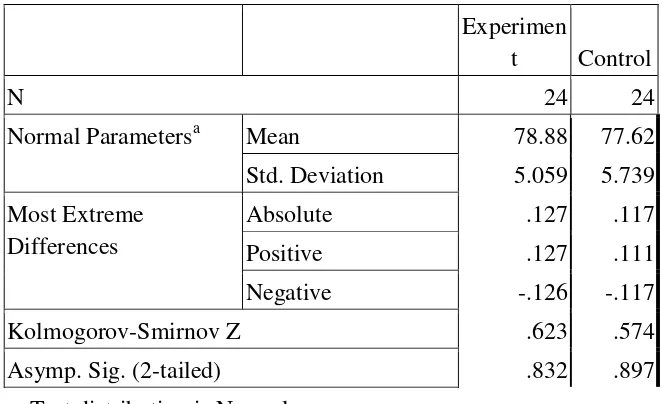
c. Testing Normality and Homogeneity using SPSS 21 1) Testing of Data Normality
It was used to know the normality of the data that was going to be
analyzed whether both groups have normal distribution or not. Because of that, the normality test used SPSS 16 to measure the normality of the data.
Table 4.7 Test of Normality distribution test of
Post-Test score of the Experiment and Control group using SPSS 16
Experimen
t Control
N 24 24
Normal Parametersa Mean 78.88 77.62
Std. Deviation 5.059 5.739 Most Extreme
Differences
Absolute .127 .117
Positive .127 .111
Negative -.126 -.117
Kolmogorov-Smirnov Z .623 .574
Asymp. Sig. (2-tailed) .832 .897
a. Test distribution is Normal. Description:
If respondent > 50 used Kolmogorov-Sminornov
If respondent < 50 used Saphiro-Wilk
The criteria of the normality test post-test was if the value of (probability value/critical value) was higher than or equal to the level of significance alpha defined (r > a), it meant that the distribution was normal. Based on the calculation using SPSS
16 above, the value of (probably value/critical value) from post-test of the experiment and control class in Kolmogorov-Smirnov table was higher than level of significance
alpha used or r = 0,832 > 0,05 (Experiment) and r = 0,839 > 0,05 (Control). So, the distributions were normal. It meant that the students’ score of post-test had normal distribution.
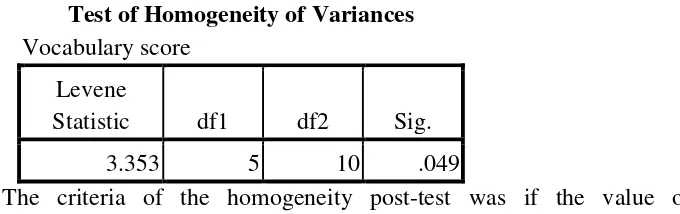
2) Testing of Data Homogeneity
Table 4.8 Homogeneity Test
Test of Homogeneity of Variances Vocabulary score
Levene
Test of Homogeneity of Variances Vocabulary score
Levene
Statistic df1 df2 Sig.
3.353 5 10 .049
The criteria of the homogeneity post-test was if the value of
(probability value/critical value) was higher than or equal to the level significance alpha defined (r > a), it meant that, the distribution was
homogeneity. Based on the calculation using SPSS 16 program above, the value of (probably value/critical value) from post-test of experiment and control class
on homogeneity of variance in sig column was known that p-value was 0,049. The data in this study fulfilled homogeneity since the p-value was higher or r =
0,049 > 0,05.
B. The Result of Data Analysis
1.Testing Hypothesis using ttest Manual Calculation
The level of significance used 5%. It meant that the level of significance of the refusal null hypothesis in 5%. The level of significance decided at 5% due to the hypothesis type stated on non-directional (two-tailed test). It meant that the hypothesis
cannot directly the prediction of alternative hypothesis. To test the hypothesis of the study used t-test statistical calculation. First, it calculated the standard deviation and
the standard error of X1 and X2. It was found the standard deviation and the standard error of post-test of X1 and X2 at the previous data presentation. It could be seen in this following table:
Table 4.9 the Standard Deviation and Standard Error of X1 and X2
Variable The Standard
Deviation
X1 5,133 1,070
X2 1,048 1,047
X1 = Experimental Class
X2 = Control Class
The table showed the result of the standard deviation calculation of X1 was 5,241 and
the result of the standard error mean calculation was 1,070. The result of the standard deviation calculation of X2 was 5,130 and the result of the standard error mean
calculation was 1,047
The next step, the writer calculated the standard error of the differences mean between
X1 and X2 as follows:
Standard error of mean of score difference between Variable I and Variable II :
SEM1– SEM2 =√ SEM12 + SEM22
= (1,55)2+ (1,47)2
= √ 2,4025 + 2,1609
= √4,5634 = 2,1362 = 2,13
to =
M1 – M2 SEm 1− SEm 2
to =
75,88−69,62 2,13
= 6,62
2,13= 2,9389 = 2, 94
If t-test (t-observed) ≥ t-table, Ha is accepted and Ho is rejected
If t-test (t-observed) < t-table, Ha is rejected and Ho is accepted
Then, the writer interpreted the result of t-test; previously, the writer accounted the degree of freedom (df) with the formula:
Df = (N1+N2) -2
= 23+ 24 – 2 = 45
The significant levels choose at 5%, it meant the significant level of refusal of null hypothesis at 5%. The significance level decided at 5% to the hypothesis stated on non-directional (two-tailed test). It meant that the hypothesis cannot direct
the prediction of alternative hypothesis. The calculation above showed the result of ttest calculation as in the table follows:
Table 4.10 the Result of ttest Manual Calculation
Variable T observed
T table
Df/db
5% 1%
X1-X2 2,94 2,02 2,69 45
Where:
X1 = Experimental Class
X2 = Control Class
T observe = the calculated Value
T table = the distribution of t value
Based on the result of hypothesis test calculation, it was found that the value of tobserved was greater than the value of table at 1% and 5% significance level or 2,02 < 2,93
>2,69. It means Ha was accepted and Ho was rejected. It could be interpreted based on the
result of calculation that Ha stating that crosswords puzzle give influences toward
student’s scores in increasing English vocabulary mastery was accepted and Ho
stating that crosswords puzzle does not give influences toward student’s scores in increasing English vocabulary mastery was rejected. It means that teaching vocabulary using crosswordspuzzle gave significant effect on the students’ vocabulary score of the second grade of SMP Muhammadiyah Palangka Raya.
2. Testing Hypothesis using SPSS 16 Program
The result of the t-test using SPSS 16 program was used to support the manual calculation of the t-test. It could be seen as follows:
Table 4.11 the Standard Deviation and the Standard Error of X1 and X2 using SPSS 21
Group Statistics
Label N Mean
Std. Deviation
Std. Error Mean
Score X1 24 83.96 6.636 1.355
X2 24 78.67 5.130 1.047
The table showed the result of the standard deviation calculation of X1 was 6.636and the result of the standard error of mean calculation was 1.355. The result of the standard deviation calculation X2 was 5.130and the result of the standard
Table 4.12
the calculation of T-test using SPSS 16
Independent Samples Test Levene's
Test for Equality of
Variances t-test for Equality of Means
F Sig. T df
Sig. (2-tailed)
Mean Differ
ence
Std. Error Differe
nce
95% Confidence Interval of the
Difference Lower Upper
score
Equal variances
assumed 2.118 .152 3.091 46 .003 5.292 1.712 1.845 8.738 Equal variances
not assumed 3.091 43.256 .003 5.292 1.712 1.839 8.744 The table showed the result of t-test calculation using SPSS 16 program. Since the result of post-test between experiment and control group had difference score levene’s test for equality of variance, the value of sig was greater than 0,05. So, both of group were homogeny. It meant the t-test calculation used at the equal variance assumed. It found that the value of sig (two-tailed) was 0,003 and the result
of tobserved was 3,091. The result of mean difference between experimental and
control class was 5,292 and the standard error difference between experimental and
control class was 1,712.
3. Interpretation
To examine the truth of the false of null hypothesis stating that the students
taught vocabulary by word wall technique, the result of sig (two-tailed) was lower than 0,05 or 0,003 < 0,05, so Ha was accepted and H0 was rejected. The
result of the degree of freedom (df) was 50, it found from total number of the students in both group minus 2. The following table was the result of tobserved and
ttable from df at 5% level.
Table 4.13 the Result ttest using SPSS 16
Variable T observed
T table
Df/db
5% 1%
X1-X2 2,94 2,02 2,69 45
Where:
X1 = Experimental Class
X2 = Control Class
T observe = the calculated Value
T table = the distribution of t value
Df/db = Degree of freedom
Based on the result of hypothesis test calculation, it was found that the value
of tobserved was greater than the value of table at 1% and 5% significance level or 2,02 <
2,94 >2,69. It means Ha was accepted and Ho was rejected. It could be interpreted based
on the result of calculation that Ha stating that crosswords puzzle give influences
toward student’s scores in increasing English vocabulary mastery was accepted and Ho stating that crosswords puzzle does not give influences toward student’s scores in
vocabulary using crosswordspuzzle gave significant effect on the students’ vocabulary score of the second grade of SMP Muhammadiyah Palangka Raya.
C. Discussion
The result of data analysis showed that there was effect of using crossword puzzle technique toward the students’ vocabulary mastery at the eighth graders of SMP Muhammadiyah Palangka Raya. It can be seen from the mean score between pre-test (73,71) and post-test (83,96) of the experiment class. It indicated that the students’ score increased after conducting the treatment.
In teaching learning process, tought vocabulary by using crossword puzzle technique used by the writer to teach the students. Crossword puzzlel technique could
make an interaction between teacher and students. In the treatment, the students got explanation about teaching learning activity. First, the teacher was explained
crossword puzzle and showed the example to the students. Second, the teacher used picture and words in crossword puzzle to different among noun, verd, and adjective. Third, the teacher wrote some word based on the material and put the word to the
crossword puzzle based o. Then, Students and teacher translated the text based vocabulary that has given. After translating the text students and teacher were
reviewed the vocabulary by game. It did step by step so that the students can remind the vocabulary. The last, the teacher reviewed the vocabulary that had given in
previous meeting.
According to Alfitra Gaeda, he said taht “ Who found that use guessing word strategies in teaching English vocabulary making the transition to independent learning can be easier and more efficient.”1
It meant that the technique accepted by
1
students. In the crossword puzzle technique students not only wrote the answer but students learned about how to read the words that they wrote.
For all these reasons, crosswords make a terrific educational tool, and teachers and homeschoolers will probably continue to use them for many years to come.2it meant that crossword puzzle can be one of educational tool that made the
condition of learning has been relax, and the teacher could make their puzzle based on the subject or material that discused on the their class.
According to Michalewiez, puzzle are engaging and thought-provoking.3 Based on the mind that puzzle is a way for the teacher engaged students on the problems directly and it made the students more creative and increase their thinking.
Based on the theory above can be concluded crossword puzzle was one way to warm up students’ interest and increase their motivation in remind vocabulary. Beside, crosswords puzzle motivated the students. Through crossword puzzle as a technique in learning activity, the teacher can motivated the students to learn English
in more enjoyable and interesting way. So, the writer helped the students to find a good and enjoyable the lesson which was appropriate to the way the students think and the students’ age.
Hatch and Brown. They say, “Vocabulary is the foundation to build languages, which plays a fundamental role in communication”.4
it explained that vocabulary is
the core of language to make another understood to each other.
The data were calculated using ttest formula. Manual calculation showed that
the tobserved was 0,879. The criteria of the test was if tobserved > ttable Ha was received, it
meant that there was effect. Then, if tobserved < ttable H0 was rejected and it meant there
2
http://vocabulary.co.il/blog/learning_vocabulary/teaching-with-crossword-puzzles/15:23
3
www.sciencepublishinggroup.com/j/hss, Published online, p.49 July 10, 2013
4
was no effect. Then, to know ttable, it used formula Df = N+N-2, and N = 24. So, Df =
24+23-2 = 45.
The tobserved was consulted with ttable which df = 50. Significant standard 5% =
2,02. So, after comparing the tobserved with the ttable it was found that the tobserved was
higher than the value of ttable at 5% significance level or 2,94 > 2,02. From the
calculation above, it can be seen that tobserved > ttable. It can be concluded that Ha
accepted and H0 was rejected.
Then, the data was calculated using ttest SPSS 16, it was found that the value of
ttest was higher than ttable at 1% level of significance ttest = 2,93 > ttable = 2,69. This
finding indicated that the alternative hypothesis stating that there was statistically
significant differences the total pre and post test between students who learn through crossword puzzle and traditional method at the eighth graders of SMP
Muhammadiyah Palangka Raya was accepted. On the contrary, the null hypothesis stated that there was no statistically significant differences the total pre and post test