Crop monitoring for
improved food security
Proceedings of the Expert Meeting
Vientiane, Lao People’s Democratic Republic,
17 February 2014
RAP PUBLICATION 2014/28
the Food and Agriculture Organization of the United Nations and
the Asian Development Bank
Bangkok, 2015
Editor: Mukesh K. Srivastava
The designations employed and the presentation of material in this information product do not imply the expression of any opinion whatsoever on the part of the Food and Agriculture Organization of the United Nations (FAO), or of the Asian Development Bank (ADB) concerning the legal or development status of any country, territory, city or area or of its authorities, or concerning the delimitation of its frontiers or boundaries. The mention of specific companies or products of manufacturers, whether or not these have been patented or trademarked, does not imply that these have been endorsed or recommended by FAO or ADB in preference to others of a similar nature that are not mentioned. The views expressed in this information product are those of the author(s) and do not necessarily reflect the views or policies of FAO or ADB or its Board of Governors, or the governments it represents. Neither FAO nor ADB guarantees the accuracy of the data included in this publication and accepts no responsibility for any consequence of their use.
ISBN 978-92-5-108678-0
© FAO and ADB, 2015
FAO and ADB encourage the use, reproduction and dissemination of material in this information product. Except where otherwise indicated, material may be copied, downloaded and printed for private study, research and teaching purposes, or for use in non-commercial products or services, provided that appropriate acknowledgement of FAO and ADB as the source and copyright holders is given and that neither FAO’s nor ADB’s endorsement of users’ views, products or services is implied in any way.
All requests for translation and adaptation rights, and for resale and other commercial use rights should be made via www.fao.org/contact-us/licence-request or addressed to [email protected].
FAO information products are available on the FAO website (www.fao.org/publications) and can be purchased through [email protected]. ADB information products are available on the ADB website (www.adb.org/publications).
ADB recognizes “China” at the People’s Republic of China.
Photo credits:
Foreword... v
II. Session 1: Estimation of land cover, land use and crop area ... 4
III. Session 2: Crop yield monitoring and forecasting ... 7
IV. Session 3: Crop yield estimation using probability surveys and objective measurements ... 9
V. Panel conclusions ... 12
Annex 1: Opening addresses
...14
1. Opening address of Hiroyuki Konuma, ADG, FAO ... 14
2. Opening remarks Douglas H. Brooks, ADB ... 16
Annex 2: Timetable
...18
Annex 3: List of participants
...20
Part II: Technical papers
...25
Papers presented 1. Dot sampling method for area estimation Issei Jinguji... 27
2. Agricultural Land Information System (ALIS) to support area sample survey Shoji Kimura... 49
3. Adoption of Agricultural Land Information System (ALIS) for agricultural area estimation Rodrigo N. Labuguen, Anna Christine D. Durante and Lea E. Rotairo... 61
4. Rice crop monitoring in Thailand using field server and satellite remote sensing P. Rakwatin, A. Prakobya, T. Sritarapipat, B. Khobkhun, K. Pannangpetch, S. Sobue, Kei Oyoshi, T. Okumura and N. Tomiyama... 79
5. A new method to estimate rice crop production and outlook using Earth Observation satellite data Toshio Okumura, Shinichi Sobue, Nobuhiro Tomiyama and Kei Ohyoshi... 85
6. Crop planting and type proportion method for crop acreage estimation of complex agricultural landscapes Bingfang Wu and Qiangzi Li... 93
7. Satellite remote sensing and GIS-based crops forecasting & estimation system in Pakistan Ijaz Ahmad, Abdul Ghafoor, Muhammad Iftikhar Bhatti, Ibrar-ul Hassan Akhtar, Muhammad Ibrahim and Obaid-ur-Rehman... 95
Contents
iii CONTENTS
8. Use of remote sensing in crop forecasting and assessment of impact of natural disasters: operational approaches in India
Shibendu Shankar Ray, Mamatha Neetu, S. and Sanjeev Gupta... 111 9. Remote sensing-based crop yield monitoring and forecasting
Tri Setiyono, Andrew Nelson and Francesco Holecz... 123 10. Satellite-based crop monitoring and estimation system for food security
application in Bangladesh
Hafizur Rahman ... 133 11. Rice objective yield survey in Japan
Masahiro Hosaka... 149 12. Sampling frame of square segment by points for rice area estimation
Mubekti Munandar... 157 13. Experience of crop cutting experiments in Thailand
Supaporn Bongsunun and Kimihiko Eura... 169 14. Experiences of crop cutting experiments in Bangladesh for annual yield
estimation of rice
Bidhan Baral... 177 15. The agricultural survey improvement program in Islamic Republic of Iran
Nematzadeh Alidash Mehrdad... 181 16. Application of spatial information technology to crops production survey
in the NBS of China
Wang Minghua and Wei Ge... 193
Reference papers
1. Methodology development for estimating sago stock by using area frame in West Papua, Indonesia
Mubekti Munandar and Laju Gandharum... 199 2. Crop yield estimation surveys in India
Rajiv Mehta and Arvind K. Srivastava... 209 3. An assessment of pre- and within-season remotely sensed variables for forecasting
corn and soybean yields in the United States
David M. Johnson... 219
The Food and Agriculture Organization of the United Nations (FAO) is mandated to provide technical assistance to countries to build their capacities to produce timely and reliable information at the country level for mitigating food insecurity risks and for planning related government interventions and programmes.
Estimates and forecasts of crop area and yield are of critical importance to policy makers for the planning of agricultural production and monitoring of food supply. The possible links between poverty and crop yields, which depend upon a variety of factors such as cultivation practices, availability of irrigation, access to resources to buy agricultural inputs for adoption of new technology, cannot be fully understood without reliable estimates of crop area and yields. In the absence of reliable information on crop productivity the reasons behind food insecurity of agricultural households cannot be precisely identified.
The research agenda of the Global Strategy to Improve Agricultural and Rural Statistics foresees the potential of alternative methods and opportunities such as advances in satellite-based technology, for improving crop estimation and monitoring. Many institutions in Asia and Pacific region are using remotely sensed data in conjunction with conventional statistical methodologies to estimate the crop area and to forecast yield. These methods have seen a diverse degree of success, depending upon the nature of agriculture and/or access to advanced satellite imagery. A comparative study of these methods is needed to formulate technical recommendations to the countries who want to adopt these new technologies as an integral part of their statistical programme.
The Expert Meeting on Crop Monitoring for Improved Food Security, organized as a side event of the 25th Session of the Asia and Pacific Commission on Agricultural Statistics (APCAS) held in Vientiane, Lao
PDR, provided an occasion for over 50 experts from Asia and other regions to deliberate on best practices and methodological issues, and to identify challenges for future research work. The partnership with the Asian Development Bank (ADB) in the organization of the meeting enriched the technical content of the meeting.
This publication summarizes the outcomes of the deliberations in the meeting and puts together a series of technical papers presented in the meeting and some reference papers. We hope this document will be a useful reference document for those interested in improving the current agricultural statistics using modern technologies. FAO remains committed to working with all stakeholders in its endeavour to make a desired contribution towards the sustainable development of agricultural and rural statistics systems of the countries in this region and elsewhere.
Hiroyuki Konuma
Assistant Director-General and Regional Representative FAO Regional Office for Asia and the Pacific
Foreword
v FOREWORD
199
PART II: REFERENCE PAPERS
Methodology development for estimating sago stock by using area frame in West Papua, Indonesia
Mubekti Munandar
1and Laju Gandharum
1 Senior Researcher
Center of Technology for Natural Resources Inventory, Agency for the Assessment and Application of Technology (BPPT)
Build. Fl. 12, Thamrin St., Jakarta, Indonesia E-mail: [email protected]
Key words: Spatial Statistics, Area Frame Sampling, Remote Sensing, Sago Palm
ABSTRACT
Sago palm belongs to the Genus Metroxylon, Family Palmae, and a characteristic is the accumulation of a huge amount of starch in its stem. An invaluable resouce of starchy food, sago palm could play an important role in respect to possible food shortages in the world in the future. Sago palm is a tropical plant which not only grows in the dry lands but also grows with high adaption to low-lying wetlands such as fresh water swamp, peat swamp or brakish water. The origin of sago palm is believed to be the area extending from the Moluccas and Papua of Indonesia to New Guinea. However, the attention given to exploring the potential of sago stock has not been adequate in Papua. The objective of this study is to develop a spatial statistics method for mapping and estimating the sago stock in Inanwatan District, Sorong Selatan Regency, West Papua. Area frame sampling of square segment method is applied for estimating sago stock, which involves: 1) stratification of study area by using high resolution of satellite data; 2) design of a sample frame survey; 3) field survey for ground truthing; and 4) data analysis. The results show that the total study area is 13,315 ha consisting of 2,892 ha of non-sago forest and 10,423 ha of sago forest. Sago forest is divided into 3 strata, namely low density, medium density, and high density, which have an area of 630 ha, 392 ha, and 9,401 ha respectively. The population of ripe sago palm in low density, medium density, and high density is 22,680 stands, 32,928 stands, and 549,018 stands equal to 4,930 tons, 7,226 tons, and 109,044 tons of sago starch, respectively. So the total sago stock in the whole study area is 121,200 tons of sago starch.
1. Background
Sago palm belongs to the Genus Metroxylon, Family Palmae, whose members accumulate a huge amount of starch content in the stem (Flach 1997) and is a significant source of raw material of high economic value (Abd-Aziz 2002). Furthermore, Ave (1977) said that sago palm has been described as man’s oldest food plant. Contrary to its important role in economic and cultural aspects for a hundred years (Oates 1999), currently sago palm is still an underutilized plant.
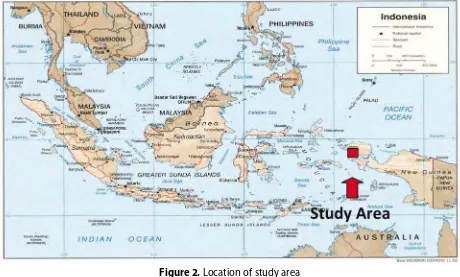
It is estimated that Indonesia has 1,398,000 hectares of sago palms; of which 1 250 000 hectares are sago forest growing wildly and 148,000 hectares are cultivated sago palm. Meanwhile, Papua an island belonging to Indonesia, has 1,200,000 hectares of sago palm forest and 14,000 hectares of cultivated sago palm (Flach 1997). Ngudiwaluyo et al. (1996), referring to several sources, state that Indonesia has only about 1 million hectares of sago palm, whereas Kertopermono (1996) estimates 1.5 million hectares, but both researchers agree that 90 percent of Indonesian sago palm is in Papua (including West Papua). In West Papua, sago palms have been reported to exist mainly in low-lying marshlands and wetlands of southwestern Manukwari (Figure 1). Among the local people of West Papua, part of the sago palm and its product is utilized as food stuffs in those areas while the rest are exported to other regions.
200 PART II: REFERENCE PAPERSMethodology development for estimating sago stock by using area frame in West Papua, Indonesia
Interest in this palm species has increased considerably in the last three decades because of its advantages of being economically acceptable, relatively sustainable, environmentally friendly, uniquely versatile, vigorous, and it promotes socially stable agroforestry systems (Stanton 1993). In Indonesia, the sago palm has recently gained interest, especially as one of alternatives for subsitution of staple food in respect to national food security. However, information on its present location and distribution is missing, and it cannot be ascertained whether there is enough supply of sago to drive and sustain a large scale sago starch industry.
The objective of this study is to apply a spatial statistics method to estimate the sago stock in West Papua (Figure 2). High resolution Geo-eye satellite data is employed to stratified sago palm forest, and an area frame survey is constructed for deriving field data of sago palm. The location of the study is in the ANJ Agro Annual Work Plan Area, South Sorong, West Papua.
Figure 1. Physical visualization of sago forest environment in West Papua
201
PART II: REFERENCE PAPERS
Methodology development for estimating sago stock by using area frame in West Papua, Indonesia
2. Methods
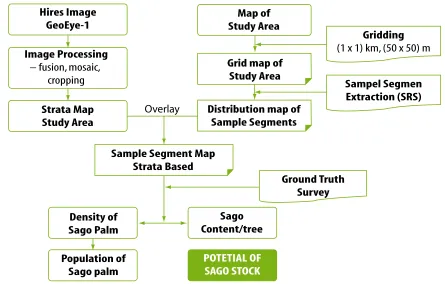
Figure 3 shows the overall flowchart of activities starting from preparation up to data analysis. There are three main activities to estimating sago stock in the study area: 1) developing area frame sampling; 2) a ground truthing survey; and 3) data analysis. The following discussion is a more detailed description of each work.
Figure 3. Flowchart of activity to estimate sago stock in South Sorong
Strata Map
2.1 Developing area frame sampling
The sago forest inventory in South Sorong regency, West Papua will be done by area frame sampling of square segments. Rules-based spatial statistics are used in the construction of the sampling frame. The stages of the contruction includes stratifying the study area, defining sample size, and extracting sample segments.
Stratification of study area
Stratification is the division of a population Ω of size N into H non-overlapping subpopulation Ωh (strata) of size Nh. The closer the behaviour of the Nh elements within each stratum, the more eficient the stratification (Gallego 1989). In this research, the study area is stratified into 4 catagories based on domination of sago palm canopy interpreted from satellite data, namely:
● Strata-0: Non-Sago Forest;
● Strata-1: Low Density (domination of palm canopy around 1-30 percent); ● Strata-2: Medium Density (domination of palm canopy around 30-60 percent); ● Strata-3: High Density (domination of palm canopy around 60-100 percent).
202 PART II: REFERENCE PAPERSMethodology development for estimating sago stock by using area frame in West Papua, Indonesia
Bahri (2011) that the key to interpretation of sago palm data is recognized by star canopy with 10 m length, irreguler pattern, and growing in low land.
Definition of sample size
Definition of sample size refers to the guidence of forest inventory by the Ministry of Forest (2007), where the number of the sample size is defined to have error level of 5 percent and the size of the sample segment is 0.25 hectares. The mathematical formula to count the sample size is as follows:
(1)
where,
n = sampel size
SE = Sampling Error (5 percent)
CV = Variance of volume from the average (percent) t = Convidence level of 95 percent (t value close to 2)
The Ministry of Forest states that Indonesian forests have 65-75 percent variance of volume based on the empirical data. By the asumption of 80,000 hectares of forest consessions, the size of the sample segment is around 0.2-0.3 percent. The size of the sample segment in this research is defined as 0.5 percent of the study area, that is assumed to meet the 5 percent error level.
Extraction of sample segment
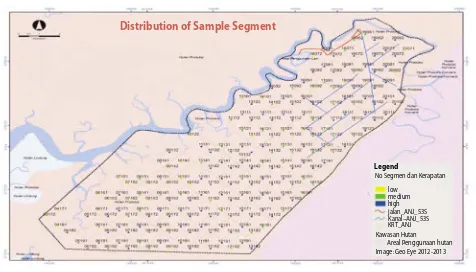
The sampling frame of a square segment sized 50 m x 50 m is used for extracting a sample segment so that it is necessary to convert a digital map of the study area from a vector map into a grid map. The statistical rule applied to extracting a sample segment is SRS (Simple Random Sampling) in order to have a good spatial distribution of selected sample segments. GIS software is employed to process spatial-based digital maps. To do so, the first step is to divide the study area into a large grid 1 km x 1 km in size and then divide those grids into smaller subgrids 50 m x 50 m in size, so that one large grid consists of 400 small grids. The second step is to go to the first large grid (upper left) and randomly select a small grid sample segment of 0.5 percent. The third step is to copy the selected sample segments pattern and paste it to the other large grids. To know the distribution and number of selected segments in each stratum, it is necessary to overlay the strata map and the extracted sample segment map. Each selected sample segment has its own identity such as stratum, geographical coordinate and number of randomization. The identity of the selected segment is important for not only ground surveying but also field data processing.
2.2 Ground-truth survey
A ground-truth survey conducted for each selected sample segment aims to derive parameter data of quantitative densities and starch contents of sago palm. Even though, high resolution satellite images are available, GPS is the only a tool to find the exact location of each selected sample segment because of difficulties in finding physical features of sago palm forest on the image.
203
PART II: REFERENCE PAPERS
Methodology development for estimating sago stock by using area frame in West Papua, Indonesia
( Tbp), the measurement of diameter and height are only for mature trees because that stage is considered to contain sago starch.
2.3 Data analysis
Density estimate
Density of sago palm forest is the average of sago stand per hectare for each growing stage, i.e. Before Mature Stage (BMT), Mature Stage (MT), and After Mature Stage (LMT). The mathematical formula to count sago palm density is as follows:
Where,
= sago palm density (stand/ha) in strata,
= area of sampel segment,
= total of sample segment in strata h,
= total sago stand in sample segment ith
strata h
Population estimate
Sago palm population is calculated by multiplying sago palm density (stand/hectare) and area of strata (hectare). The mathematical formula is as follows:
Where,
= population in strata h, = area of strata h (hectare)
The result of the population count in each strata is used to calculate the total population of sago stands in the whole study area using the formulation below:
Where,
= population of sago palm in the whole study area,
H = total number of strata
Sago stock estimate
The content of sago starch in each tree refers to previous research conducted by Yumte (2008) in South Sorong, West Papua. Those research generate a correlation between diameter at breast height and midrib free height and sago starch content. The correlation is described by the mathematical formula below:
Where,
204 PART II: REFERENCE PAPERSMethodology development for estimating sago stock by using area frame in West Papua, Indonesia
Based on the above equation we can calculate the fresh weight of each tree inside the sample segment since field data of breast height diameter and midrib free height are obtained. Then, the next step is to calculate the average sago content in each stratum by the formula below:
Where,
is the average sago content per tree in strata-h (kg/tree),
is number of sampel segment in strata-h,
is the average sago content in strata-h, sample ith (kg/tree).
The potential of sago in each stratum is calculated by multiplying the total population and the average of sago content per tree. The formula is as below:
Where,
is the potential of sago in strata h (ton)
Finally, the estimation of sago stock in the study area can calculated by using the formula below:
Where,
P is the potential of sago stock in the whole study area.
3. Results and discussion
3.1 Contruction of area frame sampling
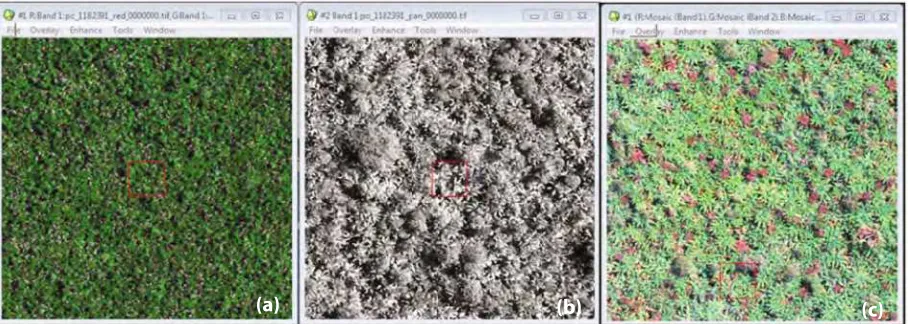
Stratification of the study area is generated by interpreting GeoEye satellite data acquired on January 2013. GeoEye is one of high spatial resolution data, where multispectral reflectances have 1.65 m spatial resolution, and panchromatic reflectance has 0.41 m spatial resolution. Data fusion for combining multispectral and panchromatic data was applied to enhance its interpretability where the color is derived from the multispectral and the sharpness derived from panchromatic (Figure 4).
Figure 4. Satellite data fusion; (a) Multispectral, (b) Panchromatic, and (c) Data fusion
205
PART II: REFERENCE PAPERS
Methodology development for estimating sago stock by using area frame in West Papua, Indonesia
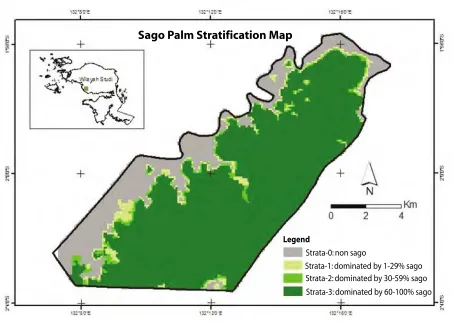
Since sago trees have specific star canopy on the image, it is easy to recognize and differentiate between sago and non-sago forest. A strata map then can be obtained by on screen delineation of the data fusion image for whole study area (Figure 5). The areas visually interpreted as non-sago forest are stratified into Strata-0, whereas the areas visually interpreted as sago forest are stratified into strata-1, strata-2, and strata-3.
● Strata-1 is defined as Low Density forest which has 1-29 percent of sago palm ● Strata-2 is defined as Low Density forest which has 30-59 percent of sago palm, and ● Strata-3 is defined as Low Density forest which has 60-100 percent of sago palm
Based on the strata map, the extracted study area is 13,315 hectares consisting of 2,892 hectares strata-0, 630 hectares strata-1, 392 hectares strata-2, and 9 401 hectares strata-3.
Figure 5. Result of sago palm stratification in the study area
Sago Palm Stratification Map
Legend
Strata-0: non sago
Strata-1: dominated by 1-29% sago Strata-2: dominated by 30-59% sago Strata-3: dominated by 60-100% sago
206 PART II: REFERENCE PAPERSMethodology development for estimating sago stock by using area frame in West Papua, Indonesia 3.2 Ground-truth survey
A ground-truth survey is conducted to observe all extracted sample segments as shown in Figure 4. The main tools to reach a desired sample segment are a map of high resolution image and GPS. The map is used as a road-guide for approaching the segment based on physical fixtures on the image, such as river, canal, settlement, road and so on. After closing on the segment, GPS is very useful to find the exact location of the segment.
Parameters of sago palm density measured from each sample segment are the number of bunches (RS) and number of growing stages, namely before mature stage (BMT), mature stage (MT) and after mature stage (LMT). The parameters for estimating sago starch content are found by measuring the diameter of trunk at breast height (Dbh) and midrib free height (Tbp). The measurement of diameter and height are only for mature stages, because those stages are considered to contain sago starch.
Heavy constraints were found when entering sago forest because of the very high dense forest and deep swamp. A part of the field data has been done but the other part is still in progress. Based on the field observation, sago forest has a low variance of sago population, so that it is considered to have a smaller size of sample segment than 0.5 percent. In general, sago forest is located several kms from the main river and under a flooded water environment.
3.3 Data analysis
The overall results of the data analysis is summarized in Table 1. It is to note that collecting field data is still in progress so that the data in Table 1 below is still temporary results. RS density in each stratum is 40 bunch/ha, 44 bunch/ha, and 63 bunch/ha for strata-1, strata-2, strata-3, respectively. These results indicate that quantitative density with respect to the field data analysis is a match to qualitative density with respect to the image interpretation. Sago palm density in strata-1 and strata-2 is quantitatively not significantly different, but the density of strata-1 and strata-2 is remarkably different compared with the density in strata-3. Total RS in each strata is 25 200 bunches, 17 248 bunches, and 594 143 bunches, so that it produces 636 591 bunches in the whole study area. We can find growing stages of sago palm inside each bunch, namely before mature stage (BMT), Mature Stage (MT), and After Mature Stage (LMT).
207
PART II: REFERENCE PAPERS
Methodology development for estimating sago stock by using area frame in West Papua, Indonesia
The results of the field data analysis show that the density of BMT in each strata is 52 trees/ha, 72 trees/ha, and 80 trees/ha for strata-1, strata-2, and strata-3, respectively. The population of BMT in each strata can be calculated by multiplying the density and its corresponding area. The result is 32,760 trees, 28,224 trees, and 752,080 trees for strata-1, strata-2, and strata-3, respectively. The total population of BMT in the whole study area can be derived by adding up the population in each stratum, i.e. 813,064 trees. BMT is not ready to harvest yet, and it needs around 2 years to harvest. Such BMT population data is important to manage harvest rotation and predict sago starch potential to harvest in the future.
MT density in each stratum is 36 trees/ha for strata-1, 84 trees/ha for strata-2, and 58 trees/ha for strata-3. Similarly, the calculation results of the the MT population are 22,680 trees, 32,928 trees, and 549,018 trees for strata-1, strata-2, and strata-3, repectively. So the total MT population for the whole study area is 604,626 trees. MT is the only growing stage which is ready to harvest due to its sago starch content. MT population data is used to estimate sago starch production at the present time.
LMT density in each stratum is 16 trees/ha, 36 trees/ha, and 26 trees/ha for strata-1, strata-2, and strata-3, repectively. The calculation of LMT population produces 10 080 trees, 14 112 trees, and 240,666 trees, for strata-1, strata-2, and strata-3, respectively. The population of LMT in the whole study area is 264,858 trees. The LMT population indicates that the sago palm should be cut in order to increase starch yield.
As mentioned in the methodology the starch content in each tree refers to the correlation between diameter at breast height and midrib free height and sago starch content. Of course, the correlation between diameter, height and sago starch content depends on local specific environtments, such as soil, terrain, and climate where the sago palm grows. Based on those field data of diameter and height, we can calculate the average starch content/tree in kg fresh weight (kg FW). Table 1 shows that the yield of sago starch/tree in strata-1 and strata-2 is much higher than the yield in strata-3, indicating the less the density of the sago forest the higher the yield of sago starch. The yield of sago starch/tree in the study area is much less compared to the yield in the Meranti Islands District. It is reported by Balitbang Pertanian (2013) that the average yield in Meranti Islands can reasch 398 kg/tree. The stock of sago starch in each stratum then can be obtained by multiplying the average starch content/tree and its corresponding population. The potential of sago stock is 4,930 ton FW, 7,224 ton FW, and 109,582 ton FW for strata-1, strata-2, and strata-3, respectively. The final estimation of sago stock in the whole study area is 121,200 ton FW.
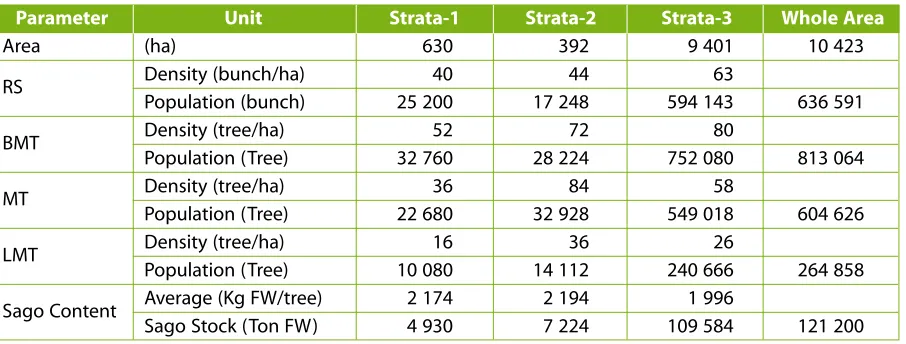
Table 1. The result of density, population and sago stock estimation in the study area
Parameter Unit Strata-1 Strata-2 Strata-3 Whole Area
Area (ha) 630 392 9 401 10 423
RS Density (bunch/ha) 40 44 63
Population (bunch) 25 200 17 248 594 143 636 591
BMT Density (tree/ha) 52 72 80
Population (Tree) 32 760 28 224 752 080 813 064
MT Density (tree/ha) 36 84 58
Population (Tree) 22 680 32 928 549 018 604 626
LMT Density (tree/ha) 16 36 26
Population (Tree) 10 080 14 112 240 666 264 858
Sago Content Average (Kg FW/tree) 2 174 2 194 1 996
208 PART II: REFERENCE PAPERSMethodology development for estimating sago stock by using area frame in West Papua, Indonesia
4. Conclusions
1. Data fusion of high-resolution satellite imagery between panchromatic and multi-spectral is very useful for visual interpretation to differentiate non-sago forest and sago forest.
2. Spatial statistics is an effective tool to develop area frame sampling for implementing field survey strategy
3. The size of the sample segment could be reduced by the fact that sago forest is more homogenous compared to normal tropical forest
4. Sago palm density in strata-1 and strata-2 is quantitavely not significantly different, but the density of strata-1 and strata-2 is remarkably different compared with the density in strata-3. 5. At the time of the survey, there were 813,064 trees ready to harvest 2 years later; 604,626 trees
ready to harvest; and c) 264,858 trees of unutilised resource
6. Potential stock of sago starch at the the time of the survey is 121,200 tons
References
Abd-Aziz, S. 2002. Sago starch and its utilization. Journal of Bioscience and Bioengineering, 94(6), pp. 526–529, 2002.
Avé, J.B. 1977. Sago in insular South-East Asia: historical aspects and contemporary use. In: Proc. 1st International Sago
Symposium, Kuching, Malaysia 5-7 July, 1976. (K. Tan ed.), pp. 21–30.
Bachri, S. 2011. Identifikasi Lahan Sagu dan Potensi Pemanfaatannya Secara Berkelanjutan di Kabupaten Jayapura
(Tesis). Sekolah Pasca Sarjana, Institut Pertanian Bogor.
Balitbang Pertanian. 2013. Usulan Pelepasan Varietas Sagu Selatpanjang
Bintoro. HMHD. 1999. Pemberdayaan Tanaman Sagu Sebagai Penghasil Bahan Pangan Alternatif Yang Potensial
Dalam Rangka Ketahanan Pangan Nasional. Di dalam: Orasi Ilmiah Guru Besar Tetap Ilmu Tanaman Perkebunan.
Fakultas Pertanian IPB. Bogor.
Flach, M. 1997. Metroxylon sagu Rottb. – Promoting the conservation and use of underutilized and neglected crops.
Institute of Plant Genetics and Crop Plant Research, Gatesleben/International Plant Genetic Resources, Rome, Italy.
Ministry of Forest. 2007. Pedoman Inventarisasi Hutan Menyeluruh Berkala.
Gallego, F.J. 1995. Sampling frame of square segments. an agricultural information system for the European Union. JRC, European Commision.
Kertopermono, A.P. 1996. Inventory and evaluation of sago palm (Metroxylon spp.) distribution. p. 53–62. In C. Jose and R. Rasyad (Eds.). Sago: The Future Source of Food and Feed. Proc. 6th Intl. Sago Symp. Universal Academy
Press, Inc.
Ngudiwaluyo, S. & Amos, Dessy. 1996. Utilization of sago in supporting food security. In: C. Jose & A. Rasyad (eds.),
Sago: the future source of food and feed. Riau Univ. Training Center, Pekanbaru. p. 225–30.
Oates, C.G. 1999. Innovative technologies for sago starch production in Asia and the Pacific – problems and
prospects. In K. Sriroth, A. Hicks, and C. Oates (eds). Sustainable Small-scale Sago Starch Extraction and Utilization: Guidelines for the Sago Industry. The first FAO Regional Round Table, 9–11 August, 1999. Bangkok, Thailand.
Stanton, R. 1993. Perspective on, and future prospects for, the sago industry. Sago Palm, 1(1), pp. 2–7.
Sutanto. 1986. Penginderaan Jauh (jilid 1). Gadjah Mada University Press. Yogyakarta.
Yumte, Y. 2008. Penyusunan Model Penduga Berat Basah Tepung Sagu Berduri (Metroxylon rumphii) di Kabupaten