Refer to Important disclosures in the last page of this report
Stock DataTarget price (Rp) Rp6,000
Prior TP (Rp) Rp6,000
Share price (Rp) Rp7,050
Upside/downside (%) (14.9)
Shares outstanding (m) 9,585
Market cap. (US$ m) 4,112
Asia Financial (Indonesia) 67.4%
Estimate Change; Vs. Consensus
2018F 2019F
PT Indo Premier Securities [email protected] +62 21 5793 1168
Still stagnant but drag is diminishing
Weak top-line growth but micro business unwinding is nearly over.
NIMs are maintained (for now) despite rising rates this year.
Credit cost improved as loan mix shifts towards lower-risk assets.
Reiterate Hold given upside from MUFG acquisition/merger plans.
Still no earnings growth. BDMN reported net profit of Rp3.0tn in 9M18 (flat),
in-line with our FY18F forecast albeit slightly below consensus estimate. As such,
the bank continued with no earnings growth in the past five years on the back of
its unwinding of micro lending business to focus on SME, home mortgages,
commercial and automotive lending through subsidiary Adira Finance. However,
the growth drag from micro lending business appears to be over soon as its micro
loans, which declined 58% yoy, has fallen to just Rp3.2tn or contributing only
2.4% of loans, from 6.1% a year ago, and its peak contribution of 16% in 2013.
Stable NIMs. BDMN’s loan portfolio (including trade finance) grew 6% in 9M18 or
10% if excluding its declining micro loans. The bank’s key loan growth drivers are
Adira Finance’s automotive loans (+12% yoy), followed by SME loans (+11%) and
consumer (+16%), mainly driven by its strong mortgage loans (+35%), while
corporate loans grew 7%. Meanwhile, although the bank’s high NIMs narrowed by
30bps yoy to 9.0% in 9M18, NIMs were maintained stable at this level in the past
3 quarters despite BI’s 1205ps rate hikes and the bank’s loan mix shifting away
from high-margin loans, due to lack of funding growth and its CASA improvement
strategies. However, we expect lower NIMs in coming years as the bank starts to
grow loans more rapidly.
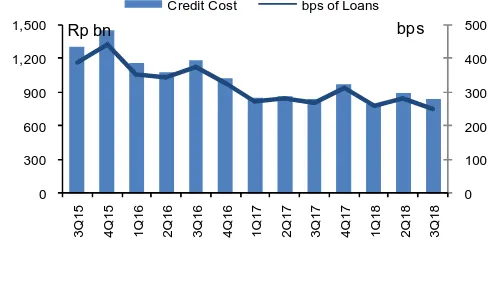
Asset quality. BDMN’s asset quality has been stable with credit cost improving
marginally to 2.6% in 9M18 (vs. 2.7% in 9M17) with lower credit cost of 2.5% in
3Q vs. 2.8% in 2Q. NPL ratio has also declined to 3.0% in 3Q, from 3.3% in 2Q
and a year earlier, while provision/NPL coverage also improved to 126%, from
116% a year ago. However, we expect scope for BDMN’s further credit cost
improvement to be more limited in the coming years and thus its earnings growth
will have to come from top-line growth.
Valuation. We maintain our earnings forecasts, TP of Rp6,000 and HOLD rating
despite the bank’s weak fundamentals in light of potential upside from ongoing
M&A. Although we believe BDMN’s valuation is unattractive, given the bank’s slow
earnings growth prospect with headwinds from rising rates, we believe its share
price will continue to be well supported by MUFG acquisition and merger plans (at
premium valuation), which has received regulatory approval and is proceeding to
the next stage in the process.
Bank Danamon
(
BDMN IJ
)
25 October 2018
Results Note
HOLD
(Unchanged)
Year To 31 Dec 2016A 2017A 2018F 2019F 2020F
Operating income (RpBn) 18,472 18,519 19,017 20,539 22,503
PPOP (RpBn) 9,375 9,098 9,314 10,247 11,491
Source: BDMN, IndoPremier Share Price Closing as of : 24-October-2018
BDMN IJ Results Note
2
Refer to Important disclosures in the last page of this report
Fig. 1: Net Interest Income (Rp bn) and NIMs (%) Fig. 2: Non-Interest Income (Rp bn; % of Gross Income)
Source: Company, IndoPremier Source: Company, IndoPremier
Fig. 3: Operating Expense (Rp bn) and Cost/Income Ratio (%)
Fig. 4: Pre-Provision Profit (Rp bn; % of Average Assets)
Source: Company, IndoPremier Source: Company, IndoPremier
Fig. 5: Net Loan Provisioning (Rp bn; bps of Average Loans) Fig. 6: Net Profit (Rp bn) and ROAA (%)
Source: Company, IndoPremier Source: Company, IndoPremier
5%
Net Interest Income Net Interest Margin
Rp bn
Other Income Other Income % of Total
Rp bn
Operating Expenses Cost-Income Ratio
Rp bn
Pre-Provision Profit Pre-Provision Profit ROAA
Rp bn
Credit Cost bps of Loans
bps
Net Profit Net Profit ROAA
3
Refer to Important disclosures in the last page of this report
Year To 31 Dec (RpBn) 2016A 2017A 2018F 2019F 2020F
Income Statement
Interest income 20,655 20,052 20,505 22,407 24,771
Interest expense (6,876) (5,903) (6,308) (7,216) (8,030)
Net interest income 13,779 14,149 14,197 15,191 16,741
Fees and commissions 3,644 3,428 3,770 4,147 4,562
Trading income 425 325 350 400 400
Other operating income 623 617 700 800 800
Total operating income 18,472 18,519 19,017 20,539 22,503
Personnel expenses (4,879) (5,023) (5,173) (5,535) (5,923)
G&A expenses (4,217) (4,398) (4,530) (4,757) (5,090)
Other operating expenses 0 0 0 0 0
Pre-provision operating profit 9,375 9,098 9,314 10,247 11,491
Provisions (4,441) (3,513) (3,298) (3,408) (3,633)
Short-term investments 17,408 16,060 17,666 19,432 21,375
Government bonds 9,563 10,974 10,974 10,974 10,974
Gross loans 122,385 124,766 138,733 154,863 173,311
Loan provisions (4,568) (4,271) (4,283) (4,515) (4,704)
Other assets 11,975 13,395 14,722 16,182 17,788
Total Assets 174,087 178,257 197,507 218,682 242,783
Customer deposits 103,740 101,897 110,240 119,382 129,408
Deposits from other banks 2,873 4,635 5,098 5,608 6,169
Securities and borrowings 19,813 19,965 22,710 25,842 29,416
Other liabilities 11,284 12,588 17,581 22,736 28,913
Total Liabilities 137,709 139,085 155,629 173,567 193,905
Share capital 13,151 13,158 13,158 13,158 13,158
Reserves and others 76 121 0 0 0
Retained earnings 22,716 25,382 28,209 31,445 35,209
Shareholders' equity 35,943 38,660 41,367 44,603 48,366
Minority interest 435 512 512 512 0
Total Liabilities & Equity 174,087 178,257 197,507 218,682 242,271
BDMN IJ Results Note
4
Refer to Important disclosures in the last page of this report
Year To 31 Dec 2016A 2017A 2018F 2019F 2020F
Growth Ratios (% yoy)
Gross loans (5.4) 1.9 11.2 11.6 11.9
Total assets (7.4) 2.4 10.8 10.7 11.0
Customer deposits (9.9) (1.8) 8.2 8.3 8.4
Net interest income 1.0 2.7 0.3 7.0 10.2
Non-interest income 1.8 (6.9) 10.3 10.9 7.8
Total operating income 25.1 13.2 7.7 13.7 14.9
Operating expense (1.5) 3.6 3.0 6.1 7.0
PPOP 3.9 (3.0) 2.4 10.0 12.1
Net profit 11.5 37.9 11.8 13.6 15.5
Profitability Ratios
ROAA (%) 1.50 2.11 2.19 2.25 2.34
ROAE (%) 7.6 9.9 10.3 10.9 11.6
NIM (%) 8.60 8.91 8.36 8.09 8.03
Credit cost (bps) 356.5 287.6 250.4 232.2 221.4
Cost/income (%) 49.2 50.9 51.0 50.1 48.9
LDR (%) 118.0 122.4 125.8 129.7 133.9
CAR (%) 23.7 25.0 24.3 23.6 23.0
NPL ratio (%) 2.7 2.3 2.1 2.1 2.1
Provisions/NPL (%) 138.3 150.3 147.5 140.4 130.9
Head Office
PT INDO PREMIER SEKURITAS
Wisma GKBI 7/F Suite 718
Jl. Jend. Sudirman No.28
Jakarta 10210 - Indonesia
p +62.21.5793.1168
f +62.21.5793.1167
INVESTMENT RATINGS
BUY : Expected total return of 10% or more within a 12-month period HOLD : Expected total return between -10% and 10% within a 12-month period SELL : Expected total return of -10% or worse within a 12-month period
ANALYSTS CERTIFICATION.
The views expressed in this research report accurately reflect the analyst;s personal views about any and all of the subject securities or issuers; and no part of the research analyst's compensation was, is, or will be, directly or indirectly, related to the specific recommendations or views expressed in the report.
DISCLAIMERS