ISSN No. 2356 - 2536
The Impacts of Agricultural Development on Shifting the Pattern of
Distribution Land Tenure in South Sulawesi
Suardi Bakri
*Departemen of Agribussines University of Islam Makassar Jl. Perintis Kemerdekaan No. 29 Makassar 90245, Indonesia
Abstract
Agricultural development policy in Indonesia continue to undergo metamorphosis find patterns efficiently and effectively to achieve its main goal, namely the welfare of farmers. This research aim to assess the impact of agricultural development policies on shift the pattern of land distribution in South Sulawesi. The research was conducted in the village of Mojong in Sidrap Regency and Salo Dua Villages in Enrekang. The survey was conducted by taking a random sample of 80 farmers in the village Mojong and 60 farmers in the village of Salo Dua. In addition to surveys, focus group discussion was also conducted to gather qualitative data. Computation of Gini index used the data tenure of 726 farmers in the village of Mojong and 232 farmers in the village of Salodua. Research results showed that the impact of agricultural policies on a group of farmers that controls the land 1.0 ha and more. Land tenure has shifted from tenure group 0.5 hectare - 1.0 hectare to 1.0 hectare or more. In the small farmers group with land tenure below 0.5 hectare, agricultural development policies tend to have no impact. There is no significant shift in the land tenure group below the 0.5 hectare. Land distribution shifts towards a better than the previous period, indicated by the declining land Gini index since 1963 to 2013. Concluded that the policy of agricultural development besides impacted the improvement of land distribution also affected in a shift of the distribution pattern, especially for the tenure group 0.5 hectare - 1.0 hectare and 1.0 hectare or more. Recommended policy, that each farm unit controls the land not less than 1.0 hectare, in order to agriculture development policies can be more effective.
Keywords: agricultural policy, land tenure, land distribution
*
Corresponding author. Tel.: +62-411-588167 ; fax : +62-411-588167 E-mail address : [email protected]
1. Introduction
Agricultural development policy in Indonesia continues to look for patterns that efficient and effective in achieving its main purpose, which is to improve the welfare of farmers. Since the beginning of independence, agricultural development planning began. Plan Kasimo which then merged with Wicaksono plan (1950-1959) and resulted in the Special Welfare Plan is the main foundation of agricultural development. In the New Order period, agricultural development programs implemented by the Guidance, and Supra Insus Insus Indonesia self-sufficient in rice were delivered in 1984. In the 90s until today, the Indonesian government to implement a reorientation of agricultural development goals to agribusiness systems and food security programs.
The change agricultural development policy in Indonesia was followed by the change of policy paradigm. If the New Order period (1969 to early 1990) which can be viewed conceptually in each five-year development plan (Repelita), the paradigm of agricultural development policy aims to improve the production aims to fulfill domestic food requirements, expand work opportunities and increase in export volume, then in the late 90's or reform era has shifted to a more complex agribusiness purposes, which is to increase the participation and productivity of farmers.
Agricultural policy during the 20th century by Braun 2005 was mostly just considering the growth of production and the market balance through efficiencies. Efficiency of resource allocation could causes to the spatial distribution of economic activity, including the labor, whereas according to Jones and Yogo 1994 (Kumssa 2000), growth may affect change, but growth without equity is meaningless.
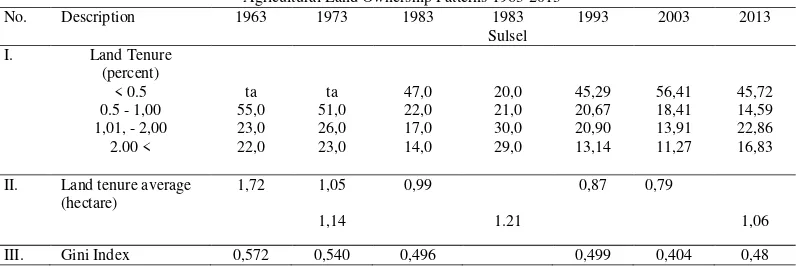
Relevant with land resources is one important resource for agriculture, land distribution data presented Thorbecke and Pluijm 1993, when the implementation of Guidance (1970-1990) shows that the average tenure of land decreased from 1.05 hectares each farmer household in 1973 to 0.99 hectares in 1983 and 0.79 hectares in 2003. Torbecke and Pluijm 1993, and result the Census of Agriculture 1993 and 2003 reported that in South Sulawesi case agricultural land tenure over the average of the national average of 1.14 hectare per household in 1973 and it increased to 1.21 hectares in 1983.
Scientific Journal of PPI-UKM compared with the distribution of land outside Java and
there is a shift towards better from 1963 to 1983.
Agricultural development policy would be expected to give effect to the distribution, mainly of the primary asset (land), farmers all towards a better. Therefore, research is needed to analyze the impact of agricultural development policies to the shifting patterns of land distribution, particularly in South Sulawesi.
2. Methods
The research was conducted in March to October 2013 in the village of Mojong, who represent the village of irrigated lowland rice in Sidrap. and Village Salodua who represent highland rice fields in Enrekang. The population is all farmers in the two villages. Samples were taken randomly by 80 farmers in the Village of Mojong and 60 farmers in the Village of Salodua. Whereas, the calculation of Gini index used data land tenure of 796 farmers in the Mojong Village and 232 farmers in the Salodua Village. Method of survey was conducted to collect quantitative data, such as land tenure and agricultural development programs. Also carried out focus group discussions (FGDs), in-depth interviews and tracking documents, especially documents land tenure to complete the quantitative and qualitative data.
Besides of qualitative descriptive analysis also conducted a quantitative analysis to find out the distribution of land by using the Gini index which was developed by Szal and Robinson, 1977 (Swastika et al, 2000; Adnayana and Suhaeti, 2000) as follows:
G = 1 + 1 / n - 2 / (n 2 Yr) [ΣYi] (1)
Where G is the Gini coefficient, n is the number of samples, Yr is the average land area, and Yi is the land area of the i-th household.
3. Results and Discussion
3.1. The Pattern of Land Tenure
Agricultural development policies implemented during the year 1963 to 2013 by looking at changes in the pattern of land tenure, the results of this research can be a reference comparison, although recognized that the data this research only in two villages in South Sulawesi but may show a tendency to a decrease in the number of farmers w ho has more than 0.5 hectares of land. Meanwhile, the control group under 0.5 hectares of land is likely to increase, as shown in Table 1 If the period of agricultural development is divided into 10-year period, it was explained that in the period 1963 to 1972 the agricultural development land tenure indicators measured in 1973 showed that the group of farmers who controlled under 1.0 hectares of land, the dominant (51.0%), followed by a group of farmers who controlled the land between 1.0 hectares to 2.0 hectares
(26.0%) and a group of farmers "the rich" who control over 2 hectares of land (23.0%). These data indicate that the decrease in the percentage of farmers who controlled under 1.0 hectares of land indicates the presence of a group of farmers who transformed to groups of control of over it, previously controlled under 1.0 hectares land became the ruler of more than 1.0 hectares of land. This condition can be linked to the government's program for the period (1963-1972). Program Guidance and intense mass credit caused farmer who to farm in the scale of economic opportunity to add area of fields.
Furthermore in 1983, the pattern of land tenure returning shows the difference very prominent in the group of farmers "small / landless" who controlled under 1.0 hectares of land increased to 69.0%. Increasing the portion of farmers groups "small / landless" is of course caused control of group on 1.0 hectares decreases, contradictions to those that occur in the previous decade (1963-1972). After tracing the development of agricultural policy in this period (1973-1982) turned out to be the impact of the green revolution, agricultural production has been in the condition laveling off. This condition should be assumed be the cause of the growing group of farmers "small/ landless". Laveling off the production of food/rice at that time due to the massive intensification program conducted by the programmed three types intensification programs simultaneously, namely the intensification of mass, the General and Special Intensification. Intensification program is gives less results, as expected, not only causes laveling off, but also lead to a transformation in the status of farmers on land tenure from farmers "middle" to the small farmers and the landless.
In 1993 a group of farmers "small/landless" re-experiencing a shift, decreased slightly the portion becomes 65.96% and farmers' groups "medium" it rose to 20.90%. In this year, benchmark performance against the impact of land tenure policy in the period 1983-1992, where the heyday of agricultural development achieved by realizing the self-sufficiency of rice in 1984. In is also period, government policy changes mainly related to credit, credit mass of Guidance patterns into patterns of Farm Credit through Cooperative Village Unit (KUD).
By 2003, farmers in the group of small farmers / landless still dominant (65.96%) followed a group of farmers "medium" (20.90%) and farmers' groups "rich" (13.14%). Similarly, in 2013, the distribution of farmer groups "small/landless (60.31%), with details of that controls less than 0.5 hectares were 45.72% and the control of 0.5 hectares to 1.0 hectares 14.59 %. Data By 2013 showed a decrease in the percentage of group tenure of less than 0.5 hectares compared with 2003, but still not significantly different from the data in 1993 and 1983 were presented by Torbecke and Pluijm (1993) and 1973, which was released MacAndrew (1986).
Scientific Journal of PPI-UKM in 1983 to 45.72% in 2013 or a decrease of only 1.28% in
this period. Meanwhile for the control group 0.5 hectares to 1.0 hectares or farmers "medium" tends decrease, primarily from 1983 to 2013.
In 1983 the number of farmers 'small' is decrease as much as 22.0% to 20.7% in 1993, and then declined again to 18.41% in 2003 and remaining 14.59% in 2013 which means there is a decrease of 4 , 41% during the period of 30 years of agricultural development. The decline in the percentage of farmers group "little" land tenure between 0.5 to 1.0 herktar faster than the decrease in land tenure in a group of farmers "landless". This shows that the group tenure of 0.5 up to 1.0 hectares, more quickly transformed into group tenure wider. Farmers are farming in the
economies of scale expected to be between 0.5 hectares or more, more able to take advantage of agricultural development programs implemented by the government, compared with group of farmers "landless", or could also be said that agricultural development policy more favored groups farmer who rules over 0.5 hectares of land, as also suggested by Suwardi 1973 (Billah, Widjajanto and Kristyanto1976) that since Repelita more agricultural development programs serve the interests of those who controlled the agricultural land, which is due to their socioeconomic status, this group is more "progressive "and" responsive ".
Data for 1963-2003 quoted from previous research publications, such as land distribution data 1963-1983, quoted from Eng (1996) Table 3:24: 151, see also data published MacAndrew (1986). Table 1.5: 12, Torbecke and Pluijm (1993) Tables 3.7-3.9: 69-72, Anne Both et al. (2012), Table 4.10: 72, Rusastra et al (2009). Tables 2 and 3: 103-04. Data of 2013 is the data this research.
However, if looking back at the data of South Sulawesi in 1983, presented by Torbecke and Pluijm 1993 showed a different pattern with the national pattern, the ruling group under 0.5 hectares of land in this year only 20.0% and increased dramatically to 45.72% in 2013, further the whole the control group decreased percentages, except for the control group over 2.0 hectares. This may be linked that, besides agricultural development policies which is work influence patterns land tenure, in South Sulawesi also occurred poisitif land conversion (additional area) of the agricultural land in the period 1983 to 1993 by 134,693 hectares, and the period 1993-2003 covering 412,064 hectares . Therefore, the shift in tenure group which is occurred caused by agricultural development policy, emphasize that the agricultural development policy more effective have an impact on group of farmers which is land tenure is 0.5 hectares to 1.0 hectares.
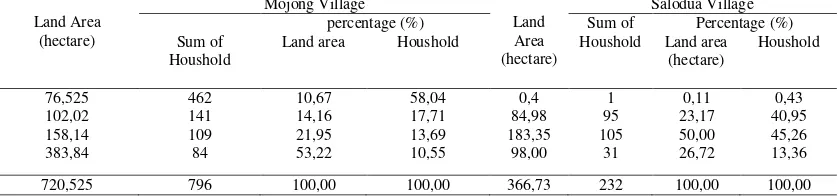
Table 2 shows the data pattern of land tenure in the two research locations. The data describe that group of farmers "landless" less land tenure of 0.5 hectares is still high (45.72%) followed group of farmers "medium" which controls 1.0 to 2.0 hectares of land (22.86%), group farmers "rich" with over 2.0 hectares land tenure (16.83%). Compared with the pattern of land tenure that have been published, as described by Torbecke and Pluijm 1993, that in 1983 in South Sulawesi (Table 2) farmers were dominant (30%) are the group of "middle" who control the land 1.0 to
2.0 hectares, followed group of farmers who control 0.5 to 1.0 hectares (21%), 2.0 to 3.0 hectares (18%) and it is only the lowest (10%) are a group of farmers "small/landless "who control less than 0.5 hectares. Seen the shift of the dominance of farmers "middle" (controls 1.0 hectares to 2.0 hectares) to plots of farmers below 0.5 hectares or in other words the land fragmentation occurred during the last 30 years. If linked to the policies implemented by the government, both pricing policies, inputs, irrigation, credit and agricultural machinery seems not effectively prevent land fragmentation.
Scientific Journal of PPI-UKM manage his farm and increase production, causing land transactions almost stagnant.
Table 2
Land distribution by Group, Average Tenure and Gini index at the location of Research, 2013a No Description
aData rincik in Mojong village and data farmer groups in Salodua village, Processed, 2013
Table 3 showed year by year decline in land transactions, both the number and area of transacted, while on the other side of the transaction value have increased. This illustrates an increase land prices in the market (from IDR 4.8 million per hectares by 1984 to 1990 to IDR 42.5 million per hectare in the period 2001-2012). The land price increases following the overall economic development and the strategic environment on existing land, such as access and other support facilities.
Besides land tenure patterns, this paper also presents data on the average tenure and land Gini index to look further distribution land tenure. Results showed in general the average land tenure in the two research villages was 1.06 hectare higher from the national average since 1973 but still lower or decreased when compared with the data on the average land tenure in South Sulawesi, both year 1973 and 1993 It is explained that, the average land tenure in South Sulawesi tended to decline with a decrease in average land tenure nationally. The expansion of the paddy fields program in South Sulawesi during the period 1983-1993 and 1983-1993-2003 are also caused "positive conversion" is not able to increase the average land tenure farmers.
Land tenure distribution as measured by the Gini index shows that in general the results of this research showed rate of 0.48, was not much different than the Gini index of the previous year, ie in 2003 (0.404), 1993 (0.499) and 1983 (0.496) and refer to criteria Oshima et al.1976 (Nuraliyah 2009), the distribution of land in Indonesia since 1983 until 2013 it already entered the category of middle inequality, compared with the previous year (1963-1973) is still high. Anchored by average land tenure there is a linear relationship, where the Gini index decreases which showed measure of inequality has narrowed, while the hectare smaller than the in 1993.
When village Mojong describes the lowland village, with the technical irrigated rice, get agricultural development
policy priorities with existing programs and describes the village Salodua highland village, dominated wet rice field, people have alternatives other activities, addition paddy rice farming, so data related to land tenure patterns following can be attributed to the condition of the villages.
First, calculated the Gini index of land in the village Mojong, showed the value of 0.68 who means the distribution of land in this village showed high inequality, more unequal than the Gini index calculation based on the Census of Agriculture in 2013 who has been published by Rusastra et al. ie land tenure Gini index of 0.5816 outside Java. Similarly when compared to the previous years as was written by Griffin in 2002 that in the year 1970-80 Indonesia generally have Gini index for land tenure 0.56. Another case in Salodua village, land tenure patterns more evenly with the Gini index only 0.26. The data concluded that the distribution of land in the village Mojong, with condition the agricultural development is more "developed" than Salodua village, almost no shifting and even tend to be more unequal than previous period of agricultural development. Meanwhile in the village Salodua, where the village is not as advanced as the village Mojong can exactly equal the equity who accomplished by South Korea and China respectively Gini index of 0.2 and 0.21. That situation, when refers results of research Nuraliah 2009 that says that, inequality is always greater in urban than in rural areas, provide that if the Village Mojong legitimacy has led to urban conditions with easy access to the entire facility is causing this village more unequal than the distribution of land in the village Salodua, who is more "isolated" and "underdeveloped" compared with Mojong village.
Scientific Journal of PPI-UKM
Land Transactions in the village of Mojong, 1984-2012a
Periods
Data of Land Transaction in Mojong village, Processed, 2013
May also be seen in the group of farmers who controlled land over 1.0 hectare to 2.0 hectare, in the village of Mojong only 14.45 per cent while, in the village of Salodua 51.72 per cent. The data also indicates that, in the Village Mojong dominated land tenure group to about 1.0 hectares only (74.74 per cent) compared with the Village Salodua (10.77 per cent). Farmer group which controls more than 1.0 hectare of land vice versa the Village Salodua dominant (89.22 per cent), in the village of Mojong only 25.25 per cent. There is also 37.5 per cent of farmers who controlled land over 2.0 hectare in the village Salodua and 10.80 per
cent in the Village Mojong. If described, the structure of society in the two research villages based on land tenure group, the structure of society Mojong in the form "Pyramid", where the percentage of large land tenure (over 2.0 hectare) small percentage, while a group of land tenure under 0.5 hectare, very large (See Table 4). Whereas in the village Salodua, the structure of society was "Belahketupat", where the middle class that controls 1.00 to 2.00 hectare of land who dominant compared to who control is less than 0.5 hectare of land and more than 2.0 hectare.
Table 4
Distribution of farm households by tenure at the research location, 2013a Land Area
Land area Houshold Land area
(hectare)
aData of Land Tenure Mojong village dan Salodua village, 2013
3.1. Agricultural Development Policy
Agricultural development policies as well as the objective is not only on aspects of the production of short-term (short short-term), but is also expected to have long-short-term goals (long term) that is the distribution of assets, including agricultural land. Ellis (2009) stated that in agricultural development, agricultural development policy covers price policy, policy inputs, irrigation policy, credit policy and technology policy. Conditions of land tenure pattern with measure of land tenure group distribution, Gini index and the average land tenure per farmer household, certainly cannot be separated policy as has been stated. Therefore, as an illustration, the results of this study indicate that the price policy are less impact on the farmers who are dominated by small farmers / peasant. Case was caused by, smallholder farmers are very dependent on the farmer-owners of the land. This phenomenon is seen primarily in Mojong village, which is dominated by peasant farmers. The price of grain in the village was made by traders or rice mill owner which is also a land-owning farmer. Farmers
whose status is only cultivators with the state of "forced" to sell grain on owner of the rice field. This causes not only peasant dependence on land assets which working on, but it also depends on the process of production, post-harvest and marketing of products. Did not work effectiveness of price policy on small farmers/landless farmers caused in this group is not enjoyed a surplus in income which can be used for reinvestment, Moreover on land, so it is natural if the stagnant portion of this group from year to year.
Scientific Journal of PPI-UKM (HET) per sack in 2013, urea was IDR. 90 000, - SP-36
IDR 100 000, - ZA IDR. 70 000, -, NPK IDR. 115 000, - and organic fertilizer IDR. 25 000, -.
Farmers in the two research sites also make purchases with a variety of payment methods, namely the payment of cash and non-cash. This payment method affects the prices paid by farmers. Urea fertilizer at the retail level in research sites if paid in cash IDR 90 000, - per sacks, there is no difference with the HET established by the government. Whereas if paid in non-cash, after harvest, the price of urea in the village Mojong, approved IDR. 150,000 per sacks, whereas in the Village Salodua only IDR. 120.000, -. For NPK-Pelangi the price is IDR. 116,000, - and SP-36 IDR 105.000, - per sacks, there is a price difference with the HET, where NPK difference IDR. 1,000 per sacks and SP-36 difference IDR. 5,000 per sacks. The difference in prices paid the farmer, if the non-cash procurement fertilizers anticipated with the policy of credit. The problem is the access to credit policy does not to side with small farmers or landless.
Credit policy has actually been implemented since the beginning of the period of agricultural development policies with mass credit the Bimas pattern, Farm Credit (KUT), Small Business Credit (KUK), Rural Agribusiness Program (PUAP) as well as general financial programs which can be used by farmers such as business credit (KUR). PUAP and KUR which running currently is generally considered by farmers is very helpful, especially in fulfilment initial capital farming. This program encountered problems in the field is the uneven distribution of funds to farmers due to the amount of funds that are not proportional to the number of farmers. Data in 2012, for example, in the village there are 10 Mojong irrigated rice farmer groups which are members of the Association of Farmers Group (Gapoktan) get a budget allocation of IDR 100 million. The funds are loaned to farmers with the amount of between IDR 1 million to IDR 3 million with the provisions of the farmers are willing to pay the cost of capital or interest at 2.0% per month. Meanwhile, in the village of Salodua, PUAP fund also managed by Gapoktan. Farmers which borrowing funds capital subject to interest at 1.0% with a maximum loan 6 months old. Farmers in the village Salodua also utilize KUR funds from BRI with average loan size of between IDR 5 million to IDR 20 million, with a 1.2 per cent interest on the loan.
Besides the two program that aims provide loans to farmers as a manifestation of credit policy, which according Ellis 1992, as an instrument to decide "devil circle" on low-income farmers are also common program implemented by the outside of agriculture sector, but farmers also use in financing farming. However, the policy is expected to help farmers to implement farming as well in order to obtain optimum production and a surplus production and incomes so as to invest on land had not yet succeeded, particularly the farmers "landless". Likewise other policies, including policies irrigation and agricultural mechanization policy. Besides the two program that aims provide loans to farmers as a manifestation of credit policy, which according Ellis (1992) as an instrument to decide
"devil circle" on low-income farmers are also common program implemented by the outside of agriculture sector, but farmers also use in financing farming. However, the policy is expected to help farmers to implement farming as well in order to obtain optimum production and a surplus production and incomes so as to invest on land had not yet succeeded, particularly the farmers "landless". Likewise other policies, including policies irrigation and agricultural mechanization policy.
4. Conclusions
1. Agricultural Development Policy, in general affect the distribution pattern of improving land tenure, namely the of high middle inequality into middle inequality is since 1983 until the year 2013 Despite the Gini index fixes, but agricultural development policies have not been able to improve the average land tenure of farmers either national and local South Sulawesi, which has declined. Likewise with land tenure groups which still dominated by the group under the control of 0.5 hectare.
2. Agricultural development policy, especially on 1973-1982 policy periods, where the three types programs implemented intensification, namely the intensification of the general, special intensification, supra special intensification able to shift the pattern of land tenure, from the category of high middle inequality in 1973 to middle inequality was in 1983.
3. Impact of agricultural development policy on the pattern of land tenure on lowland rice fields rice fields in contrast to highlands. Inequality of land tenure on lowland rice fields 0.68 compared with 0.26 highlands. Likewise with, group land tenure under 0.5 hectare. At the lowland rice is dominant (58.92 percent) compared on highlands rice fields (0.43 percent), as well as the average land tenure on lowland rice narrower than the average land tenure on highlands rice fields.
References
[1] Braun, Joachim v., 2005. Agricultural Economics and distributional effect. Agricultural Economic Journal, 32 (2005): 1-20.
[2] Yogo, Toshihiro (2000). Local Communities in Development Process- An Analitycal Framework, Asian Productivity Organization
[3] Torbecke, Erik van der Pluijm and, Teodoro, 1993. Rural Indonesia: Socio-Economic Development in a Changing Environment. USA: International Fund for Agricultural Development (IFAD) New York University Press.
[4] Van der Eng, Pierre, 1996. Agricultural Growth in Indonesia, the Productivity Change and Policy Impact Since 1880. Great Britain: MacMillan Press Ltd.
[5] MacAndrew, Colin, 1986. Land Policy in Modern Indonesia. Boston, USA: Oelgeschalger, Gunn & Hain Publishers Inc.
[6] Swastika, Dewa K.S., 2000. Structure of Land Tenure and Peasant Household Income, Case Studies in South Barito and Kapuas, Central Kalimantan. Bogor: Center for Research and Socio-Economic Development, Agricultural Research, and Institute for Agricultural Technology, Central Kalimantan.
Scientific Journal of PPI-UKM
Areas of Java and Bali. Bogor: Socio-Economic Research and Development Center, Department of Agriculture.
[8] Nuraliyah, 2009. Decomposition of Income Inequality in Post-Crisis Indonesia 1999-2005. Bogor : Department of Economics, Faculty of Economics and Management, Bogor Agricultural Istitut.
[9] Griffin, Keith; Rahman, Azizur and Ickowitz, Amy, 2002. Poverty and the Distribution of Land. Journal of Agrarian Change, 2 (2): 279-330. [10] Ellis, Frank, 1992. Agricultural Policies in Developing Countries.