Food Security and Markets in Indonesia
2
Food Security
and Markets
in Indonesia
Management and Organizational
Development for Empowerment
Bustanul Arifin
Achmad Munir
Enny Sri Hartati
Didik J. Rachbini
Southeast Asian Council for
Food Security and Fair Trade
Production Team:
Copy Editor: Ed Santoalla
Book Design and Photography: Nonoy Regalado
Production Staff: John Vincent Cruz and Aurora A. Regalado Cataloging in Publication Data
Food Security and Markets in Indonesia: State-Private Sector Interaction in Rice Trade / by Bustanul Arifin, et. al.
Quezon City: MODE Inc., 2001 p. cm.
1. Rice Trade -- Indonesia
2. Rice Trade -- Government policy -- Indonesia 3. Rice Production -- Economic aspects -- Indonesia 4. Rice Distribution -- Economic aspects -- Indonesia
I. Arifin, Bustanul. II. Munir, Achmad III. Hartati, Enny Sri IV. Rachbini Didik J. HD 9066 I5 F6 2001
Copyright © February 2001 MODE, Inc. and Sea Council All rights reserved.
The Management and Organizational Development for Empowerment, Inc. and the Southeast Asia Council for Food Security and Fair Trade encourage the use of this research paper, with appropriate credit given
1. Introduction 9
2. Review of Food Security and Markets 13
2.1 Evaluation of Food Security Measures 16
2.2 Price Stabilization Policy 18
2.3 Structure of Rice Trading 22
2.4 Methodology: Approach to the Study 24
3. Recent Developments in Rice Economy 27
3.1 Trend of Production and Consumption 29 3.2 Price Movement: Differentials of
Domestic and Border Price 35
3.3 Import and Buffer Stock Arguments 38
3.4 Regional Disparities in Rice Security 41
4. Roles of Private Sector in Rice Marketing 43
4.1 Rice Trading Map: Charting the
Geographic Flow of Rice in Indonesia 46 4.2 Description of Channels and Actors Involved 48 4.3 Patterns of Transaction:
Economic and Social Relationship 58
4.4 Marketing Margin and Efficiency Analysis 59 4.5 Assets and Capital Accumulation:
New Investment Decisions 65
5. State Interventions in Rice Trading 71
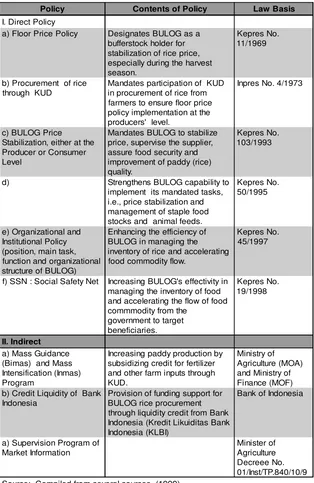
5.1 Government Laws, Regulations and Programs
on Food Security 73
5.2 State Procurement System: Import and
Trading Activities 76
5.3 Special Market Operation: Social Safety Net 82 5.4 Incentives, Barriers and Implication to Farmers 85
6. Synthesis of Sound Policies and the Market Mechanism 89 6.1 Private and State Interaction in Rice Trading 91
6.2 Workability of Market Mechanism 95
6.3 Potential Area of Policy Intervention 96
6.4 Areas of Policy Reforms 97
7. Concluding Remarks: Policy Recomendation 103
7.1 Summarized Conclusions 105
7.2 Policy Recommendations 109
References 113
Annex A - Data on Rice Farmers 117
Annex B - Data on Rice Traders 123
List of Tables and Figures
List of Tables and Figures
List of Tables and Figures
List of Tables and Figures
List of Tables and Figures
Table 2.1 Number, Composition and Distribution of Sample for Traders and Farmers in the
Study Locations 26
Table 3.1 Growth of Harvested Area, Yield, Production,
and Rice Equivalent, 1971-1999 31
Table 3.2 Rice Consumption, Net Import, Initial Stock,
and Consumption per Capita, 1971-1999 34 Table 3.3 Food Price, Consumer Price, Exchange Rate
and Rice Price during the Economic Crisis,
June 1997-March 1999 36
Table 3.4 Domestic, world market, border price, and nominal protection rate (NPR) from
Table 3.5 Rice Stocks, Procurement and Distribution
Systems, 1998 (in ton) 39
Table 3.6 Regional Disparities in Rice Security 41 Table 4.1 Income Analysis of Rice Milling Unit 52 Table 4.2 Average of Rice Marketing Cost (Rp/Kg) 61 Table 4.3 Proportion of Marketing Cost (in percentage) 61 Table 4.4 Gross Margin of Rice Marketing for Medium
Quality (in Karawang) 63
Table 4.5 Gross Margin of Rice in Indonesia,
1994/95-1998/99 63
Table 4.6 Results of Marketing Margin Analysis
for Rice (Rp/Kg) 64
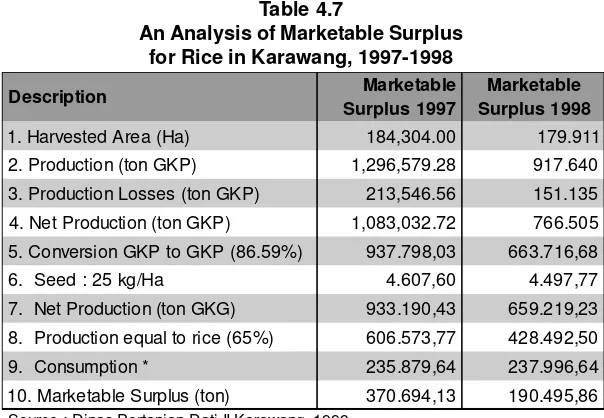
Table 4.7 An Analysis of Marketable Surplus for Rice
in Karawang, 1997-1998 65
Table 4.8 Analysis of Return of Cost (R/C)
Ratio for Paddy (Rp/Ha) 67
Table 4.9 Working Capital According to Marketing
Actors (in Rp 000) 67
Table 4.10 Source of Fund for Farming Activities
by Respondents (%) 68
Table 4.11 Sources of Capital According to Marketing
Actors (in percentage) 68
Table 4.12 Source of Borrowing Capital by Origin (%) 69 Table 5.1 Policy Matrix of Government Intervention
on Rice Trade 77
Table 5.2 State Procurement, Compared to
Rice Production 78
Table 5.3 Rice Importing Companies for Bulog 1997/1998 79 Table 5.4 Quantity and Volume of Imported Rice,
1993-1998 81
Table 5.5 Liquidity Credit from the Bank of Indonesia (KLBI) for the State Procurements on Rice
and Sugar 82
Table 5.6 The Special Market Operation (OPK)
Table 6.1 Estimated amount and Sources of
Inefficiency in Bulog 94
Table A1 Sample Distribution of Farmer 119
Table A2 Farming Experience (year) 119
Table A3 Land Size of Farms (ha) 120
Table A4 Land Status by Farmer 120
Table A5 Seed Varieties used by Farmer in
Current Year 121
Table A6 Structure of Marketing Cost (Rp/ha) 121
Table A7 Is Capital a Main Constraint? 121
Table A8 Farm’s Experience (year) 122
Table A9 Land Size of Farmer (ha) 122
Table B1 Classification of Trader Respondents (%) 125 Table B2 Sampling Distribution for Farmer 125 Table B3 Classification of Trader Respondents by Sex (%) 125 Table B4 Status of Trader Respondents (%) 126 Table B5 Level of Education Among Trader
Respondents (%) 126
Table B6 Cost Components of Traders (%) 127
Table B7 Components of Marketing Cost (Rp/Ton) 128 Table B8 Components of Marketing Cost (Rp/Ton) 128 Table B9 Sources of Buying and Payment Mechanism 129
Table B10 Sex of Sample Farmers 129
Table B11 The Object of Rice Distribution 130 Table B12 The Object of Rice Distribution 130
Table B13 Sources of Borrowing Capital 131
Table B14 Capital Resources 132
Table B15 Ownership of Trading Place 132
Table B16 Kind Firm 133
Food Security and Markets in Indonesia
Introduction
his is the final report of a research on food security and mar-kets in Indonesia. The research is part of a wider study on food security and markets covering the Southeast Asian countries of Thailand, Vietnam, the Philippines, and Indonesia.
The primary objective of this NGO-based research is to ex-amine the interaction between the state and the private sector in the process of rice trading in Indonesia. The research is aimed at generating policy proposals for promoting the development of sustainable and dynamic rice-producing sectors capable of improv-ing food security and markets in the country.
Data for this report was drawn primarily from field investiga-tion, in-depth interviews and desk analyses. Field investigation was conducted in four Indonesian provinces, namely, West Java, East Java, Lampung and DKI Jakarta, from May to June 1999. Collector traders, rice milling units, wholesalers, retailers and farm-ers in the four provinces were interviewed directly, using a tradi-tional questionnaire. Likewise were policy-makers and govern-ment officers, researchers and university faculty members, on whom were used an open-ended questionnaire.
This report is organized in the following manner. Chapter 2 reviews the general concept and application of food security and markets, including price stabilization policies and rice trading structures. Chapter 3 examines recent developments in the Indo-nesian rice economy, covering trends in rice production and con-sumption, movements of domestic and border prices, import and buffer stock arguments, and regional disparities in rice security. Chapter 4 examines the role of the private sector in rice trading,
1.
Introduction
with emphasis on rice trading map and patterns of transaction. An analysis of marketing margins and economic and marketing efficiencies is used as a basis for arriving at new investment deci-sions.
Food Security and Markets in Indonesia
Review of Food Security and Markets
his chapter reviews food security measures and rice mar-kets in Indonesia, which is now confronting one of the most serious food security episodes in its post-independence history. In terms of food availability, the principal problem has been the long drought induced by the El Niño phenomenon and forest fires, which have adversely affected the country's production ca-pacity. Compounding this was the Asian financial crisis, which has impacted on Indonesians in terms of high inflation, dimin-ished purchasing power and increased poverty levels.
Indonesia has been plagued by several years of slow, below expectation growth in its food supply. The Government responded by sharply increasing food imports to fill gaps in domestic demand. But the current economic crisis has also sharply increased the number of those needing food security. Many families with income below the poverty line in 1996 could no longer keep up with the rapidly rising prices of essential commodities.
This chapter is focused on the evolution, particularly over the last three decades, of food security measures in Indonesia. A re-view of price stabilization policies not only covers the theoretical debates, but also incorporates the latest discussions concerning the government's intervention in the rice and food market since the economic crisis hit Indonesia. A general review of the rice trading structure also follows. This chapter concludes with the methodol-ogy and the chronological and systematic approach that the au-thors took in undertaking this study.
2.
Review of Food Security
and Markets
2.1 Evaluation of Food Security Measures
Food security has several dimensions, all of which face different threats. The Food and Agricultural Organization (FAO, 1997) defines food security as a situation in which all households have both physical and economic access to adequate food for all mem-bers, and where households are not at risk of losing such access. There are three dimensions implicit in this definition: availability, stability and access.
Adequate food availability means that, on average, available food supplies are sufficient to meet consumption needs. Stability refers to minimizing the possibility of food consumption falling below requirements during difficult years or seasons. Access draws attention to the fact that even with bountiful supplies, many people still go hungry because they do not have the resources to produce or purchase the food they need.
Food security can also be defined at different levels: for na-tions, regions or households. Ultimately, food security concerns the individual or family unit, and its principal determinant is pur-chasing power at the income adjusted for the cost of living. Simi-larly, purchasing power at the national level, i.e., the amount of foreign exchange available to pay for necessary food imports, is a key determinant of national food security. Therefore, food secu-rity is not only a question of poverty, but also a question of the proportion of income that households devote to food. The poor-est people in the developing countries of the world spend 80 per-cent or more of their earnings on food.
program. The BIMAS involved intensification efforts at the na-tional level, and its pilot projects were primarily located in Java on sites with good irrigation systems and rural infrastructure. More importantly, the BIMAS program involved a credit system, input provision and distribution. Farmers were encouraged to establish cooperative units and supporting institutions at the village level to help manage credit and new input distribution.
Other government programs with different names but simi-lar aims have since evolved. To name a few, there is: INMAS (mass intensification), aimed at providing additional technical assistance in production technology; INSUS (special intensification), aimed at encouraging institutional innovation and technological change among farmers, and OPSUS (special operation), aimed at open-ing new rice fields in transmigration areas, etc.
Programs of rice-price stabilization, rural infrastructure and irrigation investment, human resource development, and the generation and dissemination of improved food crop technology have generally been undertaken to support the campaign to pro-mote self-sufficiency in rice. In 1967, the government established the Food Logistic Agency, better known as BULOG (Badan Urusan Logistik). Its roles included stabilization of rice prices and provi-sion of monthly rice rations to the military and members of the civil service. By the late 1980s, BULOG, while still playing its original role in rice markets, had assumed the additional respon-sibility of handling or monitoring sugar, wheat, corn, soybeans, soy meals, and a number of other lesser commodities.
As a result of such programs, food availability per capita in-creased from around 2000 calories per day in the 1960s to close to 2700 calories per day by the early 1990s (FAO, 1996). The pro-portion of the population under the poverty line fell from 44 per-cent in the 1970s to 11 perper-cent in 1996. The combination of higher levels of food availability and a much smaller poor population sig-nificantly enhanced food security at both the national and house-hold levels.
in-creased to 79.4 million or 39.1 percent of the country's total popu-lation (Central Agency of Statistics, 1998). A World Bank report (1999) also estimated that a 12 percent decline in Gross Domestic Product (GDP) could increase the poverty rate by almost 40 per-cent. Poverty in urban areas is expected to be higher in urban areas than in rural areas. A joint report of the International La-bor Organization and the United Nations Development Programme (ILO/UNDP, 1998) has estimated the poor to now constitute 48 percent of Indonesia's population, given an inflation rate of 80 percent and a poverty line that has also increased by 80 percent.
Since January 1998, Indonesia has turned to the International Monetary Fund (IMF) and the World Bank to rescue and stabilize the economy. Donors have mobilized commitments for a total sta-bilization package amounting to US$ 43 billion. In exchange for the extraordinary loans they have extended, donors are insisting that Indonesia reform its macroeconomic and structural policies to ensure that financial stability would be restored and that the economy would be managed in a more competitive and transpar-ent manner. One major IMF conditionality is for BULOG's op-erations to be limited to rice and for subsidies on other food and essential goods to be scaled down sharply.
In December of 1998, the transitional government under President B.J. Habibie committed to improve transparency in the rice pricing policy and distribution system and to allow a contest-able chance and fair opportunity for economic actors in rice trad-ing. This immediate change adversely affected the flow of rice distribution, especially in remote areas of Indonesia. As a result, people have started to question BULOG's capacity to implement the system in a manner that would assure a more efficient use of resources and more affordable food and rice for low-income con-sumers.
2.2 Price Stabilization Policy
extended periods of time. Some think that the social benefits arising from stabilized prices are small or even negative (Ravallion, 1987; Behrman, 1987). Political economists argue that institu-tional costs, including corruption, incurred in stabilizing prices are much higher than even potentially large benefits accruing from price stability (Knudsen and Nash, 1990; Schiff and Valdes, 1992). They also aver a strong tendency of stabilization policy to be cap-tured by vested interests who favor higher or lower prices rather than stability per se.
On the other hand, there are economists who argue that coun-tries where majority of consumers are still poor and rice is the dominant staple food have found much help in stabilization policy and have therefore given it considerable attention. Majority of Asian countries, in fact, have successfully managed to keep their domestic rice prices more stable than rice prices in the world mar-ket. In the last five decades, countries most successful at price stabilization have also been among the fastest growing economies in the world. Where food prices have not been stabilized success-fully and food security remains questionable, political stability and economic growth have been threatened (Timmer, 1993; Pinckney, 1993).
Price stabilization in Indonesia has provided exemplary op-portunities for testing the effectiveness and workability of such a government intervention. Since the late 1960s, Indonesia has tried to maintain a price band on rice by applying dual policies on price stabilization. The first is floor price policy, which is aimed at keep-ing the farm-gate price of rice well above the production costs. BULOG serves as a stabilizing agent and buys any amount of rice production not absorbed by the market, especially during the har-vest season. This rice procurement approach is generally used for the national buffer stocks and for rations to the military and civil service. The second is ceiling price policy, which is intended to keep rice affordable for lower-income consumers. The price of rice increases sharply during the planting seasons and during droughts. During such crises, BULOG performs market opera-tions by selling very cheap rice to targeted consumers.
After more than 20 years of economic and political instability under President Soekarno, an entirely new approach of the economy was introduced by the New Order regime of President Soeharto. A key element of this approach was heavy investment in the rural economy to increase rice production coupled with sustained efforts to stabilize rice price. Empirical evidence sug-gests that these efforts were highly successful. Rice production rose from 4.6 percent per year in the 1969-1990 period, which was significantly faster than the 2.1 percent growth in population over the same period. Land productivity of rice agriculture in-creased significantly, about 2.7 percent per year, even though this was not evenly distributed among regions across the country. The considerable growth in land productivity was also achieved by a tremendous amount of government expenditures. These included irrigation operation and maintenance, subsidized credits for rice and secondary food crops, intensification programs, subsidized pesticides and fertilizers and rice and buffer stock programs (Arifin, 1997).
1995). Whenever domestic prices fail to follow border prices, there would always be short-run efficiency losses of the sort identified in the border price paradigm. Events in the 1990s, such as the rice surpluses experienced in 1992 and 1993 as a result of manage-ment through export subsidies, have raised serious questions about BULOG's cost structure and its long-term role in the rice economy (Timmer, 1996). The drought of 1994 and El Niño in 1997, and the resumption of large scale imports in the last two years, have also raised questions about BULOG's ability to stabilize rice prices, even in the short-run.
2.3 Structure of Rice Trading
In this section, the structure of rice trading is presented in a general fashion based on data from available literature. The sub-ject is more thoroughly examined later in the light of the results of field observation of rice trading in Indonesia.
As mentioned briefly in the previous sections, rice trading in Indonesia is an interaction between the government rice market and the actual rice market governed by the price system. The composition of the two markets at the national level is not well documented, and could vary significantly depending on the defi-nition and scope of the market being used. Rice trading and rice distribution through the so-called "free market" accounts for more than 80 percent of total rice trading activities. The remaining 20 percent constitutes that which passes through government agen-cies like BULOG, Depot Logistics at the provincial level (DOLOG) and cooperatives (KUD) at the rural level (Mubyarto, 1998; Ruky, 1999).
These observations are very likely based either on the assump-tion of normal condiassump-tions in the rice distribuassump-tion system, or that provision for military and civil service constitutes government rice trading. During a severe crisis period, government trading be-comes more dominant, especially when market operation is in-volved. A special report by Smeru (1998) confirms that special market operations (Operasi Pasar Khusus or OPK) performed by BULOG reached nearly 13 million poor families in 1998. In addi-tion, the market operation under a scheme of Social Safety Net (SSN) program conducted by the State Ministry of Welfare Affairs (BKKBN) was able to distribute cheap rice to nearly 17 million targeted poor families in 1998.
It becomes clear now that buffer stock management not only requires efficient trading and effective distribution systems which are able to reach remote areas of the country; it also needs access to more accurate market information at the micro level, particu-larly information on producers and consumers' performance and preference for particular types of rice. Failure to access such in-formation causes the rice trading and distribution systems to be-come inefficient and the buffer stock systems to be mismanaged. In addition, institutions responsible for the national buffer stocks also become exposed to ineffective banking systems and to non-flexible access to other financial systems, as what happened when the economic crisis hit Indonesia.
As a stabilizing agent and buffer stock institution, BULOG often experiences delays in transferring procurement funds to rural cooperatives (KUD). This delay obviously affects the overall performance of national rice procurement systems and buffer stock operations. This is because only farmers who could delay the har-vest time and who could afford high storage costs could sell rice to the government. Under such a condition, it is only the financially well-off farmers who are able to benefit from the system (Ruky, 1999). Poor farmers, who could not sell their rice to the govern-ment trading systems, become automatically ineligible to join the floor rice policy. These are the farmers who could not fulfill the minimum requirements of 14 percent water content and five per-cent broken rice, etc. If they insist on selling their rice, they get a farm-gate price that is well below the standard floor price.
The transition government of B.J. Habibie tried to foster transparency in rice importation through the use of the interna-tional competitive bidding mechanism. This strategy should be further encouraged and supported by legal security, proper in-stitutional arrangements, and a policy thrust towards freer and fairer competition. Otherwise, the market reform within the in-ternal organization of BULOG and in the Indonesian economy as a whole will never be started.
2.4 Methodology of the Study
This study on "food security and markets in Indonesia: the state and private sector interaction in rice trade" was conducted using the methodology of field investigation, in-depth interviews and desk analysis of the subject. Four Indonesian provinces, namely, West Java, East Java, Lampung and DKI Jakarta were chosen, by purposive sampling technique, to be the subject of field investiga-tion. Such investigation was conducted from May to June 1999. Java was selected because it represents about 60 percent of the total population of Indonesia while Lampung province was se-lected because it is one of the major rice baskets in the island of Sumatra.
A more structured interview was conducted using a traditional questionnaire, with collector traders, rice milling units, wholesal-ers, and retailers in the four provinces as respondent-interviewees. Additional questionnaires for farmers were also used to investi-gate rice-selling and other farming activities in the region.
An open-ended questionnaire was used to interview policy makers and government officers. Key informants included the Chief of Depot Logistics (DOLOG) at the provincial level and Sub-Dolog at the district level, the Head of Agricultural Services (Dinas Pertanian Tanaman Pangan dan Hortikultura) at both the provin-cial and district levels, officers of the Ministry of Industry and Trade (Depperindag), the Ministry of Cooperatives and Small-Medium Enterprises Development (Depkop dan PKM), and researchers and faculty members of a local university.
vicin-ity of South and East Jakarta. In-depth interviews were also conducted with government officials connected with the National Logistic Agency (BULOG), the State Ministry of Food and Hor-ticultural Affairs (Menpangan), Ministry of Agriculture (Deptan), National Development Planning Agency (Bappenas), People's Leg-islative Council (DPR), Depperindag, Depkop dan PKM, research-ers with the Univresearch-ersity of Indonesia's Institute for Economic and Society Research (LPEM-UI), Institute for Resource Information at Bogor Agricultural University (LSI-IPB), Center for Agricul-tural Policy Studies (CAPS), and the World Bank Indonesia Of-fice.
For West Java, the field investigation was concentrated in Bandung, and the District of Karawang and Cianjur. These dis-tricts comprise the center of rice paddy production in West Java. In the City of Bandung, the observation was done around the market place of Pasar Gede Bage, Pasar Caringin and Pasar Soreang.
The field investigation in the province of East Java was con-ducted in Surabaya, the capital, and the two district production centers of Malang and Sidoarjo. The city of Surabaya, the second largest in the country, was selected as a consumer area,.
In Lampung, the investigation was concentrated in the city of Bandar Lampung, specifically in the Pasar Bambu Kuning and Pasar Koga areas, and the three districts of Central Lampung, South Lampung and Tanggamus; these areas comprise the provinvial rice production center. Observation of rice milling units and traders in the market place was focused in Pasar Metro and Trimurjo in Central Lampung and Pasar Gedong Tataan in South Lampung, and Pasar Talang Padang in the District of Tanggamus. Interviews with farmers were conducted at the vil-lage level, particularly in the sub-district (Kecamatan) of Punggur and Trimurjo in Central Lampung; the sub-district of Gedong Tataan and Sri Bhawono in South Lampung; and, the sub-district of Talang Padang in Tanggamus.
The number, composition and distribution of samples for each study location are described in the following table:
Table 2.1
Number, Composition and Distribution of Sample for Traders and Farmers in the Study Locations:
No.
Study Location (Province)
Traders Farmers
1 West Java 78 40.80 % 15 24.00 %
2 East Java 77 40.30 % 21 34.00 %
3 Lampung 20 10.50 % 25 41.00 %
4 DKI Jakarta 16 8.40 % -
Food Security and Markets in Indonesia
his chapter examines recent developments in the rice economy of Indonesia. Focus of analysis is on trends in rice production and consumption, price movements and price differentials between domestic price and domestic price. Examination of rice import and buffer stock arguments proposed by the government will complement the analysis of price differentials. Finally, regional disparities in rice security are tackled to surface and strengthen arguments regarding the importance of harmonious interaction between the state and private sector in rice trading in Indonesia.
3.1 Trends in Rice Production and Consumption
Rice production declined in 1998 on account mainly of the follow-ing factors: severe drought impact of El Niño in 1997; the wet seasons of La Niña in 1998; rice field conversion to non-rice land uses; and other agro-climatic factors unfriendly to rice produc-tion. Data from the Central Agency of Statistics (CAS) and the Ministry of Agriculture show that rice production in 1998 was 46.3 million ton in the form of dried rice grain (GKG) or about 26.3 million ton rice equivalent. This amount represents a sizable 23 percent decline from rice production levels in 1996 and a slower 9 percent decline from 1997 levels. Rice production in 1996 reached 55.1 million tons (grain terms) or 33.1 million tons (rice), while production in 1997 reached 49.4 million tons (grain) or 32.1 mil-lion tons (rice).
By region, declines in rice production were significant only in Java. Some regions such as North Sumatra and West Nusa Tenggara actually experienced large increases in rice production
3.
in the Rice Economy
in the Rice Economy
in the Rice Economy
in the Rice Economy
in 1997 and 1998, compared with 1996. In East Nusa Tenggara, where drought effects were generally severe, decline in rice pro-duction was quite small in 1998. Given the highly diverse and regional effects of the crisis, these data reveal the difficulty of mak-ing statements about the crisis’ national effects on agriculture, es-pecially on rice production. A general observation suggests that a policy failure in the production system would contribute to a sharp decline (25-30 percent) in rice production, a development that, in turn, could affect the national stock of rice. What Indonesia should adopt therefore is an integrated policy strategy in the food pro-duction system, particularly in rice. Such strategy should cover seed procurement, broaden fertilizer subsidy, reform the credit system for production factors, improve extension methods and management, decentralize upland management, etc.
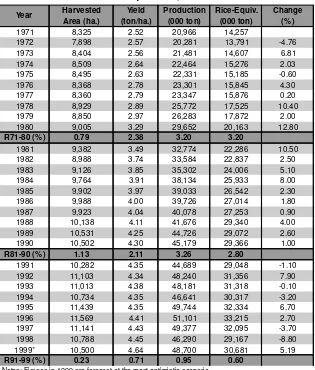
Based on the most optimistic forecast, rice production in 1999 could reach 48.7 million tons in grain or about 30 million tons in rice (Table 3.1).
The table also shows that the growth in food crop has contrib-uted to the agricultural overall economic growth. During the first half of 1980s, food crop grew at a rate of more than 8 percent per year, mostly because of the peak success of Green Revolution tech-nology. This has enabled Indonesia to achieve a level of self-suffi-ciency in the mid-1980s, a development that analysts called a “miracle of Indonesian agriculture.” Such growth performance, however, slowed down in the first half of the 1990s, and continued to decline in the second half of the decade, due to a combination of economic, policy, ecological and natural problems. Some of these problems included unfavorable agricultural commodity prices, slower rate of agricultural land expansion, ecological limits on in-creased cropping intensity, severe droughts and unanticipated cli-matic factors.
Land productivity in food crop areas has been increasing over the last three decades on account of several factors, namely, in-creased land expansion, intensified land-use and yields phases (Arifin, 1997). Specifically, improvement in the sources of produc-tion growth and diversificaproduc-tion has effectively increased land pro-ductivity. Technological change through more intensive land-use
Table 3.1
Growth of Harvested Area, Yield, Production, and Rice Equivalent, 1971-1999
1971 8,325 2.52 20,966 14,257
1972 7,898 2.57 20,281 13,791 -4.76
1973 8,404 2.56 21,481 14,607 6.81
1974 8,509 2.64 22,464 15,276 2.03
1975 8,495 2.63 22,331 15,185 -0.60
1976 8,368 2.78 23,301 15,845 4.30
1977 8,360 2.79 23,347 15,876 0.20
1978 8,929 2.89 25,772 17,525 10.40
1979 8,850 2.97 26,283 17,872 2.00
1980 9,005 3.29 29,652 20,163 12.80
R71-80 (% ) 0.79 2.38 3.20 3.20
1981 9,382 3.49 32,774 22,286 10.50
1982 8,988 3.74 33,584 22,837 2.50
1983 9,126 3.85 35,302 24,006 5.10
1984 9,764 3.91 38,134 25,933 8.00
1985 9,902 3.97 39,033 26,542 2.30
1986 9,988 4.00 39,726 27,014 1.80
1987 9,923 4.04 40,078 27,253 0.90
1988 10,138 4.11 41,676 29,340 4.00
1989 10,531 4.25 44,726 29,072 2.60
1990 10,502 4.30 45,179 29,366 1.00
R81-90 (% ) 1.13 2.11 3.26 2.80
1991 10,282 4.35 44,689 29,048 -1.10
1992 11,103 4.34 48,240 31,356 7.90
1993 11,013 4.38 48,181 31,318 -0.10
1994 10,734 4.35 46,641 30,317 -3.20
1995 11,439 4.35 49,744 32,334 6.70
1996 11,569 4.41 51,101 33,215 2.70
1997 11,141 4.43 49,377 32,095 -3.70
1998 10,788 4.45 46,290 29,167 -8.80
1999* 10,500 4.64 48,700 30,681 5.19
R91-99 (% ) 0.23 0.71 0.95 0.60
Notes: Figures in 1999 are forecast at the most optimistic scenario
practices such as the application of fertilizer and utilization of new varieties has also increased land productivity. Likewise with improvement of irrigated lands, which has stimulated the inten-sity of agricultural land use and increased yields per harvested area. On the whole, with the decrease in the land-labor ratio and the progressive use of bio-chemical inputs, agricultural labor pro-ductivity has also improved.
On the national level, the use of bio-chemical inputs corresponds negatively with farm size but positively with labor force and irri-gated land. This coincides with small holding concentration in Javanese agriculture due to subdivision through inheritance and large holding consolidation of uncultivated land outside Java. Given the limitation of a fixed supply of land, farmers with smaller holdings utilize the land more intensively, for example, by apply-ing more bio-chemical and other land-savapply-ing inputs. Larger hold-ers, on the other hand, tend to face more complex management problems as they apply more bio-chemical inputs and hire non-family labor despite their having better access to credit or capital markets.
There is a difference in the extent of labor used in the applica-tion of bio-chemical technology in lowland and upland areas. In lowland areas, more labor force is required in applying bio-chemical technology, including new varieties, fertilizer and other chemical inputs, and other land “investment” activities such as land cleing, levelcleing, and maintaining irrigation channels. In upland ar-eas where farmers grow mostly cash crops and secondary food crops, more labor force is needed for fertilizing, weeding, and harvesting. In the steep slopes of the uplands, land “investment” includes the adoption of conservation practices to minimize land degradation.
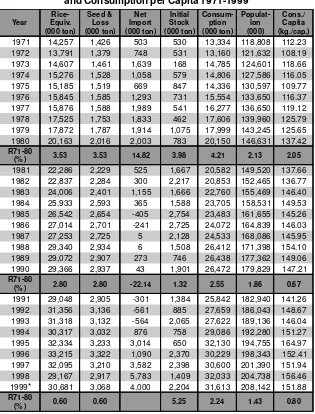
method used by BULOG follows the concept of stocking and logistic, where available rice production —less 10 percent loss and expenses for seed needs—is added to net imports to arrive at the consumption figure. BULOG’s estimate should be viewed as the upper level of consumption since it includes stocks pre-served by consumers, traders and rice milling units (Table 3.2).
What becomes clear is that the level of rice consumption in Indonesia is now the highest among Asian countries. Average rice consumption per capita in the most populous country, China, is only 80 kilograms (kg) per year. The consumption level in Ko-rea and Japan is 70 and 60 kg, respectively, which is a significant decline from figures two decades ago. Given that the production performance is somewhat dependent on volatile natural and eco-nomic conditions, the high rice consumption level carries an im-plication on the amount of rice traded in the world market. Prob-lems usually arise when the world rice trade and distribution ac-tivities are not operated properly due to bureaucratic misman-agement of the rice price stabilization and consumption subsidies. The very high level of rice consumption could trigger more prob-lems for the Indonesian economy unless the diversification move-ment began in the last decade is operationalized beyond paper. The movement could probably be combined with the develop-ment of a type of food technology that is simple yet modern, complements, and is compatible with Indonesia’s food produc-tion system.
Another important issue in rice consumption is food subsidy. The Indonesian government provided subsidies for the import and sale of rice, and some other staple foods, until 1998. For that year, the amount of food subsidy was estimated to rise from around Rp 12 trillion to Rp 14 trillion for rice, sugar, soybeans, wheat corn, soymeal and fishmeal. It is a well known fact that food crop producers are among the poorest in Indonesia. Policies, which depress food prices, will reduce welfare allocations for these groups. Tabor et al. (1998) suggest that in the case of “major” price distor-tions, the welfare effects are typically much larger than the fiscal effects of subsidies.
expendi-tures. The 1996 SUSENAS data also show that only about 28 percent of the total rice supply are consumed by the lowest 30 percent of income-earners. The upper 70 percent of income
Year 1971 14,257 1,426 503 530 13,334 118,808 112.23 1972 13,791 1,379 748 531 13,160 121,632 108.19 1973 14,607 1,461 1,639 168 14,785 124,601 118.66 1974 15,276 1,528 1,058 579 14,806 127,586 116.05 1975 15,185 1,519 669 847 14,336 130,597 109.77 1976 15,845 1,585 1,293 731 15,554 133,650 116.37 1977 15,876 1,588 1,989 541 16,277 136,650 119.12 1978 17,525 1,753 1,833 462 17,606 139,960 125.79 1979 17,872 1,787 1,914 1,075 17,999 143,245 125.65 1980 20,163 2,016 2,003 783 20,150 146,631 137.42 R71-80
(% ) 3.53 3.53 14.82 3.98 4.21 2.13 2.05 1981 22,286 2,229 525 1,667 20,582 149,520 137.66 1982 22,837 2,284 300 2,217 20,853 152,465 136.77 1983 24,006 2,401 1,155 1,666 22,760 155,469 146.40 1984 25,933 2,593 365 1,588 23,705 158,531 149.53 1985 26,542 2,654 -405 2,754 23,483 161,655 145.26 1986 27,014 2,701 -241 2,725 24,072 164,839 146.03 1987 27,253 2,725 5 2,128 24,533 168,086 145.95 1988 29,340 2,934 6 1,508 26,412 171,398 154.10 1989 29,072 2,907 273 746 26,438 177,362 149.06 1990 29,366 2,937 43 1,901 26,472 179,829 147.21 R71-80
(% ) 2.80 2.80 -22.14 1.32 2.55 1.86 0.67 1991 29,048 2,905 -301 1,384 25,842 182,940 141.26 1992 31,356 3,136 -561 885 27,659 186,043 148.67 1993 31,318 3,132 -564 2,065 27,622 189,136 146.04 1994 30,317 3,032 876 758 29,086 192,280 151.27 1995 32,334 3,233 3,014 650 32,130 194,755 164.97 1996 33,215 3,322 1,090 2,370 30,229 198,343 152.41 1997 32,095 3,210 3,582 2,398 30,600 201,390 151.94 1998 29,167 2,917 5,783 1,409 32,033 204,738 156.46 1999* 30,681 3,068 4,000 2,204 31,613 208,142 151.88 R71-80
(% ) 0.60 0.60 5.25 2.24 1.43 0.80
Table 3.2
Rice Consumption, Net Import, Initial Stock, and Consumption per Capita 1971-1999
Notes: + Data for 1994-1997 are figures for the fiscal year (starting from April 1) * Data for 1999 are forecast at the most optimistic scenario
consume 72 percent. Therefore, targeting food relief directly to the food insecure – in urban areas – might provide a more cost-effective way of providing assistance to the poor compared to just providing general price subsidies.
In August 1998, the government introduced a targeted rice subsidy program, the OPK in order to protect the rice consump-tion levels of low-income households. In September, the govern-ment announced that BULOG would confine its agricultural mar-ket activities to rice only and would dispose of its non-rice food stocks. In other words, the government has liberalized trade in sugarcane, wheat, soybeans and rice. In November, the govern-ment also abolished fertilizer subsidies, liberalized fertilizer im-ports, and announced that domestic fertilizer companies could peg their own market price. In addition, the government increased subsidized credit for food crop production, lowered agricultural lending rates from 12 to 10.5 percent, and forgave payments on pre-1996 agricultural loans. These policy changes from a low and subsidized output and agricultural input pricing policy to a mar-ket-oriented agricultural pricing policy are yet to be fully imple-mented.
3.2 Price Movement: Differentials
of Domestic and Border Price
Despite the price stabilization policy, rice price is still very much influenced by the current economic crisis. The price disparity between producers and consumers, between domestic and border prices, is really disturbing. In 1998, the disparity between con-sumer and farm-gate prices was more than double, between Rp 2500-Rp 3000 and Rp 1500 per kilogram, the announced floor price. Price disparity is worse in remote areas outside Java where infrastructures are not adequate in supporting rice distribution and trading activities.
disin-centive for rice farmers to improve the production performance and productivity.
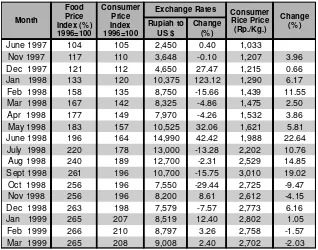
The government tried to close this price band through the OPK program (aimed especially at the urban poor) and other efforts to lower the consumer price of rice. By the end of 1998, rice prices had declined by 10 percent and was projected to continue declin-ing due to weather conditions more favorable for rice production. Public stocks for rice were adequate and import prices were much lower than those in 1997. Average consumer rice price in some cities of Indonesia, in fact, declined from Rp 2700 to as low as Rp 2300 per kilogram in September of 1998 (Table 3.3).
Food prices generally contributed to the significant decline in the rate of inflation and the consumer price index at the start of 1999. The monthly inflation rate for January and February that year was pegged at 2.97 and 1.26 percent, respectively. The
Table 3.3
Food Price, Consumer Price, Exchange Rate and Rice Price during the Economic Crisis (June 1997 – March 1999)
Month
June 1997 104 105 2,450 0.40 1,033
Nov 1997 117 110 3,648 -0.10 1,207 3.96
Dec 1997 121 112 4,650 27.47 1,215 0.66
Jan 1998 133 120 10,375 123.12 1,290 6.17
Feb 1998 158 135 8,750 -15.66 1,439 11.55
Mar 1998 167 142 8,325 -4.86 1,475 2.50
Apr 1998 177 149 7,970 -4.26 1,532 3.86
May 1998 183 157 10,525 32.06 1,621 5.81
June 1998 196 164 14,990 42.42 1,988 22.64
July 1998 220 178 13,000 -13.28 2,202 10.76
Aug 1998 240 189 12,700 -2.31 2,529 14.85
Sept 1998 261 196 10,700 -15.75 3,010 19.02
Oct 1998 256 196 7,550 -29.44 2,725 -9.47
Nov 1998 256 196 8,200 8.61 2,612 -4.15
Dec 1998 263 198 7,579 -7.57 2,773 6.16
Jan 1999 265 207 8,519 12.40 2,802 1.05
Feb 1999 266 210 8,797 3.26 2,758 -1.57
Mar 1999 265 208 9,008 2.40 2,702 -2.03
downtrend continued through the months of March to July when it reached a deflation rate of less than negative one percent. Some saw this change as a positive sign for the economy, but others were worried that the decline indicated a slowdown in consumer pur-chasing power to a level worse than had earlier been projected.
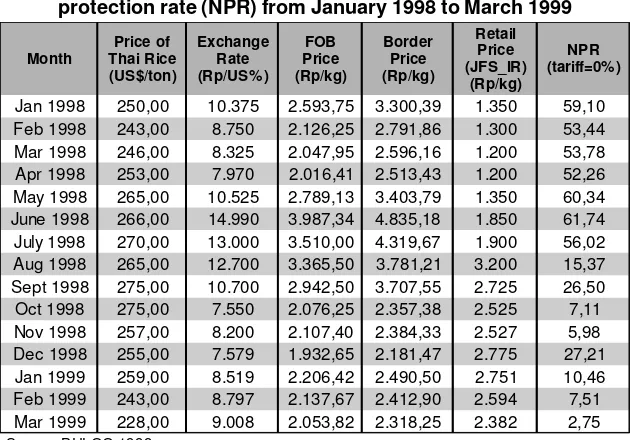
To be sure, the domestic rice retail price was still high for most local consumers but the price movement was still low compared to the international market. Another consideration is the exchange rate. In 1998, the Rupiah depreciated more than five times rela-tive to the US dollar. This development was favorable to Indone-sia as the price movement served as a “protection” against the flooding of rice imports into the domestic market. Based on the nominal protection rate (NPR), the domestic price of rice in Janu-ary 1998 was 59 percent lower than its border price. The highest price difference occurred in June 1998 when the domestic price was 62 percent lower than the world market.
Such price movement also represents an incentive for traders to re-export the cheap rice import to the world market where it would generate more economic rents. Some media reports have
Table 3.4
Domestic, world market, border price and nominal protection rate (NPR) from January 1998 to March 1999
Month
Jan 1998 250,00 10.375 2.593,75 3.300,39 1.350 59,10 Feb 1998 243,00 8.750 2.126,25 2.791,86 1.300 53,44 Mar 1998 246,00 8.325 2.047,95 2.596,16 1.200 53,78 Apr 1998 253,00 7.970 2.016,41 2.513,43 1.200 52,26 May 1998 265,00 10.525 2.789,13 3.403,79 1.350 60,34 June 1998 266,00 14.990 3.987,34 4.835,18 1.850 61,74 July 1998 270,00 13.000 3.510,00 4.319,67 1.900 56,02 Aug 1998 265,00 12.700 3.365,50 3.781,21 3.200 15,37 Sept 1998 275,00 10.700 2.942,50 3.707,55 2.725 26,50 Oct 1998 275,00 7.550 2.076,25 2.357,38 2.525 7,11 Nov 1998 257,00 8.200 2.107,40 2.384,33 2.527 5,98 Dec 1998 255,00 7.579 1.932,65 2.181,47 2.775 27,21
already indicated this tendency but it would be better if a legiti-mate verification and reconfirmation at the field level is conducted. Yet another issue related to rice price movements is the influ-ence of rice imports on farm gate prices. BULOG authorities in-sist they only import high-quality rice while the Ministry of Agri-culture claims that only lower grades are imported. The situation becomes more complicated when BULOG and the Ministry of Co-operatives and Small-Medium Scale-Enterprises – which is respon-sible for some local procurement and distribution – begin accus-ing each other of spreadaccus-ing illegal mixtures of low-quality imported rice and high-quality local rice.
3.3 Import and Buffer Stock Arguments
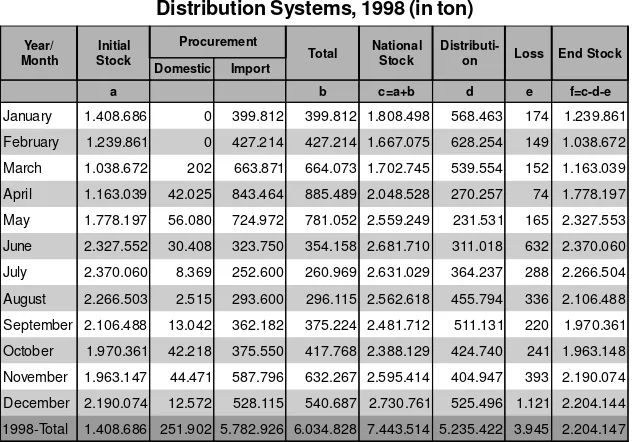
The government maintains public rice stocks amounting to around 2 million metric tons as a buffer against possible disrup-tions in world market trade. It is alright to import rice to main-tain the buffer stocks in light of domestic rice production, which is generally lower than consumption, especially during bad weather conditions. The amount of imported rice grew significantly from 1.3 million tons in 1995 to nearly 6 million tons in 1998. The government maintains these buffer stock arguments for the sake of national food security, especially as this relates to the so-called “budget group,” which includes the military and civil servants.
Due to the effects of El Niño in 1997, BULOG considered it necessary to build up its stocks to anticipate the production de-cline projected for 1998. The 1997 and 1998 stocks came mostly from imports, a departure from the last two decades when BULOG acquired most of its rice from domestic sources. Then, import pro-curements became necessary only for buffer stocking purposes and to support the price stabilization policy.
tons, after a 3.9 thousand ton loss, by December of 1998 (Table 3.5).
In line with the buffer stock arguments, the government in-vested tremendously in warehouses, offices and other infrastruc-tures. Rural cooperatives also became involved in the buffer stock business, procuring from local farmers especially during the har-vest season and in market operation, importing rice themselves during the planting season and when the current economic crisis erupted. With over 2,400 grain warehouses in the country, the government has the largest network of food storage facilities, one of the reasons why it is considered a monopoly in the rice distribu-tion system.
But the government does not merely engage in rice importa-tion. It controls the business, participating in all its phases from planning to ensure quality and quantity to appointing the con-tractor-traders. It usually pursues a “big country” argument whereby it assumes total demand for rice as being very high. Given this argument, Indonesia’s trading behavior and its distribution
Table 3.5
Rice Stocks, Procurement and Distribution Systems, 1998 (in ton)
Year/
January 1.408.686 0 399.812 399.812 1.808.498 568.463 174 1.239.861
February 1.239.861 0 427.214 427.214 1.667.075 628.254 149 1.038.672
March 1.038.672 202 663.871 664.073 1.702.745 539.554 152 1.163.039
April 1.163.039 42.025 843.464 885.489 2.048.528 270.257 74 1.778.197
May 1.778.197 56.080 724.972 781.052 2.559.249 231.531 165 2.327.553
June 2.327.552 30.408 323.750 354.158 2.681.710 311.018 632 2.370.060
July 2.370.060 8.369 252.600 260.969 2.631.029 364.237 288 2.266.504
August 2.266.503 2.515 293.600 296.115 2.562.618 455.794 336 2.106.488
September 2.106.488 13.042 362.182 375.224 2.481.712 511.131 220 1.970.361
October 1.970.361 42.218 375.550 417.768 2.388.129 424.740 241 1.963.148
November 1.963.147 44.471 587.796 632.267 2.595.414 404.947 393 2.190.074
December 2.190.074 12.572 528.115 540.687 2.730.761 525.496 1.121 2.204.144
1998-Total 1.408.686 251.902 5.782.926 6.034.828 7.443.514 5.235.422 3.945 2.204.147
activities necessarily affect the world market. A government esti-mate suggests that each additional ton of rice import by Indonesia increases the world market price for rice by as much as US$ 50 per ton (Silitonga, et al. 1997). This argument justifies non-trans-parent government behavior in rice importation but runs counter to the interest of many poorer countries in Asia and Africa which could end up victims of unfair world trading in rice. It is a simpli-fication that obviously must be reviewed if Indonesia is to move towards greater trade liberalization and lesser government mo-nopoly in rice trading and distribution.
Rice importations are a convenient way of easing the political pressure on the government when it is faced with dwindling rice stocks. As pointed out earlier, the imported rice are sold at subsi-dized prices locally. The policy of importing rice and selling them at a loss domestically has the effect of depressing domestic prices. This favors consumers, especially those with higher incomes, but places domestic rice farmers at a severe disadvantage. In the end, local production suffers further as the low price for their product discourages farmers to produce better.
The issue of non-transparent government decisions in the im-porting process and in the appointment of rice importers have already been widely discussed (see Arifin, 1998). During the Soeharto regime, big conglomerates such as the Salim Group and former President Soeharto’s cronies were the dominant rice im-porters who benefited awesomely from the import transactions in terms of economic rent and profit. As much as US$ 10-15 were obtained per ton of rice import. This is not to mention earnings made possible by the difference or spread between the world market price and the contract price set by the government. The benefits from such windfalls became even more magnified when such companies and interests came to control the distribution sys-tem.
com-panies which used to have more economic and political access to the policy-making process, the new policies were thought to cre-ate more rivalries within the rice distribution system. As of this writing, no firm conclusion could be drawn regarding the achieve-ment of the cooperatives and SMEs in developing a better or al-ternative rice distribution system in Indonesia.
3.4 Regional Disparities in Rice Security
The issues of regional disparities in rice security emerge because of pessimism regarding the effectiveness of the targeted rice sub-sidy to low-income people across the country. In a larger context, Bulog has the capacity to move large quantities of rice within the country relatively quickly. The threat of rice shortage arising from lack of supplies seems unlikely to happen. However, rice insecu-rity at the regional level could be caused by a lack of purchasing power on the part of a particular social group.
A field survey conducted by a special team of the World Bank shows an interesting relationship between the economic crisis and initial level of poverty (Soenarto, et al., 1999). Some areas that were not initially poor have been hit so hard by the crisis that people in these areas are now relatively poorer than those in other areas identified as poor. Areas of West Java are a very good ex-ample of this phenomenon. The same holds true for the greater Jakarta area (known as Jabotabek – Jakarta, Bogor Tangerang, and Bekasi), which has become poor. However, according to the survey, this area has not yet reached the level of absolute poverty incidence reported in traditionally poor areas.
In this context, the affordability of food for the poorest people has become a special focus of the newly established policy
instru-Table 3.6
Examples of Different Impacts of the Economic Crisis
Different Impacts Relatively Well-off
ment known as special market operation or OPK. Under this instrument, rice is sold at prices around Rp 1000 per kilogram, which is equivalent to 50 percent of the market price, and signifi-cantly below the international price. The quantity of rice a house-hold could purchase at the subsidized price was initially 10 kilo-gram per month. Subsequently, this has been increased to 20 kilogram per month.
A special report from the Social Monitoring and Early Response Unit (SMERU, 1999) suggests that the OPK is reaching needy people, even though not all needy people are receiving the OPK. The SMERU team visited 21 urban areas and 19 rural areas in five provinces: DKI Jakarta, Central Java, Central Sulawesi, Maluku and South Sumatra. The team found out that in some areas, the delivery and payment mechanisms on the OPK are operating well, but in many areas local government and their agents need to be given more adequate operational budgets and guidelines that al-low for innovation. In addition, payments by local governments to the local logistic agency (DOLOG) for rice allocations are lag-ging significantly in many regions.
Food Security and Markets in Indonesia
his chapter examines the roles that the private sector plays in rice trading in Indonesia, focusing primarily on the country's rice trading map and patterns of transaction found therein. As mentioned previously, the private sector has been in-volved in rice trading in Indonesia far longer and more domi-nantly than the state. Government intervention in rice trading in Indonesia started only in the late 1960s when Indonesia faced se-rious threats from food security and an economic recession.
Players in Indonesia's rice trading industry generally include the following: collector traders, rice milling units (RMU), whole-salers, bazaar traders, and retailers. The scale and extent of par-ticipation of each of these economic actors vary from the house-hold and small-scale trader level to the level of conglomerates which control rice-milling units, wholesalers, bazaar traders and retailers. Consequently, the level of business, market share, mar-keting power and access to market information, sources of capital and government policies, also varies significantly. Most of these traders have been involved, both directly and indirectly, with gov-ernment policies on price stabilization and in the rice distribution and marketing system. These actors have dealt, also both directly and indirectly, with a large number of producers or rice farmers under special patterns of transaction. But only a few of them, the rice milling units and wholesaler- traders most especially, have direct access to the retail rice market and therefore, to the largest number of rice consumers.
As a general rule, economic actors with limited market and in-formation access are not able to accumulate large amounts of capi-tal. They often remain as small-scale as when they started. The
4.
4.
4.
4.
4.
Roles of the Private
Roles of the Private
Roles of the Private
Roles of the Private
Roles of the Private
Sector in Rice Trading
Sector in Rice Trading
Sector in Rice Trading
Sector in Rice Trading
Sector in Rice Trading
reverse is true in the rice trading industry of Indonesia. Most of the existing large-scale rice milling units and wholesalers started the business at the household level in the 1970s and 1980s. Few of them were involved with the government policies on rice procure-ment and import activities through special arrangeprocure-ments with BULOG. These businesses developed very rapidly in the 1990s in accordance with the tremendous increase in rice consumption in the country that occurred during the period. They grew on ac-count of economic profits obtained from the rice trade, which they used to generate new investments aimed at achieving economies of scale. Such big businesses are the ones that have survived and have even grown significantly despite and even because of the cur-rent economic crisis.
The remaining sections of this chapter tackle the market-ing system and the marketmarket-ing power inherent in the rice business. Economic analysis of marketing margins and the marketing effi-ciency of the system are used as benchmark bases for business decisions on new investments. The chapter also discusses the dif-ferences in market access and sources of capital, capital accumula-tion and incentive systems arising from business activities.
4.1. The Rice Trading Map:
Charting The Geographic Flow of Rice in Indonesia
The marketing process connecting rice production to rice con-sumption in Indonesia has followed an evolutionary track. The process before was centralized. This means that the marketing of non-BULOG rice was centralized to the wholesalers or Bazaar trad-ers. The main function of such a system was to stabilize the price of rice by selling through several marketing institutions represent-ing either producers or consumers. This system follows three main stages – collecting, standardization and grading – all of which de-termine the quality of rice being traded. The centralized system has evolved into a more decentralized pattern of trading involv-ing other marketinvolv-ing institutions such as the village, sub-district or district collector and rice milling unit (or the miller).
market place of Cipinang, also known as Jakarta Food Station (Pasar Induk Cipinang) in Jakarta, come from the northern part of Java (Karawang, Bekasi, Cirebon dan Indramayu).
Generally, the marketing of rice in the District of Karawang in West Java involve such actors as farmer-producers and collectors (at the village, sub-district and district levels); millers; bazaar trad-ers and retailtrad-ers. Another marketing institution is the KUD at the district (sub-DOLOG) and provincial (DOLOG) levels. Some of the branded rice which are traded include IR-64, Cilamaya and Muncul. In this area, average retail price of rice is determined by Presidential Decree (Inpres) No. 32/1998. For example, the price of humid and non-husked paddy (GKP) is about Rp 1.020/kg; dry and non-husked paddy (GKG), Rp 1.200/kg; paddy for Muncul variety, Rp 1.200/kg; Cisadane, Rp 2.300/kg ; and , IR-64, Rp 23.350/kg.
In East Java province, rice that flows to Surabaya, the capital city, do so through two entry points, namely, Pabean market place (North Gate) and Bendul Merisi market place (South Gate). Pabean absorbs rice taken from East Java's northwestern coastal region and partly from Central Java (Surakarta, Pati, Bojonegoro, Cepu, Tuban, Lamongan and Gresik). Daily volume loaded and unloaded in Pabean is estimated at between 7 to 10 Fuso-type trucks or an equivalent of 70-100 tons of rice (at 10 tons per truck).
Meanwhile, the South gate market absorbs rice from the fol-lowing regions: Sidoarjo, Malang, Pasuruan, Banyuwangi, Jombang, Mojokerto, Madiun, Ngawi (East Java) and Solo, Sragen (Central Java). Daily volume loaded and unloaded is estimated at 15 to 20 Fuso-type trucks or approximately between 150 to 200 tons of rice per day. These figures do not yet include rice coming in from other sources outside Surabaya.
Much of the rice traded in Lampung is of the IR-64 and IR-50 varieties, commercially branded in some places as Talang Padang and Pandan Wangi. Daily volume loaded and unloaded is about 5 to 7 Fuso trucks or approximately between 50 to 70 tons. This excluded rice brought in also by commercial traded for use in government market operations.
4.2. Description of Channels and Actors Involved
Generally, rice trading patterns in Indonesia do not differ signifi-cantly by region. Rice trading could be seen as one step in the overall process of rice marketing, that is, the process for distribut-ing the rice from producers to final consumers. However, by mar-keting channel available in a particular region, rice trading fol-lows a different pattern. Marketing institutions involved in rice trading are collectors (village, subdistrict and district), wholesal-ers, Bazaar tradwholesal-ers, retailers and final consumers or end-users. Other institutions involved are rural cooperatives (KUD), millers, DOLOG/sub DOLOG, BULOG and importers.
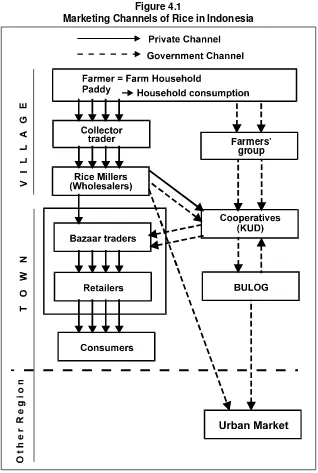
Following are the institutions involved in rice trading in Indonesia categorized by type of channel and pattern of trading they engage in (please see the corresponding Figure 4.1):
Private Channel
First Pattern: Farmers - Collector Traders - Wholesalers (also Rice Millers) - Bazaar Traders - Retailers - Consumers.
Second Pattern: Farmers - Collector Traders - Rice Millers - Ur-ban Markets
Third Pattern: Farmers Collector Traders Rice Millers KUD -Bazaar Traders - Retailers - Consumers.
Fourth Pattern: Farmers - Collector Traders - Rice Millers - KUD - Bulog - Urban Markets
Government Channel
Sixth Pattern: Farmers Farmers' Group KUD (also Millers) -BULOG (also Rice Millers) - Bazaar Traders - Retailers - Con-sumers.
Figure 4.1
Marketing Channels of Rice in Indonesia
The first and second patterns involve purely private channels while the fifth pattern utilizes a purely government channel. The third, fourth and the sixth patterns involve a marketing channel characterized by an interaction between the private and govern-ment channels.
• Farmer (Producer)
The farmer is the one who produces the rice or engages in rice farming as agricultural investment. The farmer manages the pro-duction factors and decides on which mix of land resources (rent, own or sharecrop), labor (family and non-family), capital (fixed and current), and managerial skill would yield the best crop. Farm management should be market-oriented, although not all rice farm-ers in Indonesia are able to engage in such an approach to doing farm business. Some farmers operate only at a subsistence level, where rice products are mostly used for the household consump-tion. Others sell the products to a broker-trader (locally known as tengkulak) or collector-trader before or after the harvest.
The farmer, as a main producer of food crops, especially paddy, is the first institution in the rice marketing system. Most farmers now follow a rational decision-making process in planting the rice that considers not only economic factors like profit and loss, but also non-economic factors, i.e., rice as a socially important com-modity and a staple food for most Indonesian people. The farmer decides to plant paddy because of an incentive system (manifested by the existing price policy) or social aspect (household food secu-rity for owning extra amount of rice).
(East Java), farmers sell to the local trader or penguyang, using the weighted system (quintals) instead of the bulk system. Under such a system, farmers shoulder the labor cost of the harvest. • Collector Trader:
The collector trader is one who buys paddy from the farmers in the form of wet and husked grain (GKP) or dry and non-husked grain (GKG). The collector trader could also be full or part-owner of a rice milling unit (RMU). In East Java, the collec-tor trader is known as penguyang, who, aside from being paddy collector, also sells rice.
Paddy collectors may be classified according to their area of business operation. There are three types: the village, sub-district and district collector. The village collector obtains the paddy from the farmers, processes it to rice before reselling it to the sub-dis-trict or dissub-dis-trict collector. The average volume of paddy traded is relatively small, between 5-10 tons weekly. In some regions, col-lector traders supply the DOLOG. They do this by contracting paddy procurement through rural cooperatives or Koperasi Unit Desa (KUD). Collector traders also sell the paddy through the miller or RMU at the sub-district (kecamatan) and district levels. Trad-ers at the district level generally have the option of selling the rice outside the region, especially if they do not own a milling unit. • Rice Milling Unit (RMU)
RMUs mill or hull paddy brought in by either the farmers or collector traders. In some cases, RMU owners double as collector traders. In such cases, the RMU owners have two sources of in-come: milling and trading.
Miller-traders buy rice grain directly from the farmers, espe-cially during the harvest season. Increasing quantity and quality of available infrastructure has made the role of the smaller rice-milling units in rural areas all the more important. These are the marketing actors who are closest to the production location.
In West Java, especially in the district of Karawang, the num-ber of existing RMUs are as follows: two in the city of Karawang with a capacity of 1,960 tons; 10 in Kecamatan Rengasdengklok with a capacity of 9,800 tons; one unit in Kecamatan Tirtamulya with a capacity of 980 tons; four units in Kecamatan Jatisari with a capacity of 3,980 tons; and, two more units in Kecamatan Cilamaya with a capacity of 1,960 tons. In KUD Sri Mulia, sub-district of Rengasdengklok, there are 2 units of a Caterpillar brand miller, single, with a capacity of 15-20 tons per day and 1 unit of machine with capacity 10-15 tons. The size of a warehouse, floor and kiosk building (GLK) is 5 x 20 meters and 15 x 40 meters, respectively, for two and one unit.
Source : Calculated from Field Data, 1999
Notes * Mill services is taken from net result of rice. For each quintal of rice, the mill services is about four ( 4 ) kg of rice. Assume that price of rice is Rp 2500- per kg, so the milling services for 1 quintal of rice is : 2,55 x 4 kg = Rp 10.000,- (Conversion for 5 ton gabah x 52% = 2,6 ton of rice).
Table 4.1
Income Analysis of Rice Milling Unit
Description Price (Rp/unit) Value (Rp)
Return Component
1. Mill Services for 26 Kw of Rice * 10.000,-
260.000,-2. Sekam, 50 Kw gabah = 50 bag 350,-
17.000,-
277.500,-Expense Component
1. Labor wages, 5 man day
2. Cost of fuel (Solar), 30 liter 550,-
3. Maintenance Cost
4. Depreciation of machine per day 30.000.000/360
Total Expense
182.667,-The rice-milling unit usually determines the wages of mill labor-ers as follows:
1. By fixing wages at Rp 18 /kg of non-husked wet paddy (GKP), where half of the total cost of milling (comprised of gasoline (so-lar), roller, operator and mechanics) is charged by the owner of RMUs while the other half is charged by the owner of paddy (Maro System). Milled rice comes in the following forms: coarse flour (sekam), fine flour (katul), and fine-broken rice (menir). The con-version for each 100 kg of dry and non-husked paddy (GKP) to rice is about 52-65 kg rice, assuming 52%-65% for each kg GKP. Dedak and menir goes to the owner of rice milling unit or the miller.
2. By profit-loss sharing or wages in terms of rice (in kind) ob-tained from the paddy being milled. For each quintal of rice, the services of a miller costs the equivalent of 4 kg of rice. Assuming the price of rice is at Rp 2500 per kg, the cost of milling paddy to produce 1 quintal of rice is: 2.55 x 4 kg = Rp 10.000 (conversion for 5 ton paddy x 52% is equal to 2.6 ton rice).
• Wholesalers and Bazaar traders
Wholesalers and Bazaar traders are those that engage in big volume rice trading. To get their supply, Bazaar traders usually obtain their rice from medium-sized miller traders. They gener-ally trade in the central district of a provincial area.
Some big traders like PT Alam Makmur at the JFS in Jakarta also function as rice importers. Their activities are not confined to a certain area. They also engage in trade among the regions. Johar's traders generally get rice from millers and collectors in Karawang. Some traders function as brokers, receiving commissions from collector traders for redistributing their product to other traders such as those based in Bekasi, Bogor and Tangerang (West Java). Bazaar traders move about 5 to 10 tons of rice per day, enjoy-ing a profit margin of Rp 50-100/kg. If a trader bought rice at Rp 2400 to Rp 2450 per kg and sells it at Rp 2450 to Rp 2500/kg (medium quality), he realizes a profit of 2.08% (50/2400*100). Even if the profit margin is relatively small, the absolute profit is big enough. This is because the turnover from trading is relatively big. For instance, if a trader sells 5 tons of rice, the profit is ap-proximately Rp 250.000. Deducting labor wages for 3 persons, valued at about Rp 22.500 (=3*7500), the net profit for Bazaar traders is Rp 250.000 (Rp 22.500, Rp 227.500,- per day).
• Retailers
Retailers refer to rice traders who buy big and sell small. Any-one can be a retailer; there is no entry barrier to the industry. This explains why there are more rice retailers than there are wholesalers, collectors and Bazaar traders in Indonesia's rice trad-ing industry.
Rice retailing in Indonesia follows two standards: the kiloan (weighted standard) and the literan (volume standard). Rice re-tailers do not sell any particular brand of rice or for that matter, rice only. The trader also sells other brands and other products, mainly staple food (corn, soybean, peanut). Retailers get their sup-ply from the Bazaar traders, collector and miller traders (known as penguyang in East Java). The rice volume traded by retailers reaches from 50 kg to 500 kg per day.
Retailer profit levels vary according to the type of transaction,