– DOI 10.1007/s00374-006-0102-9
O R I G I N A L PA P E R
S. Kundu . Ranjan Bhattacharyya . Ved Prakash . H. S. Gupta . H. Pathak . J. K. Ladha
Long-term yield trend and sustainability of rainfed soybean
–
wheat
system through farmyard manure application in a sandy loam
soil of the Indian Himalayas
Received: 24 March 2005 / Revised: 24 February 2006 / Accepted: 15 March 2006 / Published online: 15 April 2006 #Springer-Verlag 2006
Abstract A long-term (30 years) soybean–wheat experi-ment was conducted at Hawalbagh, Almora, India to study the effects of organic and inorganic sources of nutrients on grain yield trends of rainfed soybean (Glycine max)–wheat (Triticum aestivum) system and nutrient status (soil C, N, P and K) in a sandy loam soil (Typic Haplaquept). The un-fertilized plot supported 0.56 Mg ha−1of soybean yield and 0.71 Mg ha−1 of wheat yield (average yield of 30 years). Soybean responded to inorganic NPK application and the yield increased significantly to 0.87 Mg ha−1with NPK. Maximum yields of soybean (2.84 Mg ha−1) and residual wheat (1.88 Mg ha−1) were obtained in the plots under NPK + farmyard manure (FYM) treatment, which were significantly higher than yields observed under other treat-ments. Soybean yields in the plots under the unfertilized and the inorganic fertilizer treatments decreased with time, whereas yields increased significantly in the plots under N + FYM and NPK + FYM treatments. At the end of 30 years, total soil organic C (SOC) and total N concen-trations increased in all the treatments. Soils under NPK + FYM-treated plots contained higher SOC and total N by 89 and 58% in the 0–45 cm soil layer, respectively, over that of the initial status. Hence, the decline in yields might be due to decline in available P and K status of soil. Combined use of NPK and FYM increased SOC, oxi-dizable SOC, total N, total P, Olsen P, and ammonium acetate exchangeable K by 37.8, 42.0, 20.8, 30.2, 25.0, and 52.7%, respectively, at 0–45 cm soil layer compared to application of NPK through inorganic fertilizers. However, the soil profiles under all the treatments had a net loss of
nonexchangeable K, ranging from 172 kg ha−1 under treatment NK to a maximum of 960 kg ha−1under NPK + FYM after 30 years of cropping. Depletion of available P and K might have contributed to the soybean yield decline in treatments where manure was not applied. The study also showed that although the combined NPK and FYM application sustained long-term productivity of the soy-bean–wheat system, increased K input is required to main-tain soil nonexchangeable K level.
Keywords Long-term experiment . Soybean–wheat system . Rainfed cropping . Farmyard manure . Yield sustainability . Soil fertility
Introduction
In the typical hilly region of Uttaranchal, India, about 90% of the area is rainfed with very low productivity. Soybean– wheat system is one of the profitable cropping systems in this region (Kundu et al. 1990). The production of this cropping system, however, remained stagnant even after the introduction of high-yielding cultivars. The depletion of soil nutrients and low, nonjudicious use of nutrients might be the possible causes of such plateau in yield (Ghosh et al. unpublished data). Application of nutrients through organic and inorganic sources, therefore, will be essential to improve and sustain crop yields and maintain soil fertility. But imbalanced application of nutrients leads to loss of productivity arising from the soil exhaustion of certain primary and secondary nutrients (Bhandari et al.
2002; Yadvinder-Singh et al.2004).
Maintenance of soil organic C (SOC) is considered essential for long-term sustainable agriculture because declining SOC levels in soil generally leads to decrease in productivity. Several long-term experiments (LTEs) con-ducted in South Asia showed yield trends and build ups of SOC with varying degree in all treatments, which received external application of farmyard manure (FYM), while in some locations, application of inorganic NPK showed marginal build up of SOC (Nambiar 1994; Ladha et al. S. Kundu . R. Bhattacharyya . V. Prakash . H. S. Gupta
Vivekananda Institute of Hill Agriculture (Indian Council of Agricultural Research), Uttaranchal,
Almora 263 601, India H. Pathak . J. K. Ladha (*)
International Rice Research Institute-India, CG Block, National Agriculture Science Centre Complex, DPS Marg, Pusa,
2003). However, most studies were restricted under irri-gated rice–wheat systems. Relatively limited information is available concerning yield and soil chemical properties under long-term rainfed condition of the Indian Himalayas in a soybean–wheat rotation. The objectives of the present LTE were to examine the impacts of the continuous use of inorganic fertilizers with and without FYM on yield trends, nutrient balances, and soil fertility of soybean–wheat rotation under rainfed conditions in the midhills of the Indian Himalayas.
Materials and methods
Experimental site
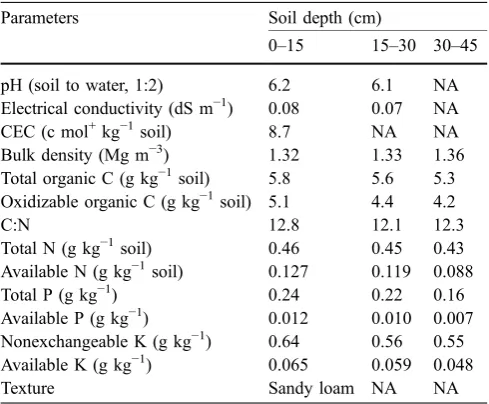
A long-term field experiment was initiated in June 1973 on Typic Haplaquept at the experimental farm of Vivekananda Institute of Hill Agriculture, located in the NW Himalayan region at Hawalbagh (29°36′ N and 79°40′ E, 1,250 m above mean sea level) in the state of Uttaranchal, India. Soil characteristics based on analysis of soil samples taken in 1973 are given in Table 1. The climate of the midhill region of Uttaranchal is subtemperate, characterized by moderate summer (May–June), a spell of chilling winter (December–January), and general dryness, except during the south-west monsoon season during June to September. The mean annual rainfall of the 30 years of crop growth period was 1,042 mm. Based on the records for the period 1973–2003, it was observed that the averagekharif(rainy) season (June to September) rainfall was 704 mm (68% of the average annual rainfall). During soybean growing period (June to September), the average monthly rainfall during June, July, August, and September were 146, 257, 187, and 119 mm, respectively. Meanwhile, during the wheat growing period (October to April), the average monthly rainfall during October, November, December, January, February, March, and April were 27, 6, 28, 53, 56, 48, and 42 mm, respectively. The mean monthly temper-ature ranges from a minimum of 0.4°C in January to a maximum of 31.5°C in May. The field was newly re-claimed for cultivation in 1973. Before, that the field was a native grassland, which was yearly cut or grazed.
Experimental design and treatments
The experiment included two crops per year, soybean (June–September) and wheat (October–April) with six treatments, viz, no fertilizer and manure (unfertilized control); 20 kg ha−1 of N + 35.2 kg ha−1 of P (NP); 20 kg ha−1of N + 33.2 kg ha−1of K (NK); 20 kg ha−1of N + 35.2 kg ha−1of P + 33.2 kg ha−1of K (NPK), 20 kg ha−1of N + FYM at 10 Mg ha−1(N + FYM); and NPK + FYM at 10 Mg ha−1(NPK + FYM). Treatment N + FYM is commonly used by the local farmers. The treatments were distributed in a randomized block design with six repli-cations over three uniformly leveled terraces. The net plot size was 5.4×2.0 m. Fertilizers used were urea for N, single
super phosphate for P, and KCl for K. Based on the chemical analysis every fifth year, FYM had 320 to 331 g kg−1of moisture and contained 231 to 236 g kg−1of C, 7.1 to 7.5 g kg−1of N, 2.1 to 2.4 g kg−1of P, and 5.3 to 5.8 g kg−1of K on oven-dry weight basis.
Crop management
The required doses of FYM and fertilizers were given to soybean crop every year. FYM was applied at 10 Mg ha−1 on a fresh weight basis before sowing of soybean crop. Soybean (80 kg ha−1 of seeds) was sown in the second week of June each year. Before seeding, the land was tilled two times with a spade up to a depth of 15 cm. Soybean cultivar“Bragg”was used from 1973–1998 and thereafter, it was replaced with VLS 2. The seeds were manually sown in rows 40 cm apart at a depth of 4 to 5 cm. After seeding, a light roller was dragged to cover the seeds. Full doses of N, P, and K were incorporated before sowing. Propanil (3, 3, 4-dichloro-propionanilide) was sprayed 2 days after sowing at the rate of 1.5 kg ha−1of active ingredients in all the plots to control weeds. Hand weeding was also done to manage the weeds and plant protection measures were applied as needed to control the diseases and pests. Crops were harvested manually 5 cm above the ground at physiological maturity in the first week of October using sickles and aboveground biomass was removed from the field. Grain yield was adjusted to 90 g kg−1of water for soybean.
After soybean harvest, wheat was sown in the second week of October each year. Wheat (cultivar Sonalika from 1973–1974 and 1988–1989, VL 421 from 1989–1990 and 1998–1999, and VL 616 from 1999–2000 and 2002–2003) was sown by hand (100 kg ha−1of seeds) in rows 22.5 cm apart to a depth of about 5 to 6 cm. Other field operations were as with the soybean crop. Wheat was harvested at Table 1 Soil properties of the initial (1973) soil profile
Parameters Soil depth (cm)
0–15 15–30 30–45
pH (soil to water, 1:2) 6.2 6.1 NA
Electrical conductivity (dS m−1) 0.08 0.07 NA
CEC (c mol+kg−1soil) 8.7 NA NA Available N (g kg−1soil) 0.127 0.119 0.088
Total P (g kg−1) 0.24 0.22 0.16
Available P (g kg−1) 0.012 0.010 0.007 Nonexchangeable K (g kg−1) 0.64 0.56 0.55 Available K (g kg−1) 0.065 0.059 0.048
Texture Sandy loam NA NA
5 cm above soil surface in the fourth week of April and straw was removed from the plots. Grain yield was adjusted to 120 g kg−1of water for wheat. Both the crops were cultivated under rainfed conditions.
Soil, plant sampling, and analysis
The soil samples were randomly taken form three locations in each plot within the 0–15, 15–30, and 30–45 cm soil depths using a 5-cm diameter soil auger. The samples were thoroughly mixed, air dried, crushed to pass through a 2-mm sieve, and stored in sealed plastic jars for analysis. Representative subsamples were drawn to determine total C and N using a CHN analyzer (FOSS Heraeus CHNO-Rapid) following a dry combustion method and to deter-mine oxidizable SOC by alkaline potassium permanganate method (Walkley and Black1934). Total P was determined as updated by Olsen and Sommers (1982), available P was determined spectrophotometrically on soil extracted with 0.5 N NaHCO3at pH 8.5 (Olsen et al.1954), nonexchange-able K as updated by Wood and DeTurk (1940), and available K was determined by 1 N NH4OAc (pH 7.0) using a flame photometer (Standford and English 1949). For total C and N, soil samples were ground to pass through a 0.2-mm sieve. At maturity, samples of soybean, wheat grain, and straw were collected from each plot; oven dried at 65°C to constant weight; and ground to pass through a 0.5-mm sieve for chemical analysis. The samples were digested in a mixture of HNO3 and HClO4 (3:1). Concentrations of P and K in the digested samples were estimated by the ammonium molybdate (Olsen and Sommers 1982) and by flame photometry methods, respectively.
Calculation and statistical analyses
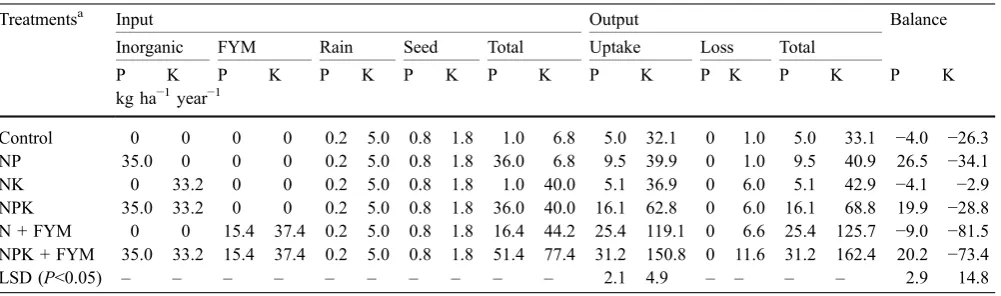
Apparent P and K budgets were estimated for the last 8 years (1995–2003) of the experiment for all the treat-ments considering different inputs and outputs measured during either the present study or other studies using the method given by Bhandari et al. (2002).
P balance¼XðFertilizer P;manure P;rain P;P in seedsÞ
Plant P P uptake in grain and strawð Þ
(1)
K balance¼XðFertilizer K;manure K;rain K;K in seedsÞ
Plant K K uptake in grain and strawð Þ
losses of fertilizer K
(2)
Among inputs, P and K contents in mineral fertilizer and FYM were measured in the present study. P and K
contributions of 0.2 and 5.0 kg ha−1year−1with rainwater were based on the data reported by Mishra (1980) for Pantnagar, India (29° N and 79°5′E and altitude of 244 m above mean sea level). The quantities of P and K added to the soil were 4.5 and 16.6 g kg−1year−1with soybean seeds (80 kg ha−1) and 3.6 and 4.0 g kg−1year−1with wheat seeds (120 kg ha−1), respectively (Mishra1980).
Plant uptake of P and K was estimated as per conven-tional method (yield×concentration). It was assumed that there would be no loss of P through leaching or otherwise from the soil system. Annual leaching loss of K was taken to be 150 g kg−1of K input (Smaling and Fersco1993).
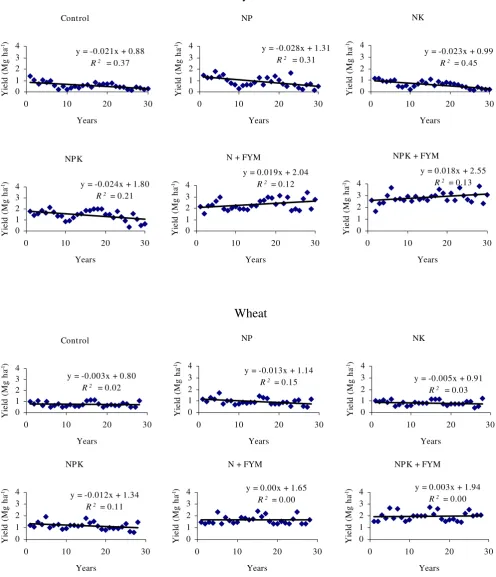
Simple linear regression analyses of grain yields across years were performed to determine yield trends (slopes). The P values on the slope indicate the level of significance of the observed yield changes. Low wheat yields in 1977 and 1984, associated with very low winter rainfall, were not considered for the trend analysis. Linear regression analysis was also performed to determine the relationship between initial soybean and wheat yields and yield decline (for first four treatments) across the 30-year period. Analysis of variance across years (Gomez and Gomez
1984) was done to determine the effects of treatment, year, and their interaction on yield using IRRISTAT version 92 (International Rice Research Institute, Philippines). Treat-ment means were compared at the 5% level of significance using least significant difference (LSD).
Results and discussion
Yields of soybean and wheat
crops observed under NPK treatment. The effect was more pronounced in NPK + FYM treatment than N + FYM treatment.
Again, due to the residual effect of FYM, the prod-uctivity of succeeding wheat crop was also enhanced by 42.6 and 71.2% in N + FYM and NPK + FYM treatments, respectively, over NPK treatment. This could be associated with other benefits of organics apart from N, P, and K supply, such as improvements in microbial activities; better supply of macro- and micronutrients such as S, Zn, Cu, and B, which are not supplied by inorganic fertilizers; and less losses of nutrients from the soil (Abrol et al.1997; Yadav et al. 2000). The higher wheat yields obtained on FYM-amended plots were possibly caused by the better supply pattern of N, P, and K and improved soil physical con-ditions (Yadvinder-Singh et al. 2004). Yadvinder-Singh et al. (1995) reported that FYM applied to rice showed residual effects in the next wheat crop. But under rainfed LTE, observed residual effects of FYM (applied to soybean crop) in the wheat crop have rarely been found previously. Grain yields of soybean and wheat fluctuated over the years. Changes in rainfall during the crop growth period might have caused yield fluctuations. Soybean yields of the unfertilized and the inorganic fertilizer treatments decreased with time during the study period (Table2). The rate of decline was the lowest in the NK treatment (Fig.1). However, yields increased over the years in the plots under N + FYM and NPK + FYM treatments at 0.019 and 0.018 Mg ha−1year−1, respectively. The decline in soybean yields in the unfertilized and inorganic fertilizer treatments was correlated with initial yields (Fig.2). As the SOC and total N concentrations increased in all the treatments (data discussed in the following sections), factors other than those, therefore, appeared to be limiting soybean yields. The decline in soybean yields was explained by decline in available K in the plots under unfertilized control, NP,
and NPK treatments and decline in Olsen P in the plots under unfertilized control and NK treatments as discussed in the following sections. In a rice–wheat LTE in the Indo-Gangetic plains of Nepal, Regmi et al. (2002) also ob-served a gradual decline in soil K resulting in a yield decline.
Wheat yields were stable as no significant declining trends were noted (Fig.1, Table2). Yadvinder-Singh et al. (2004) also observed stable wheat yields after using sub-optimal N rate to the crop.
Apparent nutrient balance
Based on the average annual P and K inputs (through fertilizer and FYM) and average annual P removed by the crop for the last 8 years, balance sheets were prepared (Table 3). It was observed that the soils under the un-fertilized control, NK, and N + FYM treatments suffered a net annual loss of 4.0, 4.1, and 9.0 kg ha−1 of P, respectively, whereas the soils under NP, NPK, and NPK + FYM had net annual gains of 26.5, 19.9, and 20.2 kg ha−1 of P, respectively. In plots under N + FYM and NPK + FYM, total P uptake by soybean and wheat crops increased by 57.7 and 93.8% over that under NPK-treated plots (16.1 kg ha−1 year−1 of P). Out of the average annual P removed by the last eight cropping cycles, 52.4, 70.0, and 60.9% of the P was removed by soybean crop in the plots under NPK, N + FYM, and NPK + FYM treatments, respectively. Gami et al. (2001) also observed a positive P balance in fertilizer P-amended plots after 20 years of rice– wheat cropping.
It can be inferred that mean annual removal of K by the crops surpassed the amount of annual K applied to the soil in all the treatments (Table3), thus, showing a net negative K balance ranging from 2.9 kg ha−1year−1in NK to 81.5 kg
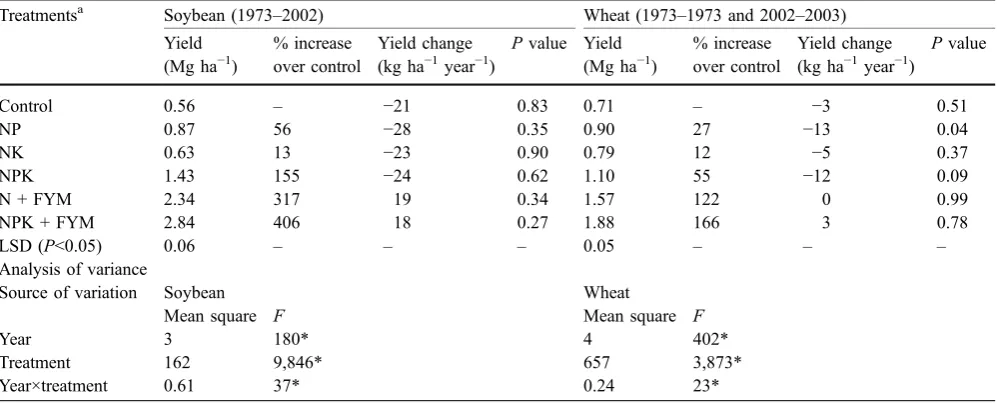
Table 2 Average yields and analysis of variance of soybean and wheat yields in a rainfed soybean–wheat LTE, Uttaranchal, India (1973–2003)
Treatmentsa Soybean (1973–2002) Wheat (1973–1973 and 2002–2003)
Yield (Mg ha−1)
% increase over control
Yield change (kg ha−1year−1)
Pvalue Yield (Mg ha−1)
% increase over control
Yield change (kg ha−1year−1)
Pvalue
Control 0.56 – −21 0.83 0.71 – −3 0.51
NP 0.87 56 −28 0.35 0.90 27 −13 0.04
NK 0.63 13 −23 0.90 0.79 12 −5 0.37
NPK 1.43 155 −24 0.62 1.10 55 −12 0.09
N + FYM 2.34 317 19 0.34 1.57 122 0 0.99
NPK + FYM 2.84 406 18 0.27 1.88 166 3 0.78
LSD (P<0.05) 0.06 – – – 0.05 – – –
Analysis of variance
Source of variation Soybean Wheat
Mean square F Mean square F
Year 3 180* 4 402*
Treatment 162 9,846* 657 3,873*
Year×treatment 0.61 37* 0.24 23*
*Significant atP<0.05 a
ha−1year−1in N + FYM-treated plots. Both NK- and NPK-treated plots received similar amounts of fertilizer K but the plots under NPK treatment showed considerably higher
negative balance due to significant yield increase of soy-bean to applied P. Even in NPK + FYM treatment where 77.4 kg ha−1of K was applied annually, the removal of K
Soybean
Fig. 1 Yield trends of soybean and wheat in the LTE, Almora, Uttaranchal, India, 1973 through 2003. See“Material and methods”for
exceeded the amount of K added with a negative K balance of about 73.4 kg ha−1 year−1. These results are in con-formity with those observed under other LTEs (Blake et al.
1999; Singh et al. 2002a,b). Negative K balances are attributed to labile K either leached from the plough layer or being fixed in less readily available form. Results of several other LTEs showed that considerable amounts of K have either leached out of or were fixed in the soil layers (Srinivasa-Rao et al.1999; Singh et al.2002a).
Soil fertility parameters
Organic carbon
Total and oxidizable SOC content decreased with depth irrespective of the treatments (Table4). A similar trend in SOC content with soil depth was reported by Stevenson (1982). SOC status increased in all the fertilized plots. At the end of 30 years, soils under NPK and NPK + FYM treatments contained higher SOC by 38 and 89% in the 0–45 cm soil layer, respectively, over that of the initial status. The annual rate of increase in SOC content over initial condition was 74, 328, 711, and 900 kg ha−1of C
under unfertilized, NPK, N + FYM, and NPK + FYM treatments. Regular application of FYM in combination with NPK or N alone resulted in considerable build up of oxidizable and total SOC throughout the profile depth (0–45 cm). Soils under the NPK + FYM-treated plots contained higher total SOC by 47.2% in 0–15 cm, 30.6% in 15–30 cm, and 35.0% in 30–45 cm of soil layer over those under the NPK-treated plots (Table4). Between the FYM-treated plots, plots under NPK + FYM treatment had 12.3% more total C in 0–45 cm of soil layer. The SOC stock in the 45-cm layer was 58.71 Mg ha−1for NPK + FYM treated soils compared with 43.76 Mg ha−1 for NPK and 35.62 Mg ha−1 for the unfertilized plots. Thus, overall gain in SOC in 0–45 cm of soil layer in the plots under NPK + FYM treatment compared to NPK-treated plots was 498 kg ha−1year−1of C.
The higher concentration of C in the fertilizer + FYM-treated plots was a result of increased yields of roots and plant residues and the application of organic C through FYM (Singh et al.1997). Considerably higher build up of total and oxidizable SOC in NPK + FYM-treated plots compared to the plots under N + FYM indicated the beneficial effect of balanced fertilization in improving SOC status of the soil. The benefits of sequestering C to sustain y = -0.016x + 0.04
R2 = 0.38
0 0.005 0.01 0.015 0.02 0.025 0.03
0 0.5 1 1.5 2
Initial soybean yield (Mg ha-1)
Y
ie
ld de
cl
in
e (
M
g ha
-1 yr -1)
y = -0.005x + 0.01 R2 = 0.06
0 0.005 0.01 0.015 0.02 0.025 0.03
0 0.5 1 1.5 2
Initial wheat yield (Mg ha-1)
Y
ie
ld de
cl
in
e (
M
g ha
-1 yr -1)
Fig. 2 Relationship between first year (1973) soybean yield and soybean yield decline over a 30-year period for control, NP, NK, and NPK
treatments. See“Material and methods”for treatment details
Table 3 Apparent P and K balances (1995–2003) in the rainfed soybean–wheat LTE, Uttaranchal, India
Treatmentsa Input Output Balance
Inorganic FYM Rain Seed Total Uptake Loss Total
P K P K P K P K P K P K P K P K P K
kg ha−1year−1
Control 0 0 0 0 0.2 5.0 0.8 1.8 1.0 6.8 5.0 32.1 0 1.0 5.0 33.1 −4.0 −26.3
NP 35.0 0 0 0 0.2 5.0 0.8 1.8 36.0 6.8 9.5 39.9 0 1.0 9.5 40.9 26.5 −34.1
NK 0 33.2 0 0 0.2 5.0 0.8 1.8 1.0 40.0 5.1 36.9 0 6.0 5.1 42.9 −4.1 −2.9
NPK 35.0 33.2 0 0 0.2 5.0 0.8 1.8 36.0 40.0 16.1 62.8 0 6.0 16.1 68.8 19.9 −28.8 N + FYM 0 0 15.4 37.4 0.2 5.0 0.8 1.8 16.4 44.2 25.4 119.1 0 6.6 25.4 125.7 −9.0 −81.5 NPK + FYM 35.0 33.2 15.4 37.4 0.2 5.0 0.8 1.8 51.4 77.4 31.2 150.8 0 11.6 31.2 162.4 20.2 −73.4
LSD (P<0.05) – – – – – – – – – – 2.1 4.9 – – – – 2.9 14.8
PPhosphorus andKpotassium a
crop productivity by applying organic amendments were well-documented (Aulakh et al.2001). SOC concentrations marginally improved from the start of the experiment in the unfertilized plots due to the addition of C to the roots and crop residues (Ved et al. 2002), higher humification rate constant, and lower decay rate. After 27 crop cycles, Kundu et al. (2002) observed that 26% of the added biomass C was annually humified in the soil to contribute toward the increase in SOC content, C loss from the native soil organic matter averaged 36 kg ha−1 year−1, and the decay rate was 0.11% of the initial SOC content.
Total nitrogen
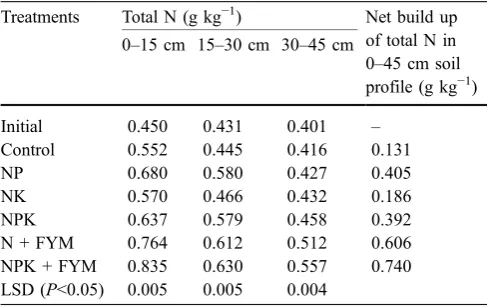
Depth-wise distribution of total N in soil showed that there was significant improvement in total N content over that of initial soil at all the soil depths (Table 5). At the end of 30 years, soils under NPK- and NPK + FYM-treated plots contained higher total N by 31 and 58% in 0–45 cm of soil layer, respectively, over that of the initial soil. The build-up of total N in the soil profile (0–45 cm) ranged from 262 kg ha−1in the unfertilized plots to 1,480 kg ha−1in the NPK + FYM-treated plots (Table5). The maximum N content was observed in the soil profile under NPK + FYM treatment (2 g kg−1). The C:N under chemically fertilized plots showed a marked reduction, while there was an increase in the C:N in the FYM-amended plots.
The positive balance of total soil N could be attributed to positive balance of total SOC and low rate of miner-alization under subtemperate climatic conditions. FYM is known to stimulate biological N2fixation in the soil, which may have been responsible for the increase in total soil N (Ladha and Kundu 1997) in the FYM-treated plots over that under NPK-treated ones, apart from FYM’s own N contribution. Again, lower losses of N in the FYM-amended plots due to slow release of N from FYM might also be responsible for the increase in total soil N (Bhandari et al.2002; Yadav et al.2000; Gami et al.2001).
Total and available phosphorus
The status of total P content showed that there was net depletion of total P in the treatments, which did not receive any P dressing as fertilizer (Table6). In contrast, marked build-ups of total P were observed in all the treatments, which received continuous annual dressing of 35.0 kg ha−1 of P as fertilizer. In NP- and NPK-treated plots, the build-ups of total P were 276 and 120 kg ha−1, respectively. The depletion of total P was maximum (198 kg ha−1) in the plots under NK treatment, whereas the gain was maximum in NPK + FYM-treated soils (506 kg ha−1). About 15.4 kg ha−1of P was annually supplied to the soil through FYM apart from fertilizer P in the plots under NPK + FYM and possibly because of that reason, the gain of total P in soil profile was the highest.
In the plots under unfertilized control and NK treat-ments, the depletion of Olsen P from its initial value was observed throughout the profile depth (0–45 cm) and the extent of depletion ranged from 24 kg ha−1 in the plots under NK to 26 kg ha−1 in unfertilized control (Table6). Both NP- and NPK-treated plots showed marginal gain in Olsen P in the soil profiles despite annual dressing of fer-tilizer P at 35.0 kg ha−1. Maximum build-up of Olsen P was observed under NPK + FYM-treated plots (32 kg ha−1). Table 4 Total and oxidizable SOC content in the soil profile after 30 years of cropping
Treatments Total SOC (g kg−1) Net build up of total SOC in 0–45 cm soil profile (g kg−1)
Oxidizable SOC (g kg−1soil) Net build up of oxidizable SOC in 0–45 cm soil profile (g kg−1) 0–15 cm 15–30 cm 30–45 cm 0–15 cm 15–30 cm 30–45 cm
Initial 5.77 5.56 5.29 – 5.08 4.35 4.19 –
Control 6.30 6.10 5.69 1.47 5.59 4.77 4.35 1.09
NP 7.46 7.13 6.20 4.17 6.85 5.72 4.41 3.36
NK 6.84 6.79 5.89 2.90 5.76 4.95 4.58 1.67
NPK 8.01 7.90 6.95 6.24 7.20 6.31 5.47 5.36
N + FYM 11.00 9.54 7.51 11.43 8.25 7.69 5.98 8.30
NPK + FYM 11.79 10.32 9.38 14.87 10.49 8.47 7.99 13.33
LSD (P<0.05) 0.11 0.09 0.08 – 0.08 0.09 0.08 –
Table 5 Total N content in the soil profile after 30 years of cropping
Treatments Total N (g kg−1) Net build up of total N in 0–45 cm soil profile (g kg−1) 0–15 cm 15–30 cm 30–45 cm
Initial 0.450 0.431 0.401 –
Control 0.552 0.445 0.416 0.131
NP 0.680 0.580 0.427 0.405
NK 0.570 0.466 0.432 0.186
NPK 0.637 0.579 0.458 0.392
N + FYM 0.764 0.612 0.512 0.606
NPK + FYM 0.835 0.630 0.557 0.740
Results showed that combined application of FYM and phosphatic fertilizer was very congenial for retaining and maintaining higher P in soil. The application of FYM in-creased Olsen P because of its P content and possibly by reducing precipitation as Ca phosphate (Gupta et al.1988). Although the Olsen P balance at 0–45 cm of soil depth in NPK + FYM-treated plots was highly positive, the same in N + FYM treatment was marginally positive. This might be due to the fact that the major P fraction added through FYM is in the organic pool, which mineralized slowly with time, apart from the fact that in the later treatment, no mineral P was added (Yadvinder-Singh et al.2004).
Nonexchangeable and available potassium
Nonexchangeable K content showed considerable deple-tion throughout the soil profile after 30 crop cycles under all the treatments (Table 7). The results thus showed that soil profiles were in net loss of nonexchangeable K, ranging from 172 kg ha−1under treatment NK to a maxi-mum of 960 kg ha−1under N + FYM. Considerable mining of K by crops from the deeper soil depth (30–45 cm) was observed in all the treatments, ranging from 108 kg ha−1in treatment NK to 316 kg ha−1in N + FYM treatment.
Available K content in the soil after 30 crop cycles showed differential changes depending on the yield re-sponses to added fertilizers (Table7). Significant depletion of available K in 0–45 cm of soil layer was observed in the
plots under unfertilized control (142 kg ha−1), NP (134 kg ha−1), and NPK (82 kg ha−1) treatments. Whereas, in the NK-, N + FYM-, and NPK + FYM-treated soils, there was build-up of available K in the soil profile.
The greater cumulative depletion (0–45 cm) in non-exchangeable K may be due to the increased release rate and increase in concentration of K, in solution and ex-changeable form, in the presence of organic matter (Singh et al. 2002b). Depletion of nonexchangeable K was not truly reflected by the soil-test values of available K. For example, the surface soil layer under treatment NPK + FYM showed a build-up of available K in spite of net depletion of nonexchangeable K. Furthermore, in the plots under N + FYM treatment, the available K content in the surface layer increased after 30 crop cycles despite maxi-mum depletion of nonexchangeable K.
Available K content in soil decreased significantly in soils that received continuous NPK fertilizers over 30 years, suggesting that current dose of K application was not sufficient to sustain soil K fertility under soybean–wheat system where crop residues, particularly wheat straw, were removed from the fields. Studies showed that in rice–wheat rotation, wheat straw incorporation helped in increasing the initial contents of available K in the soil (Prasad et al.
1999). The application of FYM resulted in increase in the available K due to higher release of nonexchangeable K from the soils (Bhattacharyya et al., unpublished data). Build-up of available K in subsurface soil layers in NK-treated soils showed a downward movement of applied K Table 6 Total and available P content in the soil profile after 30 years of cropping
Treatments Total P (g kg−1soil) Net build up (+)/depletion (−) of total P in soil profile (g kg−1) over initial soil
Available P (g kg−1soil) Net build up of av. P in soil profile (g kg−1) 0–15 cm 15–30 cm 30–45 cm 0–15 cm 15–30 cm 30–45 cm
Initial 0.243 0.220 0.159 – 0.012 0.010 0.007 –
Control 0.228 0.177 0.148 −0.069 0.006 0.005 0.005 −0.013
NP 0.307 0.243 0.210 0.138 0.015 0.013 0.010 0.009
NK 0.210 0.173 0.140 −0.099 0.006 0.006 0.005 −0.012
NPK 0.262 0.225 0.185 0.060 0.016 0.010 0.010 0.007
N + FYM 0.235 0.215 0.157 −0.015 0.015 0.010 0.008 0.004
NPK + FYM 0.347 0.295 0.233 0.253 0.018 0.015 0.012 0.016
LSD (P<0.05) 0.014 0.013 0.035 0.001 0.001 0.001
Table 7 Nonexchangeable K and available K content in the soil profile after 30 years of cropping
Treatments Nonexchangeable K (g kg−1soil) Net build up (+)/depletion (−) of total K in soil profile (g kg−1) over initial soil
Available K (g kg−1soil) Net build up of av. K in soil profile (g kg−1) 0–15 cm 15–30 cm 30–45 cm 0–15 cm 15–30 cm 30–45 cm
Initial 0.637 0.557 0.549 – 0.065 0.059 0.048 –
Control 0.507 0.461 0.438 −0.337 0.046 0.033 0.022 −0.071
NP 0.493 0.463 0.436 −0.351 0.042 0.038 0.025 −0.067
NK 0.596 0.566 0.495 −0.086 0.068 0.061 0.050 0.007
NPK 0.526 0.471 0.451 −0.295 0.051 0.044 0.036 −0.041
N + FYM 0.467 0.405 0.391 −0.480 0.074 0.055 0.049 0.006
NPK + FYM 0.493 0.424 0.421 −0.405 0.088 0.061 0.051 0.028
in the soil profile, indicating its susceptibility to leaching (Singh and Sekhon1997). In contrast, NPK + FYM treated plots showed a build-up of available K mostly in surface layer, possibly because of the specific role played by the FYM in restricting the downward mobility of the accu-mulated K. The reason could probably be attributed to the fact that continuous addition of FYM led to the attraction of K due to an increase in the proportion of K-specific internal to K-nonspecific external exchange sites and overall build-up in surface charge density of the soil (Poonia et al.1986; Mehta et al.1988).
Conclusions
Yields of soybean under the long-term (30 years) exper-iment at Almora, Uttaranchal, India, declined with the application of recommended doses of N, P, and K. The gradual depletion of one or more nutrients may have col-lectively contributed to the yield decline in unfertilized control and fertilizer treatments. It was found out that combined application of recommended doses of NPK and 10 Mg ha−1 of FYM to soybean and growing wheat on residual fertility is a better nutrient management option for sustained productivity of both the crops. The mean yield of soybean in the plots under NPK + FYM treatment was 98.7% higher than that observed under NPK treatment (1.43 Mg ha−1). The residual effect of NPK + FYM treat-ment was also considerable, resulting in 71.2% increase in wheat yield over that observed under NPK treatment (1.10 Mg ha−1). The results clearly reveal that current fertilizer recommendations are inadequate in the long run and application of FYM appeared to be important in this experiment. Addition of FYM with NPK fertilizers in-creased total soil C, N, and P by 37.8, 20.8, and 30.2%, respectively, over the treatment with NPK alone.
We understand that depletion of nonexchangeable and available K and Olsen P are most likely the main factors of yield decline in this study, along with the fluctuations of rainfall during the crop growth period. In NPK + FYM-treated plots, though available K supply could be main-tained from the nonexchangeable soil pool, the process will ultimately cause negative K balance and yield decline because the reduced K supply will be pronounced with time. So for sustained productivity of both the crops and maintaining soil K, attention must be given to revise K recommendations before it is too late to restore the de-pletion. If the similar depletion of available K in the farmer’s field occurs, the sustainability of this cropping system will be threatened. Replenishment of K can be difficult as farmers lack knowledge about the soil sup-plying capacity (Bhandari et al. 2002) and beneficial effects of K or face credit constraints when attempting to purchase K fertilizers. So a fertilizer management strategy is needed to ensure high and stable overall productivity and regular monitoring of rainfall data would help in predicting problems in achieving high yields in this rainfed soybean– wheat cropping.
References
Abrol IP, Bronson KF, Duxbury JM, Gupta RK (1997) Long-term soil fertility experiments in rice–wheat cropping systems. In: Abrol IP, Bronson KF, Duxbury JM, Gupta RK (eds) Long-term soil fertility experiments with rice–wheat rotations in South Asia. Rice–wheat consortium paper series no. 1, rice-wheat consortium for the Indo-Gangetic plains, New Delhi, India, pp 14–15
Aulakh MS, Khera TS, Doran JW, Bronson KF (2001) Managing crop residue with green manure, urea, and tillage in a rice– wheat rotation. Soil Sci Soc Am J 65:820–827
Bhandari AL, Ladha JK, Pathak H, Padre AT, Dawe D, Gupta RK (2002) Yield and soil nutrient changes in a long-term rice– wheat rotation in India. Soil Sci Soc Am J 66:162–170 Blake L, Mercik S, Koerschens M, Goulding KWT, Stempen S,
Weigel A, Poulton PR, Powlson DS (1999) Potassium content in soil, uptake in plants and the potassium balance in three European long-term field experiments. Plant Soil 216:1–14 Gami SK, Ladha JK, Pathak H, Shah MP, Pasuquin E, Pandey SP,
Hobbs PR, Joshy D, Mishra R (2001) Long-term changes in yield and soil fertility in a twenty-year rice-wheat experiment in Nepal. Biol Fertil Soils 34:73–78
Gomez AK, Gomez AA (1984) Statistical procedures for agricultur-al research. Wiley, New York, pp 180–209
Gupta AP, Antil RS, Narwal RP (1988) Effect of farmyard manure on organic carbon, available N, and P content of soil during different periods of wheat growth. J Indian Soc Soil Sci 262: 269–273
Kundu S, Bhatnagar VK, Ved Prakash, Joshi HC, Koranne KD (1990) Yield response of soybean–wheat rotation to K appli-cation in long-term field experiment. J Potassium Res 6:70–78 Kundu S, Ved Prakash, Ghosh BN, Singh RD, Srivastva AK (2002) Quantitative relationship between annual carbon inputs and soil organic carbon build-up in soybean (Glycine max)–wheat (Triticum aestivum) cropping sequence. 2nd International Agronomy Congress, Nov 26–30, New Delhi, India, pp 108–110 Ladha JK, Kundu DK (1997) Legumes for sustaining soil fertility in lowland rice. In: Rupela OP, Johansen C, Herridge DF (eds) Extending nitrogen fixation research to farmers’ fields: Proceedings of an international workshop on managing legume nitrogen fixation in the cropping system of Asia, ICRISAT Asia Centre, Patancheru, India, pp 76–102
Ladha JK, Pathak H, Padre AT, Dawe D, Gupta RK (2003) Productivity trends in intensive rice-wheat cropping systems in Asia. In: JK Ladha, JE Hill, JM Duxbury, RK Gupta, RJ Buresh (eds) Improving the productivity and sustainability of rice-wheat systems: issues and impacts. ASA special publication 65, ASA-CSSA-SSSA, Madison, USA, pp 45–76
Mehta SC, Sharma DR, Mittal SB (1988) Influence of long-term application of farmyard manure on K-Ca and K-Na exchange equilibrium in a tropical soil. J Potassium Res 4:168–173 Mishra B (1980) A system approach for fertilizer management
practices in rice-wheat cropping system. Fertil News 25:14–18 Nambiar KKM (1994) Soil fertility and crop productivity under long-term fertilizer use in India. Indian Council of Agricultural Research, New Delhi, India, pp 35–56
Olsen SR, Sommers LE (1982) Phosphorus. In: Page AL, Miller RH, Keeney DR (eds) Methods of soil analysis, part 2. Chemical and microbiological properties. American Society of Agronomy, Madison, WI, pp 403–430
Olsen SR, Cole CV, Watanabe FS, Dean LA (1954) Estimation of available phosphorus in soils by extraction with sodium bi-carbonate. US Department of Agriculture Circular No. 939 Poonia SR, Mehta, SC, Pal R (1986) Exchange equilibrium of
potassium in soils. 1. Effect of farmyard manure on K-Ca ex-change. Soil Sci 141:77–83
Regmi AP, Ladha JK, Pathak H, Pasuquin E, Bueno C, Dawe D, Hobbs PR, Joshy D, Maskey SL, Pandey SP (2002) Yield and soil fertility trends in a 20-year rice–rice wheat experiment in Nepal. Soil Sci Soc Am J 66:857–867
Singh B, Sekhon GS (1997) Leaching of potassium in illite soil profiles under different crop rotations. J Indian Soc Soil Sci 25:394–397
Singh BR, Borresen T, Uhlen G, Ekeberg E (1997) Long-term effects of crop rotation, cultivation practices, and fertilizers on carbon sequestration in soils in Norway. In: Lal R, Kimble JM, Follett RF, Stewart BA (eds) Management of carbon seques-tration in soil (Advances in soil science). CRC Press, Boca Raton, pp 195–208
Singh M, Singh VP, Reddy D (2002a) Potassium balance and release kinetics under continuous rice–wheat cropping system in Vertisol. Field Crops Res 77:81–91
Singh M, Tripathi AK, Reddy D (2002b) Potassium balance and release kinetics of non-exchangeable K in a Typic Haplustert as influenced by cattle manure application under a soybean–wheat system. Aust J Soil Res 40:541–543
Smaling EMA, Fersco LO (1993) A decision support model for monitoring nutrient balances under agricultural land use-NUTMON. Geoderma 60:235–256
Srinivasa-Rao Ch, Anand SM, Subba Rao A, Raja Gopal V (1999) Kinetics of non-exchangeable potassium release from a Tropaquept as influenced by long-term cropping, fertilization and manuring. Aust J Soil Res 37:317–328
Standford S, English L (1949) Use of flame photometer in rapid soil tests for K and Ca. Agron J 41:446–447
Stevenson FJ (1982) Humus chemistry. Wiley, USA, pp 1–25 Ved Prakash, Kundu S, Ghosh BN, Singh RD, Gupta HS (2002)
Annual carbon input to soil through rainfed soybean (Glycine max)–wheat (Triticum aestivum) cropping sequence in mid-hills of North-West Himalaya. Indian J Agric Sci 72:14–17 Walkley A, Black IA (1934) An examination of the Degtjareff
method for determining soil organic matter and a proposed modification of chromic acid titration method. Soil Sci 37: 29–38
Wood LK, DeTurk EE (1940) The absorption of potassium in soils in non-exchangeable forms. SA Proc Soil Sci Soc Amer 5: 152–161
Yadav RL, Dwivedi BS, Pandey PS (2000) Rice–wheat cropping system: assessment of sustainability under green manuring and chemical fertilizer inputs. Field Crops Res 65:15–30
Yadvinder-Singh, Bijay-Singh, Maaskina MS, Meelu OP (1995) Response of wetland rice to nitrogen from cattle manure and urea in a rice-wheat rotation. Trop Agric 72:91–96