CONSTRUCTION OF INFRASTRUCTURES FOR SUSTAINABLE FUTURES
By
Muhd Fadhil Nuruddin
Universiti Teknologi PETRONAS, Malaysia
1.0 PREAMBLE
Sustainable development is a pattern of resource use that aims to meet human needs while preserving the used by the sustainable development as “development that meets the needs of the present without compromising the ability of future generations to meet their own needs”.
This paper focuses on the impact of physical development vis-à-vis concrete construction in emitting CO2 to the
environment. The contribution of concrete industry to the carbon footprint is worsening over the years as concrete is the widely used material for construction and it constitutes about one cubic meter for every person on Earth. Globally the concrete production in the world is expected to rise from about 10 billion tons in 1995 to almost 16 billion tons in 2010. Concrete is basically a composite mixture containing cement paste and aggregates as its main components. Cement is manufactured by limestone, clay and other mineral, mixed in definite proportions to produce chemical reaction during a burning process at very high temperature. In 2005, cement production made a new record of 2.31 billion metric tons by the increase of 5.5%/yr, and it is expected
to rise by 4.1% globally to 3.5 billion metric ton in 2013.
The contribution of cement industry to the CO2 emissions is about 5% of the global CO2 emissions and one ton
of CO2 is released in the atmosphere from one ton production of Portland cement. Besides CO2 emission,
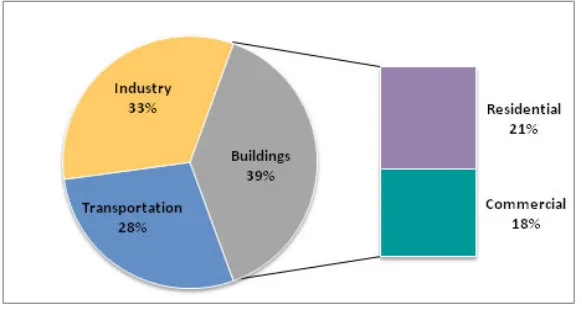
quarrying of raw materials (limestone and clay) for the production of cement is becoming the source of environmental degradation. To produce one ton of ordinary Portland cement (OPC), 1.6 tons of raw materials are needed. All in all the building industry contributes about 39% to the climate change as shown in Figure 1.
Figure 1: Contribution to climate change 2.0 CEMENT AND CONCRETE PRODUCTION
Figure 2: Carbon footprint globally 2.1 Environmental Issues Related to Cement Production
Production of cement is producing CO2 that gives rise to serious sustainability issue of the 21 st
century known as global warming. Global warming is due to green house gas emission, mainly CO2, leading to the continuous
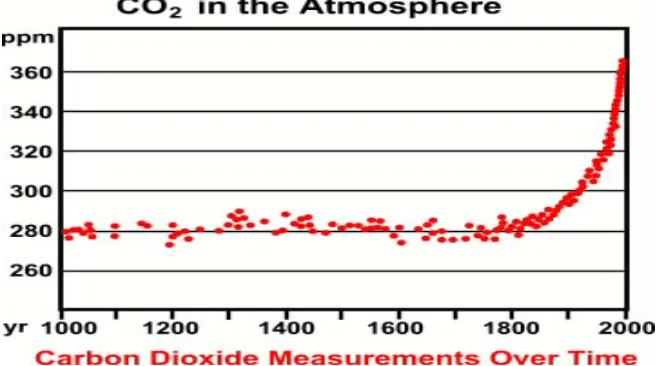
increase in the earth’s surface temperature since 1950’s. World Watch Institute report states that twenty-four years of the last twenty-seven years have been the warmest on record. Figure 3 show the CO2 measurement in
the atmosphere.
The contribution of global cement industry to the green house gas emission is around 1.35 billion tons annually that is 7% of total man made greenhouse gas emissions to the earth’s atmosphere which gives rise to global warming. Besides decarbonisation reaction by the burning of limestone at high temperatures the environmental impacts due to the production of cement also includes depletion of raw material.
3.0 WASTES MATERIALS
Many waste materials have been used in concrete and some of the examples are foundry sand, mill scale (steel production), used tyres, recycled plastic, glass, Palm oil fuel ash (POFA), blast furnace slag, metakaolin,silica fume, fly ash, and rice husk ash. Use of these waste materials in concrete to replace cement will reduce global warming and depletion of ozone layer.
Waste materials and by-products are undesirable materials for our environment that are the result of continuous expansion of industrialization or agricultural activities. These materials eventually disposed of in landfills that are becoming scarce and expensive at the same time, leading to a waste disposal crisis. Power plants produce millions of tonnes of fly ash per year, which is mostly wasted in landfills at a cost around $1 billion. Global production of fly ash is expected to rise by 800 million tons per year in 2010. Disposal cost can be saved by proper utilization of fly ash in concrete with actual cost of 11–22 cents/kg. Disposal of fly ash causes water and land pollution by contamination of soil which further contaminates ground water resources because fly ash is composed of smaller particle size and contains some toxic elements like arsenic, chromium, boron, vanadium and antimony.
On the other hand, disposal of rice husk is difficult because of its low nutritional value; long time is required for its decomposition to be used in manure. Almost 2.2 million tons of rice husk is produced per year from agriculture activity, contributing to 500-600 million metric tons of annual world husks production. All the produced husk is disposed of in landfills and cannot be used anywhere i.e. a great threat to our environment. 4.0 NEW GREENER PRODUCTS
Over the past decade the sustainability development agenda has been centre stage for many parties. The introduction of innovative and novel construction materials especially ones that utilize waste materials are very much commendable. Over the years a significant number of researches pertaining to these areas have been published. Amongst the promising materials are polymeric concrete and concrete with pozzolanas as cement replacement materials.
4.1 Geopolymer Concrete
Many researchers from the world are working on this serious issue of global warming and it was found out that one of the solutions is to introduce geopolymer cement through the development of inorganic alumina-silicate polymer. This cementing property can be obtained by the reaction of industrial by-products such as fly-ash or other mining material and agricultural waste products such as rice husk with the alkaline liquid. Geopolymer cements can reduce 80% to 90% of CO2 emission as compared to ordinary Portland cementwhich produces
65% of global warming among all green house gases emissions this will ultimately lead to the decrease in global warming and depletion of ozone layer.
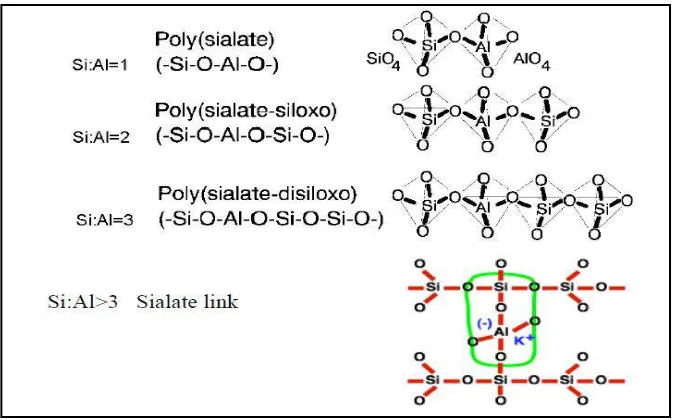
Figure 4: Chemical structures of polysialates
The chemical composition of geopolymer material is similar to natural zeolitic material (crystalline in nature) but its microstructure is amorphous to semi-crystalline. Class F fly ash reacts well with activated alkaline solution (8M NaOH) where the original fly ash morphology showed a series of spherical vitreous particles of different sizes (diameters ranging from 200 to 10 Am), some of them were hollow that contain smaller size particles. They further explained that at first stage of reaction some portions of large spherical particles were dissolved, exposing smaller particles to the alkaline attack. At this stage Si/Al ratio found to be 1.6 which showed low mechanical strength in the range of 20 MPa. At later stage of curing the Si/Al ratio became 1.9-2.1 which was fully compacted and hardened stage with high strength in the range of 80 MPa.
The microstructure of fly ash activated with 8M NaOH (7 days of age at 85°C) was also studied with the powerful technology of transmission electron microscopy (TEM) and found out that inside the bigger particles there were some small particles that were embedded into sodium aluminosilicate gel (zeolitic precursor) produced during the activation process.
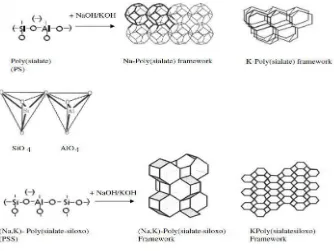
In geopolymer, polymerization is condensation polymerization in which water is released during chemical reaction and nature of reaction is endothermic. In geopolymerization, the polycondensation of alumino-silicate oxides (Si2O5, Al2O2) with alkali polysilicates (Sodium or Potassium silicate) takes place producing Si–O–Al
bonds.
Figure 5: Polymeric structure of Al–O–Si
Si and Al, randomly placed along the polymeric chain, are cross-linked to provide enough spaces for charge balancing sodium ions. Cross-linked polymers are among the strongest that inhibit chain sliding.
Due to the application of mechanical load, polymer chain disentangles. Disentanglement occurs because of chain sliding and if this chain sliding is easy then the polymer is weak and if this chain sliding is difficult then polymer is strong. Polymer chain possesses intermolecular forces between them that actually give the strength to the polymer and polymer molecules are large enough to inhibit chain sliding.
4.1.1 Polymeric Concrete
Till now not much work has been done on the concrete purely without cement as a binder. A study presented on fly ash-based geopolymer concrete concluded that low calcium fly ash based geopolymer has excellent compressive strength that is suitable for structural applications. It is also concluded that elastic properties, behavior and strength of geopolymer structural members are same as those observed in the case of Portland cement concrete. Besides that low-calcium fly ash-based geopolymer concrete also have excellent resistance to sulphate attack, good acid resistance, undergoes low creep and suffers very less drying shrinkage.
Studies on the suitability of different class F fly ash to be used in concrete in place of cement and the process involved in this synthesis concluded that strength was increased by increasing curing time by 24 hours. The optimum curing temperature was 80°C, molarity of alkaline solution that give high strength were 8M and 12M and dissolution of fly ash was an endothermic process.
It was also found that compressive strength of geopolymer concrete depends upon:
• Gel phase strength
• Ratio of gel phase/ undissolved Al-Si particles
• Amorphous nature of geopolymers
• Surface reaction between the gel phase and the undissolved Al-Si particles
Gel phase is highly reactive and formed by the co-polymerization of Al and Si from the source material dissolved by the activators. Co-polymerization is a process resembling polymerization, in which unlike molecules unite in alternate or random sequences in a chain. Therefore activators should be sufficiently provided to the mix for better polymerization.
4.1.2 Ingredients Of Polymeric Concrete
Ingredients of polymeric concrete are fine aggregate, coarse aggregate, low calcium fly ash, rice husk ash, or silica fume as a source of Si and Al and sodium hydroxide and sodium silicate solution as alkaline liquids. Low calcium (ASTM Class F) fly ash is preferred over high calcium (ASTM Class C) FA because high amounts of calcium may disturb the polymerization process and change the microstructure. CaO and Ca(OH)2 was used
with Class F fly ash in geopolymer concrete, cured at 20°C and 70°C and found that strength was increased in ambient curing as compared to elevated curing which showed that calcium interrupted the polymerization process in elevated curing which was slow in ambient curing. For coarse and fine aggregates actual aggregates grading curves adopted is similar of that used for OPC concrete.
The silicon and aluminum oxides in the source material reacts with the alkaline liquid to form polymeric paste that binds the loose coarse aggregate and fine aggregates to form the polymeric concrete. Polymeric binder is amorphous three dimensional material that sets quickly without needing high temperatures but their setting time can also be increased to achieve suitable workability.
The mechanical strength of alkali-activated binders depends on the structural conditions of the alumino-silicate materials and structural integrity was achieved by polycondensation of silica and alumina precursors and high alkali content which formed CaO-free aluminosilicate gel binder. Pozzolanic cements contain calcium while polymeric concrete does not depend upon calcium-silica-hydrates for strength and matrix formation. This difference gives a benefit in terms of early gain in the strength.
4.1.3 Alkaline Activators
Si and Al present in source material were being activated by strong alkalis that convert the glassy structure wholly or partially into compact composite, behaving like cement and generated a microporous material. Geopolymerization was significantly affected by alkali concentration and the commonly used activators were NaOH, Na2SO4, waterglass, Na2CO3, K2CO3, KOH, K2SO4 or a little amount of cement clinker. NaOH is
produced by oxidation with specific gravity of 2.13 at 25°C, melting point of 318°C and PH (1% aqueous sol) of 12.7. It is easily available in form of pellets, flakes, beads, grains, lumps or powder.
of the gel phase because the alkali metal hydroxide acts as a catalyst and leached out from the hardened alkali activated binder in almost the same amount as that was added during synthesis. Sodium silicate is the common name of the compound sodium metasilicate, Na2SiO3. Sodium silicate is manufactured by combining soda ash
(Na2CO3) and sand (SiO2) as shown by Equation below:
Na2CO3 + SiO2→ Na2SiO3 + CO2
For more than a century sodium silicate has been used for the production of commercial products such as special cements, coatings, molded articles and catalysts. Soluble silicate was added to fly ash based geopolymer concrete to promote precipitation of silicates and to make it water proof as well as acid resistant. It was also found out that with the addition of soluble silica, spaces in geopolymer matrix were filled resulting in denser microstructure with high degree of polymerization.
4.1.4 Mechanism Of Reaction
A new binder could be produced by performing the alkaline activation reaction with fly ash in which zeolite crystallization did not occur but only a thin layer of particles was initially dissolved to form an interstitial gel that hardens at low temperature. The gel polymerized into a geopolymer that was an inorganic polymeric material having a chemical composition same as zeolite but possessing an amorphous structure and favorable condition for geopolymerization reaction in its amorphous state.
The chemical reaction may comprise the following steps:
• Dissolution of Si and Al atoms from the source material through the action of hydroxide ions.
• Transportation or orientation or condensation of precursor ions into monomers.
• Setting or polycondensation/polymerisation of monomers into polymeric structures.
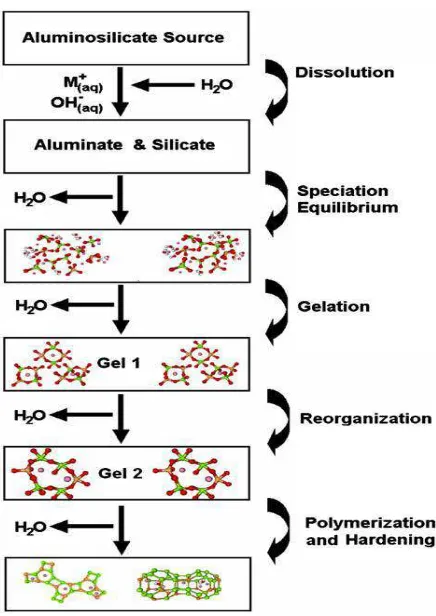
The process just after the start of the alkali activation of fly ash was same as that of hydration of Portland cement. A conceptual model is presented in Figure 6.
The key processes involved in the transformation of solid aluminosilicate material into a synthetic alkali aluminosilicate. The process started with the dissolution of solid aluminosilicate source by consuming alkaline solution and water forming aluminate and silicate species. In next stage division of Si and Al species occurred at equal rate with no any change in concentration of reactant and product with respect to time which was termed as speciation equilibrium.
At high PH dissolution of amorphous aluminosilicates was high which rapidly created a supersaturated aluminosilicate solution. This solution further transformed into a gel in which oligomers form large networks. Water was released as a result of this process which only played a role of a reaction medium and accumulated the pores in the gel. This type of gel was named as bi-phasic having aluminosilicate binder and water forming the two phases. After gelation system continued to reorganize as gel network was increasing resulting in a three dimensional aluminosilicate network known as geopolymers which started hardening by the process of polymerization.
4.1.5 Effect of Curing on Polymeric Concrete
Curing for polymeric concrete is different as compared to OPC concrete. For fly ash concrete, setting time was decreased by a factor of six when temperature was increased from 6 °C to 80°C therefore increased temperature gave rise to pozzolanic reaction. Curing temperature affected the setting time, pore structure and strength development of polymeric concrete. At ambient temperature; the reaction of fly ash was very slow and delayed the beginning of setting.
Development of the compressive strength was possibly affected by the high temperature curing for more than couple of hours. At high temperature, the 24 hours developed strength could be compared to one month of developed strength but it was observed that 60 MPa of strength after 5 hours at 85°C and concluded strength did not vary with the age of concrete unlike OPC concrete, which underwent hydration process and gained strength overtime. Beyond 48 hours of curing, strength development was not much significant but there was no effect on crystalline part of geopolymer which indicated that, the change responsible for the difference in the strength originated within the amorphous phase of the structure.
It was also observed that total pore volume and surface area was increased by the elevated curing. Degree of reaction was also increased by the increment in micropore volume and area. Increased curing temperature gave rise to dissolution of precursors; primary Al and Si which further accelerated polymerization process.
Curing temperature in the range of 30°C - 90°C had a more significant contribution as polymerization proceeds quickly at elevated temperatures but elevated temperature should not be too prolonged as it decreases the compressive strength by breaking the granular structure of geopolymer matrix resulted in dehydration and excessive shrinkage due to the contraction of the gel.
5.0 CEMENT REPLACEMENT MATERIALS
Environmental issues that resulted from Portland cement production have made researchers create advance methods to obtain materials that are sufficiently reactive to replace partially cement portion in concrete. These materials are generally are waste by-products and contain highly reactive silica to react with calcium hydroxide resulted from hydration process between cement and water.
5.1 Sidoarjo Mud As A Potential Cement Replacement Material
Since May 2006, more than 10,000 people in the flowing from a meters daily. In As of late September 2006 scientists are saying that the eruption may b impossible to stop. As of December 2007 the total volume of expelled mud was estimated at 1 billion covering an area of 2.5 and power transmission infrastructure has been damaged extensively in the area.
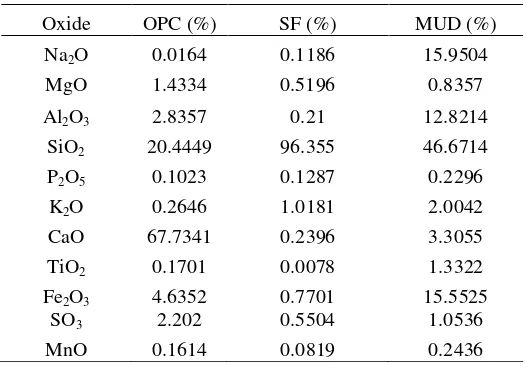
The Civil Engineering Department of Universiti Teknologi PETRONAS has conducted some basic tests on Sidoarjo mud because it was believed that the mud have cementitious properties with oxide contents such as CaO, SiO2, MgO etc which are similar to other pozzolan. Table 1 shows the oxide contents of Sidoarjo mud and
Table 1: Comparison of oxide contents
Oxide OPC (%) SF (%) MUD (%)
Na2O 0.0164 0.1186 15.9504
MgO 1.4334 0.5196 0.8357
Al2O3 2.8357 0.21 12.8214
SiO2 20.4449 96.355 46.6714
P2O5 0.1023 0.1287 0.2296
K2O 0.2646 1.0181 2.0042
CaO 67.7341 0.2396 3.3055
TiO2 0.1701 0.0078 1.3322
Fe2O3 4.6352 0.7701 15.5525
SO3 2.202 0.5504 1.0536
MnO 0.1614 0.0819 0.2436
Figure 7 shows the compressive strength of concrete with various percentages of Sidoarjo mud. In general a significant increase in result (by 30%) can be seen compared to control specimen. The optimum percentage of inclusion is 10% followed by 5%. But with 15% and 20% Sidoarjo mud replacements, the strengths obtained are less than the control samples.
Figure 7: Graph of compressive strength
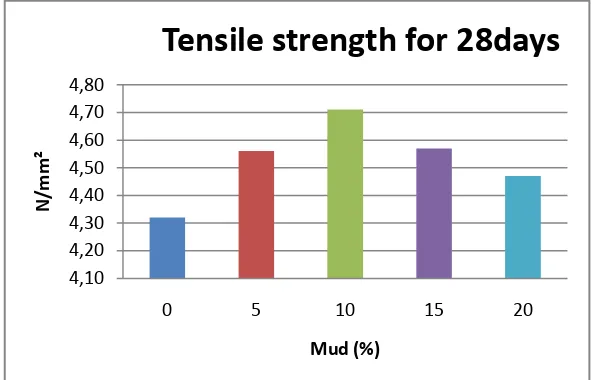
Meanwhile for tensile and Ultrasonic Pulse Velocity (UPV) tests there is no significant difference compared to the control specimens. At 10% Sidoarjo mud replacement, maximum differences of 9% and 2.6% are found for tensile and UPV results respectively (Refer Figures 8 and 9).
The mud also decreased the amount of void by 7%. With high amount of silica and alumina its gives better pozzolanic reaction therefore at 10% replacement the optimum porosity was obtained. Figure 10 shows the response of Sidoarjo mud mortar towards porosity.
0,00 10,00 20,00 30,00 40,00 50,00 60,00 70,00
0 5 10 15 20 25 30
N/m
m
²
Curing days
Compressive Strength
0%
5%
10%
15%
Figure 8: Tensile strength at various percentage replacements
Figure 9: Graph of UPV test
Figure 10: Graph of porosity level
4,10 4,20 4,30 4,40 4,50 4,60 4,70 4,80
0 5 10 15 20
N/m
m
²
Mud (%)
Tensile strength for 28days
2,00 2,20 2,40 2,60 2,80 3,00
0 5 10 15 20
V
el
o
ci
ty
(
k
m
/s
)
Mud %
Integrity
31 32 33 34 35
0 5 10 15 20
%
Mud %
5.2 Rice Husk Ash (RHA)
Rice husk, a by-product of paddy milling industries constitutes about 20% of dried paddy. It has a large dry volume due to its low bulk density (90 – 150 kg/m3). Current world rice production which already exceeds 600 million tons per year truly gives a problem to the disposal of its husk. For developing countries where rice production is abundant, the use of rice husk ash (RHA) to partially substitute cement is attractive because of its high reactivity. Current researches have shown that partial replacement of OPC with RHA will improve the concrete performance, either its strength or durability. Since the pozzolanic reactivity of RHA is influenced by the presence of high silica content and large internal surface area, the burning process should be controlled to remove the cellulose and lignin portion while preserving the original cellular structure of rice husk. The silica also should be held in a non-crystalline state and in highly micro porous structure. The amorphous silica occurs principally on the external face of the rice husk and to a lesser concentration on the inner surface.
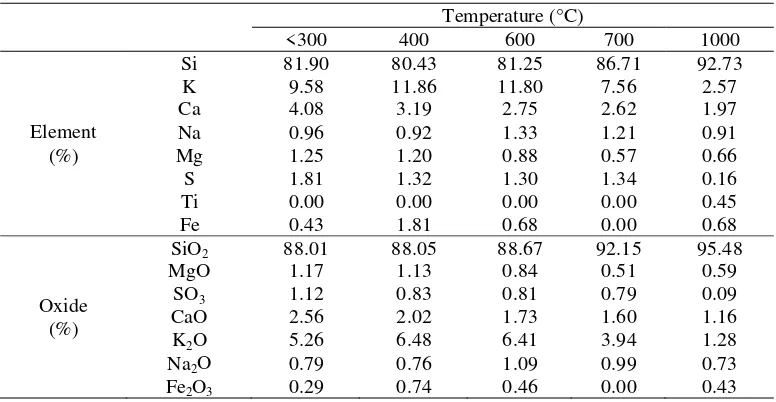
The quality of RHA actually depends on the method of ash incineration and the degree of grinding. It also depends upon the preservation of cellular structure and the extent of amorphous material within structure. Burning temperature, time, and environment, have different effects to the RHA produced. Table 2 shows the chemical composition of RHA under different burning temperature.
Table 2: Chemical Composition of RHA under Different Burning Temperatures Temperature (°C)
Burning the RHA with higher temperature will increase the SiO2 content. But it is not suggested to burn rice
husk above 800°C longer than one hour, because it tends to cause a sintering effect (coalescing of fine particles) and is indicated by a dramatic reduction in the specific surface. Combustion environment also plays an important role. It should be noted that a change in the rate of oxidation from moderately oxidizing conditions (CO2 environment) to highly oxidizing conditions (oxygen environment) is responsible for the steep drop in the
micro porosity and surface area.
It has been investigated that burning procedure significantly affect the properties of RHA in terms of the amount of silica oxide obtained. Silica oxide content obtained from open burning method will be lower than those obtained from controlled burning (muffle furnace). Properties of different RHA samples that were obtained from previous researches are shown in Table 3.
Table 3: Properties of RHA under Different Burning Procedure
Burning Method Colour LOI
(%)
SiO2 Total
(%) Annular Oven (Open Burning) Light Grey 10.8 81.95
Brick Oven (Open Burning) Light Grey 12.1 85
Pit Burning (Open Burning) Grey 15.3 82
5.2.1 Influence on Concrete
As a pozzolanic material, RHA has significant benefits when utilized in the concrete mixture. High SiO2
contents in RHA are able to react with Ca(OH)2 to form calcium silicate hydrate (C-S-H) gels and lead to better
performance of concrete properties. This phenomenon is able to promote RHA as a one of the potential cement replacement materials. Performance of concrete with RHA can be predicted by studying the hydration mechanism of its paste.
The hydration process of cement with water produces interior heat that if the temperature is too high, may develop crack in the cement paste. The addition of pozzolanic materials can affect both strength and permeability of concrete by strengthening the aggregate-cement paste through pozzolanic reaction. This phenomenon is shown in Figure 11. It is known that the pozzolanic reaction modifies the micropores structure.
Figure 11: Mechanism of Void Filling and ITZ Strengthening
The products formed due to the pozzolanic reactions occupy the empty spaces in concrete pore structures which thus become densified. The porosity of cement paste is then reduced, and subsequently the pores are refined. It has been shown that there is a significant reduction in the porosity of cement paste with RHA additions and refinement in the pore structure. Pozzolanic reaction is a slow process and proceeds with time.
5.2.2 Microwave Incinerated Rice Husk Ash (MIRHA)
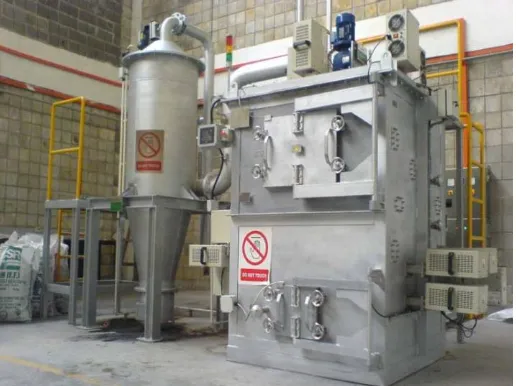
Proper burning method is important to obtain RHA with high reactive silica content. Modern incinerator is designed to avoid environmental problem as caused by open burning. Microwave incinerator as one of the modern incinerators to produce amorphous RHA with high pozzolanic reactivity as a result this can significantly enhance the concrete properties. Figure 12 shows the microwave incinerator used in UTP to produced microwave incinerated rice husk ash (MIRHA).
Microwaves are part of the electromagnetic spectrum and are located between 300 MHz and 300 GHz. Microwave heating is defined as the heating of a substance by electromagnetic energy operating in that frequency range. There is a fundamental difference in the nature of microwave heating when compared to conventional methods of heating material. Conventional heating relies on one or more of the heat transfer mechanisms of convection, conduction, or radiation to transfer thermal energy into the material. In all three cases, the energy is deposited at the surface of the material and the resulting temperature gradient established in the material causes the transfer of heat into the core of the object. Thus, the temperature gradient is always into the material with the highest temperatures being at the surface. In microwave heating, the microwave energy not only interacts with the surface material but also penetrates the surface and interacts with the core of the material as well. Energy is transferred from the electromagnetic field into thermal energy throughout the entire volume of the material that is penetrated by the radiation.
Microwave heating does not rely on conduction from the surface to bring heat into the core region. Since the heating rate is not limited by conduction through the surface layer, the material can be heated quicker. Another important aspect of microwave heating is that it results in a temperature gradient in the reverse direction compared to conventional heating. That is to say, the highest temperature occurs at the centre of the object and heat is conducted to the outer layer of the material. Table 4 shows the MIRHA composition obtained.
Table 4: MIRHA Chemical Compositions
Oxide Percentage
SiO2 88.90 %
MgO 0.72 %
SO3 0.32 %
CaO 0.63 %
K2O 3.65 %
Al2O3 0.16 %
Fe2O3 0.45 %
Compressive strength performance of MIRHA concrete depended relatively on the availability of water in the concrete mixture. With adequate amount of water to perform hydration process, MIRHA has significantly improved the compressive strength performance of 0.40 w/c MIRHA concrete 31.73% higher than control concrete for 56 days of age. The same performance identified for 0.45 w/c MIRHA concrete. It could achieve the compressive strength 27.73% higher than control concrete.
Air permeability of MIRHA concrete also performed within the same trend with the compressive strength results. 0.40 w/c MIRHA concrete has succeeded in performing better air impermeability outcome with the result 61.92% lower compared to control concrete. 0.45 w/c MIRHA concrete has also successfully improved
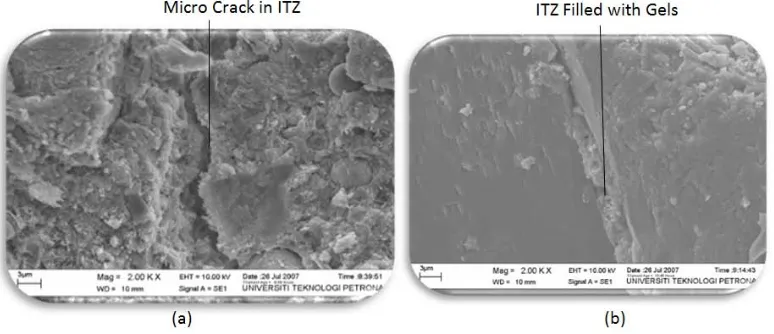
the air impermeability performance with the air permeability result 45.44% lower than the control concrete at the same w/c at micro level. Figure 13 shows the impact of MIRHA on the interfacial transition zone (ITZ) that made the aggregate and the paste seamless. On the other hand the OPC concrete depicts micro cracks at the ITZ.
PERKIRAAN UMUR LAYAN BANGUNAN BETON DI LINGKUNGAN AIR LAUT
(SERVICE LIFE PREDICTION OF REINFORCED CONCRETE STRUCTURES IN
MARINE ENVIRONMENT)
Oleh : M. Sigit Darmawan1
1
Dosen Program Diploma Teknik Sipil ITS, Surabaya Email: [email protected]
Abstrak
Penelitian tentang pengaruh korosi pada beton bertulang telah berkembang cukup pesat selama dua dasawarsa terakhir. Berdasarkan penelitian tersebut dan dikombinasikan dengan berbagai pengalaman praktis maka pada saat ini telah dimungkinkan memperkirakan umur layan bangunan di lingkungan air laut. Tulisan ini akan membahas perkembangan terakhir daripada model yang dipakai untuk memprediksi umur layan struktur beton di lingkungan air laut, serta berbagai keterbatasan yang ada dalam model tersebut. Peranan inspeksi berkala dalam rangka meningkatkan akurasi prediksi umur struktur juga akan dibahas pada tulisan ini. Dengan menggabungkan antara berbagai hasil penelitian mengenai umur layan bangunanan di lingkungan air laut dan data yang diperoleh melalui proses inspeksi maka umur layan bangunan beton telah dapat ditentukan secara lebih baik.
Kata kunci: korosi, beton bertulang, air laut, inspeksi
I. Pendahuluan
Struktur beton bertulang pada umumnya tidak dapat terlepas sama sekali dari pengaruh korosi, khususnya bila dibangun di daerah dengan pengaruh lingkungan yang cukup agresif, misalnya bangunan di tepi pantai. Korosi pada beton bertulang pada awalnya akan menimbulkan pengaruh pada aspek pelayananan struktur (serviceability), misalnya timbulnya bercak-bercak (stainning), retak (cracking) dan pengelupasan (spalling). Pada struktur beton yang telah mengalami korosi dan tidak dilakukan perawatan atau perbaikan (do-nothing), maka tidak menutup kemungkinan korosi dapat menimbulkan ”kegagalan struktur”. Kegagalan struktur (failure) dalam hal ini tidak selalu berupa runtuhnya struktur, tetapi struktur sudah tidak dapat lagi memenuhi fungsi yang telah direncanakan semula. Gambar 1 menunjukkan salah satu contoh kerusakan akibat pengaruh korosi pada struktur beton bertulang.
Timbulnya masalah korosi pada struktur beton bertulang di Indonesia, terutama sekali disebabkan rendahnya kualitas pekerjaan beton, yang kemudian menghasilkan beton yang tidak padat (poreus) serta ketebalan cover tidak memenuhi persyaratan teknis. Beton yang tidak padat serta mempunyai ketebalan cover yang kurang dari yang disyaratkan akan memudahkan berbagai zat yang bersifat korosif (misalnya chlorida dalam hal lingkungan air laut) untuk masuk kedalam beton hingga mencapai tulangan. Chlorida tersebut selanjutnya akan berakumulasi dengan waktu sampai mencapai tingkat konsentrasi tertentu (kritis) dan menghancurkan lapisan pelindung pasif dari tulangan. Apabila kemudian tersedia air dan oksigen yang cukup maka secara alami akan terjadi proses korosi.
Salah satu aspek yang penting dalam menentukan perlu tidaknya dilakukan perawatan pada suatu struktur beton yang berada di lingkungan air laut pada umur tertentu adalah tersedianya sebuah kerangka kerja (framework) untuk menentukan sisa umur layan struktur (remaining service life prediction). Pada saat ini telah terdapat sejumlah hasil penelitian mengenai pengaruh korosi pada struktur beton bertulang. Berdasarkan hasil penelitian tersebut serta dengan dilengkapi dengan berbagai pengalaman praktis, telah dimungkinkan melakukan prediksi umur layan bangunan beton di lingkungan air laut. Pada tulisan ini akan dibahas perkembangan terakhir (state of the art) tentang prediksi umur beton di lingkungan air laut, serta berbagai keterbatasan metoda yang telah ada.
II. Pemodelan Korosi
Penelitian tentang pengaruh korosi pada beton bertulang telah berkembang cukup pesat selama dua dasawarsa terakhir. Mengingat bahwa proses korosi merupakan proses alami yang berjalan dengan rentang waktu yang cukup lama (>5 tahun), maka penelitian tentang korosi sebagian besar dilakukan dengan cara mempercepat proses korosi (accelerated corrosion test), seperti yang dilakukan antara lain oleh Andrade dkk (1993), Alonso dkk (1998), Vu dkk (2005), Darmawan dan Stewart (2006), serta Wirawan dkk (2009). Gambar 2 menunjukkan contoh pelaksanaan tes korosi dipercepat di laboratorium. Korosi yang dipercepat ini memungkinkan para peneliti memperoleh hasil penelitian dalam waktu yang relatif cukup singkat. Namun demikian masih timbul pertanyaan apakah hasil penelitian dengan memakai cara tersebut dapat dipakai untuk memprediksi umur bangunan yang mengalamai korosi secara alami, dimana kecepatan korosinya jauh lebih kecil dibandingkan dengan kecepatan korosi dipercepat. Demikian pula spesimen yang dipakai pada tes korosi dipercepat pada umumnya jauh lebih kecil dibandingkan elemen struktur yang ditemui di lapangan.
Gambar 2. Tes Korosi Dipercepat
Proses korosi pada beton bertulang dapat dibagi menjadi dua tahapan, yaitu
• Inisiasi Korosi (Corrosion Initiation)
• Propagasi Korosi (Corrosion Propagation)
Inisiasi korosi didefinisikan sebagai proses masuknya chlorida kedalam beton hingga mencapai tulangan, kemudian chlorida tersebut berakumulasi dengan waktu sehingga mencapai kadar batas yang diperlukan untuk menghancurkan lapisan proteksi pasif pada tulangan. Sedangkan propagasi korosi didefinisikan sebagai proses pengurangan luasan tulangan akibat adanya korosi. Salah satu model korosi yang dipakai menggambarkan proses korosi pada beton bertulang disajikan pada Gambar 3, dengan anggapan bahwa tidak ada intervensi selama proses korosi berjalan, misalnya adanya proses perbaikan atau penguatan struktur.
+
Power Supply &
Current Regulator
5% NaCl
Solution Wire/Strand
Concrete Beam or Slab Stainless Steel Plate
Gambar 3. Model Korosi 2.1. Inisiasi Korosi
Sejumlah para peneliti telah mengusulkan berbagai perumusan yang berbeda untuk memodelkan inisiasi korosi. Perumusan tersebut antara lain berupa model analitis berdasarkan berbagai mekanisme fisika seperti difusi (diffusion), absorpsi (absorption), medan listrik statis (electrostatic fields), seperti telah diusulkan oleh Bazant (1979), Bentz dkk (1999), Nagesh dan Bhattacharjee (1998), serta Robert dkk (2000). Disamping perumusan analitis, terdapat perumusan inisiasi korosi yang berupa perumusan empiris yang diturunkan berdasarkan hasil tes, seperti diusulkan oleh Hong and Hooton (1999), Li (2002) dan atau data lapangan (Bamforth, 1999), Liam dkk (1992). Perbedaan perumusan tersebut jelas menunjukkan bahwa mekanisme inisiasi korosi yang sesungguhnya cukup kompleks dan merupakan gabungan berbagai macam proses diatas dan bukan akibat proses tunggal, seperti telah disampaikan oleh Papadakis dkk (1996).
Dari berbagai usulan perumusan inisiasi korosi yang telah ada maka proses inisiasi korosi pada umumnya dimodelkan sebagai proses difusi dengan memakai hukum Fick kedua (misalnya Mejibro, 1996). Pendekatan ini banyak dilakukan, meskipun sesungguhnya asumsi yang dipakai pada hukum Fick kedua banyak berbeda dengan kondisi sesungguhnya dari proses inisiasi korosi pada beton bertulang, antara lain:
• Beton dianggap sebagai material yang homogen
• Beton dalam kondisi jenuh air
• Permukaan dianggap semi-tak terhingga untuk proses difusi
• Koefisien difusi dianggap konstan
• Pengaruh retak akibat beban diabaikan
Perumusan hukum Fick kedua untuk menentukan kadar garam pada jarak x dari permukaan beton pada waktu t dirumuskan sebagai berikut:
dimana Co adalah kadar garam di permukaan beton, D adalah koefisien difusi dan erf adalah fungsi kesalahan
(the error function). 2.2. Propagasi Korosi
Untuk tahap propagasi korosi, sedikitnya ada 2 (dua) hal yang perlu mendapat perhatian, yaitu
• Tipe korosi
• Kecepatan korosi
Pada umumnya tipe korosi yang dijadikan dasar untuk penentuan pengaruh korosi pada struktur beton adalah
• korosi seragam (uniform corrosion)
• korosi setempat (localized/pitting corrosion).
Gambar 4. Korosi Seragam (Uniform Corrosion)
Tipe korosi setempat dimodelkan pada Gambar 5, seperti diusulkan oleh Val dan Melchers (1997). Model tersebut didasarkan pada hasil tes korosi dipercepat yang dilakukan oleh Gonzales dkk (1995). Tipe korosi setempat pada umumnya terjadi pada struktur beton yang berada di lingkungan garam, seperti air laut.
Gambar 5. Korosi Setempat (Pitting Corrosion)
Perbedaan anggapan tipe korosi yang terjadi akan menghasilkan prediksi penurunan kekuatan struktur beton yang berbeda, seperti dapat dilihat pada Gambar 6. Gambar tersebut menunjukkan bahwa korosi setempat akan mengakibatkan penurunan kekuatan struktur yang lebih kecil dibanding dengan korosi seragam. Dengan bertambahnya umur struktur, perbedaan kekuatan struktur yang terjadi juga akan semakin besar seperti ditunjukkan pada Gambar 5 untuk umur 25 tahun dan 50 tahun untuk kedua jenis tipe korosi.
0.0 100 5.0 10-2 1.0 10-1 1.5 10-1 2.0 10-1 2.5 10-1 3.0 10-1 3.5 10-1
0.0 5.0 10.0 15.0 20.0
i corr = 5.0 µA/cm
2
P
ro
b
a
b
il
it
y D
en
sit
y
Mn (t-m)
T = 25 years (pitting) T = 50 years (pitting)
T = 50 years (general)
T = 25 years (general)
Gambar 6. Perbandingan Pengaruh Korosi Seragam dan Korosi Setempat
Dari berbagai percobaan dan penelitian yang telah dilakukan diketahui bahwa beberapa faktor mempengaruhi besarnya kecepatan korosi, antara lain tahanan listrik beton, ketersediaan oksigen di permukaan logam, air-semen rasio, tebal selimut beton, kadar garam, temperatur dan waktu. Dari semua faktor diatas, ada 2 (dua) faktor utama yang sangat berpengaruh pada kecepatan korosi adalah
• Tahanan listrik beton (Electrical Resistivity of Concrete)
• Ketersediaan oksigen pada permukan logam terkorosi (Oxygeen Availability at Steel Surface)
Kecepatan korosi pada struktur beton diperkirakan dengan 2 (dua) cara, yaitu
• pengukuran
• perumusan empiris
Kecepatan korosi berdasarkan pengukuran dilakukan antara lain dengan pengukuran berdasarkan Teknik Polarisasi Linier (Linear Polarization Technique), dimana perubahan kecil arus pada logam yang mengalami korosi di larutan ion akan menyebabkan perubahan potensial dari logam tersebut. Alat yang dibuat untuk mengukur korosi baik di laboratorium maupun di lapangan berdasarkan metoda diatas antara lain dihasilkan oleh K. C. Clear’s 3LP dan Geocisa Gecor. Pengukuran dengan metoda ini memiliki kelemahan, yaitu mendefinisikan luasan dimana arus akan dikerjakan. Oleh sebab itu cara ini biasanya dikombinasikan dengan cara lain yaitu pengukuran kehilangan berat (Weight Loss Method), sesuai ASTM G1-90. Cara ini mengharuskan pengambilan logam dimana korosi terjadi (Destructive Test), sehingga diperlukan langkah yang tepat mengenai lokasi pengambilan logam agar tidak mengurangi kekuatan struktur secara berlebihan.
Kecepatan korosi dapat pula diperkirakan dengan memakai perumusan empiris, seperti diusulkan oleh Vu dan Stewart (2000) sebagai berikut:
(
)
dimana icorr(1) adalah perkiraan kecepatan korosi, w/c adalah faktor air-semen dan cover adalah tebal selimut
beton dalam mm. Namun demikian perumusan diatas hanya berlaku untuk kondisi lingkungan dengan tingkat kelembaban sekitar 80% dan suhu 20oC. Gambar 7 menunjukkan hasil perhitungan korosi untuk berbagai kondisi faktor air-semen dan tebal selimut beton dengan memakai persamaan diatas.
Gambar 7. Pengaruh tebal Cover dan w-c rasio terhadap Kecepatan Korosi
Perdebatan selanjutnya mengenai kecepatan korosi adalah apakah kecepatan korosi pada struktur beton bertulang berubah dengan waktu. Pendapat yang timbul mengenai hal ini ada 3 (tiga) macam, yaitu
• Kecepatan korosi tetap (konstan)
• Kecepatan korosi tidak tetap
o berkurang dengan waktu o bertambah dengan waktu
Adapun alasan yang dipakai mengapa kecepatan korosi berkurang dengan waktu adalah dengan terbentuknya karat pada permukaan logam selama pproses korosi dan berakumulasi dengan waktu, akan mengurangi difusi ion yang jauh dari permukaan logam dan secara bersamaan rasio luasan anoda dan katoda juga akan berkurang dengan waktu. Berdasarkan argumen tersebut maka Vu dan Stewart (2000) mengusulkan perumusan kecepatan korosi berkurang dengan waktu sbb:
year
Gambar 8 menggambarkan pengaruh waktu terhadap kecepatan korosi. Gambar tersebut menunjukkan bahwa setelah 10 tahun kecepatan korosi akan berkurang secara drastis menjadi sebesar 40% dari kecepatan korosi awal.
Gambar 8. Pengaruh Waktu terhadap Kecepatan Korosi
Sedangkan alasan yang dipakai mengapa korosi meningkat dengan waktu adalah berkaitan dengan kondisi mikro di daerah yang mengalami korosi, terutama untuk korosi setempat. Ketika proses korosi berjalan terjadi proses pengasaman (acidification) akibat proses hidrolisa. Hal ini akan meningkatkan kecepatan korosi. Pendapat ini sesuai dengan hasil tes yang dilakukan Alonso dkk (1998), Vu (2003) dan Darmawan (2005) dimana kecepatan korosi yang terjadi 50% lebih besar dibandingkan kecepatan korosi yang direncanakan. Namun demikian hingga saat ini belum terdapat usulan perumusan untuk kecepatan korosi yang meningkat dengan waktu, meskipun telah ada beberapa hasil penelitian yang mendukung argumen tersebut.
Perbedaan pendapat diatas semakin memperjelas kenyataan bahwa mekanisme korosi pada struktur beton masih belum diketahui dengan pasti. Tentu saja hal ini semakin menimbulkan pertanyaan seberapa akurat kita dapat memprediksi umur bangunan beton di lingkungan air laut.
III. Analisa Teori Kemungkinan
Sudah menjadi fakta yang tidak terbantahkan bahwa parameter yang mempengaruhi korosi tidak dapat ditentukan dengan pasti (mempunyai nilai rata-rata/mean dan sebaran/standard deviation yang tertentu). Dengan demikian pendekatan deterministik yang umum dipakai selama ini untuk memperhitungkan pengaruh korosi agak kurang tepat. Cara yang paling rasional tentunya adalah dengan memperhitungkan faktor ketidakpastian tersebut dalam perhitungan pengaruh korosi, yaitu dengan memakai analisa teori kemungkinan. Sebagai contoh adanya ketidakpastian parameter pada tahap inisiasi korosi dapat dilihat pada Tabel 1.
Tabel 1 menunjukkan bahwa beberapa parameter yang berpengaruh pada inisiasi korosi mempunyai koefisien variasi yang sangat besar, misalnya untuk parameter kadar chloride di permukaan beton (Co),
mempunyai COV sebesar 0.79 dan untuk kadar chloride kritis (Cr) sebesar 0.375. Dengan menggunakan
parameter statistik diatas maka dilakukan perhitungan waktu inisiasi korosi dengan hasil seperti disajikan pada Gambar 8, untuk beton dengan mutu fc’ 18 MPa, cover 30 mm dan tingkat kualitas pekerjaan sedang (fair).
Tabel 1. Parameter Statistik Tahap Inisiasi Korosi
Parameter Mean COV Distribusi Referensi Co - sea spray
0
Waktu Inisiasi Korosi (Tahun) fc'=18 MPa; cover=30 mm kualitas pekerjaan=sedang (fair)
mean=29.42 tahun;cov=1.35 min=1 tahun; max=200 tahun
Gambar 9. Distribusi Waktu Inisiasi Korosi
Sedangkan pengaruh ketidakpastian parameter statistik pada tahap propagasi korosi untuk balok pada Gambar 10, dengan dimensi 30×60 cm2, tulangan tarik 3D16 dan mutu beton f’c 20 MPa, mutu baja fy 465 MPa
dan kecepatan korosi sebesar 5μA/cm2 (≈58μm/yr) ditunjukkan pada Gambar 11. Sedangkan parameter statistik yang dipakai pada perhitungan ini ditunjukkan pada Tabel 2.
Gambar 10. Balok 30 x 60 cm2 Tabel 2. Parameter Statistik Penampang Beton Bertulang
Parameters Mean COV Distribution Reference
f’ Model Error (Lentur) 1,01 0.046 Normal Ellingwood dkk (1980)
icorr 5,0 μA/cm2 0,3 Normal Stewart dan Rosowsky (1998)
Catatan: kw = tingkat kualitas tenaga kerja; ki = faktor kuat tekan setempat; s = deviasi standar
Gambar 11 menunjukkan bahwa 25 tahun sesudah waktu korosi inisiasi, ada 60% kemungkinan kekuatan lentur penampang akan dibawah momen disainnya. Setelah 50 tahun maka kemungkinan dilampauinya nilai ini akan meningkat menjadi sebesar 99%. Pada waktu yang sama, maka untuk momen service ada kemungkinan sebesar 30% untuk dilampaui. Sebaliknya untuk kondisi tanpa korosi maka untuk momen disain ada kemungkinan akan dilampaui sebesar 6%. Perlu dicatat disini bahwa baik momen disain maupun
3D16
momen service diperlakukan sebagai variabel deterministik. Pada kenyataannya kedua variabel ini juga variabel acak (random). Apabila adanya ketidaktentuan pada kedua variabel tersebut juga diperhitungkan, maka besarnya nilai kemungkinan dilampainya momen service dan disain juga akan berubah. Kesemua hasil ini menunjukkan bahwa korosi mempunyai pengaruh yang cukup berarti terhadap kekuatan lentur penampang. Apabila pengaruh korosi ini tidak segera ditangani maka tidak menutup kemungkinan akan menimbulkan kegagalan struktur.
0.0 100
Gambar 11. Pengaruh Korosi Terhadap Kekuatan Lentur Balok 30 x 60 cm2
IV. Inspeksi Berkala
Untuk dapat menentukan umur layan bangunan yang mengalami korosi secara lebih akurat maka diperlukan data-data mengenai
• Kondisi bangunan saat ini
• Kecepatan korosi
• Beban yang bekerja baik pada masa lalu maupun akan datang
Data-data diatas dapat diperoleh melalui proses inspeksi, khususnya bila inspeksi dapat dilakukan secara berkala. Inspeksi berkala perlu dilakukan mengingat masih terbatasnya tingkat akurasi prediksi umur beton berdasarkan perumusan yang ada. Inspeksi sebaiknya lebih sering dilakukan dengan makin meningkatnya umur struktur beton. Dari hasil inspeksi diharapkan diperoleh data yang lebih spesifik dan mewakili keadaan sesungguhnya dibandingkan data yang didapatkan dari literature.
Proses inspeksi untuk menentukan sisa umur layan bangunan dilakukan dengan melakukan langkah sebagai berikut:
• Pengumpulan data-data tentang perencanaan dan pelaksanaan
• Pengamatan visual
Pengumpulan data perencanaan bertujuan untuk mendapatkan parameter disain yang dipakai, misalnya beban rencana, mutu bahan rencana, dimensi dll. Sedangkan pengumpulan data pelaksanaan untuk mengetahui perubahan-perubahan yang terjadi pada disain awal selama masa pelaksanaan dan juga untuk mengumpulkan hasil tes bahan yang dilakukan selama masa pelaksanaan.
Pengetesan non destruktif pada umumnya dapat dilakukan dalam jumlah yang cukup banyak karena biayanya relatif murah dan tidak akan mempengaruhi kekuatan struktur. Bila jumlah data cukup banyak maka akan didapat gambaran secara kuantatif dan lebih menyeluruh mengenai kondisi struktur bangunan. Namun demikian uji non-destruktif dianggap mempunyai beberapa kelemahan. Misalnya data dari hasil hammer test hanya dianggap dapat mewakili kondisi kekuatan beton di daerah permukaan, sementara hasil uji ultrasonic (UPV) sangat dipengaruhi keberadaan tulangan dalam beton. Oleh sebab itu uji non-destruktif sebaiknya dilengkapi dengan uji destruktif.
Uji destruktif dilakukan untuk memastikan agar data non-destruktif dapat diinterprestasikan secara lebih baik, yaitu dengan membuat korelasi antara hasil uji non-destruktif dengan destruktif (melakukan proses kalibrasi). Sebagai contoh, uji ultrasonic (UPV) dan hammer test sebaiknya dilengkapi dengan uji tekan hasil benda uji bor inti (cored-drill). Salah satu contoh hasil kalibrasi antara UPV dengan hasil uji tekan core-drilled disajikan pada Gambar 12 sedangkan hasil kalibrasi antara hammer tes dengan hasil uji tekan core-drilled dapat dilihat pada Gambar 13.
240
Gambar 12. Hubungan Antara Hasil UPV dengan Hasil Uji Tekan
80
Gambar 13. Hubungan Antara Hasil Hammer Tes dengan Hasil Uji Tekan
Gambar 12 dan 13 menunjukkan ada korelasi yang cukup baik antara hasil uji destruktif dan non-destruktif. Dengan demikian penggunaan uji non-destruktif untuk keperluan inspeksi dapat dipertanggung-jawabkan secara teknis, asalkan didukung dengan hasil uji destruktif.
0 5 10 15 20 25 30
20 30 40 50 60
Cou
n
t
Tebal Cover (mm)
mean=36.3 mm;s =4.5 mm; cov=0.13 min=30 mm; max=45 mm
Gambar 14. Tebal Cover Beton
Kecepatan korosi dapat ditentukan baik dengan memakai uji non-destruktif maupun destruktif. Pada umumnya dilakukan uji memakai Half-Cell Potential untuk menentukan area mana yang mempunyai tingkat kemungkinan mengalami korosi yang lebih tinggi. Nilai potensial tulangan diukur dengan alat half cell potensial dengan elektroda standar, misalnya Cupri Sulfat (CuS04). Nilai tersebut bisa menunjukkan kondisi korosi baja yang terdapat di dalam beton. Aturan menginterpretasikan hasil pengukuran memakai cara ini disajikan pada Tabel 3. Salah satu contoh hasil pengukuran Hall-Cell Potensial dapat dilihat pada Gambar 15.
Tabel 3. Aturan Hasil Pengukuran Hall-Cell Potensial sesuai ASTM C 876-91
Nilai Potensial Kondisi Tulangan > -200 mV Kemungkinan tidak korosi > 90% -200 mV s/d -350 mV Korosi tidak jelas
< -350 mV Kemungkinan korosi > 90%
Gambar 15. Hasil Pengukuran Half-Cell Potensial
Pengukuran Half Cell Potential yang dikombinasikan dengan pengamatan visual mengenai kondisi bangunan (misalnya adanya retak-retak, bercak-bercak korosi dll) dapat dipakai untuk menentukan lokasi mana yang memerlukan pengukuran korosi secara lebih akurat dengan pengukuran berdasarkan Teknik Polarisasi Linier (Linear Polarization Technique), seperti K. C. Clear’s 3LP dan Geocisa Gecor. Pengukuran ini kemudian dilanjutkan dengan pengambilan logam yang mengalami korosi pada lokasi tertentu dan dilakukan pengukuran kehilangan berat (Weight Loss Method) untuk mendapatkan data kecepatan korosi.
Apabila data-data mengenai kondisi struktur saat inspeksi yang meliputi mutu bahan, beban yang bekerja dan kecepatan korosi telah diperoleh, maka data-data ini selanjutnya akan dipakai sebagai data masukan (input) ke dalam perumusan untuk menentukan kelayakan struktur saat ini dan perkiraan umur struktur beberapa tahun kedepan. Mengingat masih adanya keterbatasan pada model yang dipakai untuk menentukan sisa umur layan bangunan beton pada saat ini, maka prediksi ini sebaiknya dibatasi tidak lebih dari 5-10 tahun kedepan.
3550 3600 3650 3700 3750 3800 3850 3900 3950
V. Kesimpulan dan Saran
Makalah ini telah menjelaskan perkembangan terakhir mengenai model yang dapat dipakai untuk menentukan umur layan bangunan beton di lingkungan air laut. Model tersebut pada umumnya diturunkan berdasarkan kondisi yang berbeda dengan kondisi sesungguhnya (misalnya memakai tes korosi dipercepat, benda uji yang relatif lebih kecil), maka diperlukan kehati-hatian dalam penggunaannya. Untuk menutupi kelemahan tersebut maka penggunaan model yang ada perlu disertai dengan pengumpulan data-data di lapangan melalui proses inspeksi secara berkala. Berdasarkan data-data hasil inspeksi dan model yang diturunkan melalui berbagai penelitian telah dapat ditentukan umur layan bangunan dengan lebih baik dan akurat. Mengingat bahwa semua parameter yang mempengaruhi umur layan bangunan tidak dapat ditentukan secara pasti, maka sebaiknya dipakai pendekatan probabilistik (memakai teori kemungkinan) sebagai cara yang paling rasional bila dibandingkan cara yang dipakai selama ini, yaitu pendekatan deterministik (deterministic approach). Untuk mendapatkan hasil tes korosi yang lebih sahih (valid), maka sebaiknya tes korosi untuk keperluan penelitian dilakukan dengan memakai benda uji yang mendekati kondisi di lapangan.
VI. Daftar Pustaka
[1] Alonso, C., Andrade, C., Rodriguez, J. and Diez, J.M. (1998), Factors Controlling Cracking of Concrete Affected by Reinforcement Corrosion, Materials and Structures, Vol. 31, pp. 435-441.
[2] Andrade, C., Alonso, C. dan Molina, F.J. (1993), Cover Cracking as a Function of Rebar Corrosion: Part 1 – Experimental Test, Material and Structures, Vol. 26, pp. 453-464.
[3] Andrade, C., Diez, J.M. dan Alonso, C. (1997), Mathematical Modelling of a Concrete Surface “Skin Effect” on Diffusion in Chloride Contaminated Media, Advanced Cement Based Materials, Elsevier Science Ltd., USA.
[4] ASTM G1-03 (1999), Standard Practice for Preparing, Cleaning, and Evaluating Corrosion Test Specimens, American Standard Testing Materials (ASTM), West Conshohocken, Pennsylvania, USA. [5] Attard, M.M. dan Stewart, M.G. (1998), A Two Parameter Stress Block for Model for High Strength
Concrete, ACI Structural Journal, ACI, Vol. 95, No. 3, pp. 305-317.
[6]
Bamforth, P. B. The Derivation of Input Data for Modelling Chloride Ingress from Eight-Year UK Coastal Exposure Trials. Magazine of Concrete Research. Vol. 51, No. 2, 1999. pp. 89-96.[7] Bazant, Z. P. Physical Model for Steel Corrosion in Sea Structures-Theory. Journal of the Structural Division. ASCE, Vol. ST6, 1979. pp. 1137-1154.
[8] Bentur, A., Diamond, S. and Berke, N. S. (1997), Steel Corrosion in Concrete: Fundamentals and Civil Engineering Practice, E&FN Spon, New York.
[9] Bentz, B. E., Thomas, M. D. A. and Hooton, R. D. An Overview and Sensitivity Study of a Multimechanistic Chloride Transport Model. Cement and Concrete Research. Vol. 29, 1999. pp. 827-837.
[10]Broomfield, J. P. (1997), Corrosion of Steel in Concrete: Understanding, Investigation and Repair, E&FN Spon, London.
[11]Darmawan, M.S. dan Stewart, M.G. (2006), Effect of spatially variable pitting corrosion on structural reliability of prestressed concrete bridge girders, Australian Journal of Structural Engineering, Vol. 6, No. 2, pp. 147-158.
[12]Ellingwood, B., Galambos, T.V., MacGregor, J.G. dan Cornell C. A. (1980), Development of a Probability Based Load Criterion for American National Standard A58, National Bureau of Standards Special Publication 577, US Government Printing Office, Washington DC
[13]
Gonzales, J.A., Andrade, C., Alonso, C. dan Feliu, S. (1995), Comparison of Rates of General Corrosion and Maximum Pitting Penetration on Concrete Embedded Steel Reinforcement, Cement and Concrete Research, Vol. 25, No. 2, pp. 257-264.[14]Hong, K. and Hooton, R. D. Effects of Cyclic Chloride Exposure on Penetration of Concrete Cover. Cement and Concrete Research. Vol. 29, No. 9, Sept 1999, pp. 1379-1386.
[15]Li, C. Q. Initiation of Chloride-Induced Reinforcement Corrosion in Concrete Structural Members-Prediction. ACI Structural Journal. Vol. 99, No. 2, March-April 2002. pp. 133-141.
[16]Liam, K. C., Roy, S. K. and Northwood, D. O. Chloride Ingress Measurement and Corrosion Potential Mapping Study of a 24-Year-Old Reinforced Concrete Jetty Structures in a Tropical Marine Environment. Magazine of Concrete Research. Vol. 44, 1992. pp. 205-215.
[17]Mejibro, L. (1996), The Complete Solution to Fick’s Second law of Diffusion With Time-dependent Diffusion Coefficient and Surface Concentration, Proceedings of CE-MENTA’s Workshop on Durability of Concrete in Saline Environment, Danderyd, Sweden.
[18]Mirza, S.A. dan MacGregor, J.G. (1979a), Variability of Mechanical Properties of Reinforcing Bars, Journal of the Structural Division, ASCE, Vol. 105, No. ST5, pp. 921-937.
[20]
Mubarok, M.Z., Rohman, F.D., Imran, I. dan Purwadaria, S. (2001), Prediction of Corrosion Initiation of Steel Reinforcement in Concrete Structures Submerged in Seawater, CAP-2001, Paper 036.[21]Nagesh, M. and Bhattacharjee, B. Modelling of Chloride Diffusion in Concrete and Determination of Diffusion Coefficients. ACI Materials Journal. Vol. 95, No. 2, Mar-Apr 1998. pp. 113-120.
[22]Papadakis, V.G., Roumeliotis, A.P., Fardis, M.N. dan Vagenas, C.G. (1996), Mathematical Modelling of Chloride Effect on Concrete Durability and Protection Measures, Concrete Repair, Rehabilitation and Protection, R. K. Dhir and M. R. Jones (Eds), E & FN Spon, London, pp. 165-174.
[23]Robert, M. B., Atkins, C., Hogg, V. and Middleton, C. A Proposed Empirical Corrosion Model for Reinforced Concrete. Structures and Buildings. I. C. E., Vol. 140, No. 1, 2000. pp. 1-11.
[24]Stewart, M.G. (1995), Workmanship and Its Influence on Probabilistic Models of Concrete Compressive Strength, ACI Materials Journal, Vol. 92, No. 4, pp. 361-372.
[25]Stewart, M. G. and Rosowsky, D. V. (1998), Structural Safety and Serviceability of Concrete Bridges Subject to Corrosion, Journal of Infrastructure System, ASCE, Vol. 4, No. 4, pp. 146-155.
[26]Thoft-Christensen, P. dan Hansen, H.I. (1994), Optimal Strategy for Maintenance of Concrete Bridges Using Expert System, Proc. ICOSSAR ’93, A. A. Balkema, Rotterdam, The Netherlands, pp. 939-946. [27]Val, D.V. dan Melchers, R.E. (1997), Reliability of Deteriorating Reinforced Concrete Slab Bridges,
Journal of Structural Engineering, Vol. 123, No. 12, pp. 1638-1644.
[28]Vu, K.A.T. dan Stewart, M.G. (2000), Structural Reliability of Concrete Bridges Including Improved Chloride-induced Corrosion Models, Structural Safety, Vol. 22, No. 4, pp. 313-333.
[29]Vu, K.A.T., Stewart, M.G., dan Mullard, J.A. (2005), Corrosion induced cracking: Experimental data and predictive models, ACIStruct. J., Vol. 102, No. 5, pp.