L
Journal of Experimental Marine Biology and Ecology 243 (2000) 1–15
www.elsevier.nl / locate / jembe
Feeding, physiology and growth responses in first-feeding
gilthead seabream (Sparus aurata L.) larvae in relation to
prey density
* ´ G. Parra, M. Yufera
´ ´
Instituto de Ciencias Marinas de Andalucıa(CSIC) Apartado Oficial, 11510 Puerto Real, Cadiz, Spain Received 18 March 1999; received in revised form 15 May 1999; accepted 19 July 1999
Abstract
21
The effects of prey density (0.1, 1 and 10 rotifer ml ) on feeding, oxygen uptake, growth, survival and energetic efficiencies in Sparus aurata larvae were investigated. Dry weights and
21
total lengths at day 15 after hatching were similar in larvae fed with 10 and 1 rotifer ml but
21
were significantly higher than in larvae fed with 0.1 rotifer ml . These differences were a consequence of a delay in starting feeding and growth in larvae fed with the lowest rotifer
21
concentrations tested. Growth rates were similar in larvae fed on 0.1 and 1 rotifer ml , while
21
larvae fed with 10 rotifers ml showed the smallest growth rate. Survival decreased markedly (from 91 to 7%) when prey density decreased. Ingestion rates of the actively feeding larvae
21
increased with age at the three prey densities but larvae fed with 0.1 rotifer ml showed lower ingestion rates. The specific oxygen uptake increased from hatching up to 35–40mg dry weight; above this size the specific oxygen consumption remained almost constant. Survival at the end of the experimental period was closely related to the percentage of larvae able to start feeding at day
21
6. In larvae fed with 0.1 rotifer ml , the energy ingested during the first days of feeding roughly met maintenance requirements. Therefore, the survival of larvae able to start feeding is not guaranteed at such low prey density. 2000 Elsevier Science B.V. All rights reserved.
Keywords: Larval fish; First feeding; Food availability; Ingestion rate and respiration rate
1. Introduction
The gilthead seabream (Sparus aurata L.) is a sparid, occurring in the North Eastern Atlantic Ocean and the Mediterranean Sea (Bauchot and Hureau, 1986). The larvae of
*Corresponding author.
´
E-mail address: [email protected] (M. Yufera)
this species measure 2.5 mm at hatching and are very sensitive during the first stages of development. Due to its importance in the aquaculture of the Mediterranean countries, gilthead seabream has been profusely studied in the laboratory (Person-Le Ruyet and Verillaud, 1980; Tandler and Sherman, 1981; Pascual and Arias, 1982; Divanach and Kentouri, 1983; Tandler and Helps, 1985; Koven et al., 1990; Polo et al., 1992;
´
Kolkowski et al., 1993; Mourente et al., 1993; Yufera et al., 1993a; Koven et al., 1998). One point of prime interest, both in nature and in cultured populations, is the ability of
´ larval fish to grow and develop in relation to the food available at first feeding. Yufera et al. (1993b) found that, in the complete absence of food at 19.58C, the gilthead seabream larvae reached the point of irreversible starvation by day 8 after hatching, and did not survive day 10. However, the consequences of a relative food restriction had not been examined and it was important to know whether such restriction reduces growth or survival, or both. The implications of this question in understanding recruitment of the natural fish population are evident, and several studies have been conducted on different species in the past, trying to find critical prey availability to maintain a normal recruitment (Houde, 1978; Werner and Blaxter, 1980). But there are also implications for fish cultivation in the laboratory. High prey concentrations are used to maximise ingestion, and consequently growth and survival, in intensive rearing tanks with a high larvae density and high food demand. Relatively high live-prey density is also being used in combination with inert diet when researching prepared feeds for larvae
(Vergara-´ ` ´
Marın et al., 1990; Holt, 1993; Bernabe and Guissi, 1994; Hayashi, 1995;
Fernandez-´ ´
Dıaz and Yufera, 1997). Nevertheless, to evaluate the real contribution of the inert diet it is necessary to first know to what extent the presence of live prey supports larval growth and development.
The present study investigated the effect of prey concentration on growth, survival, ingestion, oxygen uptake and energetic efficiencies of S. aurata larvae. The aims were to find the minimum food ration that allows larval development, and to examine whether prey availability influences the timing of the commencement of feeding and body growth.
2. Materials and methods
Sparus aurata eggs were obtained by natural spawning from captive broodstocks and
were incubated at 19.58C. Newly hatched larvae were transferred to 300-l tanks with 21
continuous illumination and a salinity of 33 g l . Constant slight aeration was provided. 21
Initial larvae density ranged from 50 to 70 larvae l . From day 3 onwards, about 15–20% of the water volume was renewed daily. Live prey was added from day 4 after hatching. Two different Brachionus species were supplied: B. rotundiformis (¯0.2mg mean dry weight) for larvae with a mean dry weight below 60 mg and B. plicatilis (¯0.4 mg mean dry weight) for larvae above 60 mg (Polo et al., 1992). Three prey
21
densities, 0.1, 1 and 10 rotifer ml , were tested. The highest prey concentration tested is the standard concentration used in normal culturing of S. aurata larvae.
egg batches. Total lengths were measured with an ocular micrometer on 20 larvae per sample. Dry weight was determined by drying samples of about 15–30 larvae at 858C to constant weight. Specific growth rate (G) was calculated as the slope of the exponential regression of dry weight on time. The initial weight-decreasing period before the onset of growth were not taken into account in determining G and only positive growth periods were considered. Larval density in the rearing tanks was estimated on day 4 (first feeding) and day 15 (end of the experiment) by counting larvae in ten 250 ml samples. Energy content was determined on freeze-dried larvae using a semimicro bomb calorimeter Parr 1421. Three sub-samples of 20 mg were used in each determination. The energy employed in growth (G ) was calculated using larval caloric content and thee
daily dry weight increase. Production (P) has been estimated from the total increase in larvae dry weight biomass per volume unit during the experimental time, assuming that mortality occurred only in non-growing starved larvae.
Ingestion experiments were carried out directly in the rearing tanks at 6, 9, 12 and 15 days after hatching. About 20–30 larvae were sampled periodically (every 5, 10 or 15 min) over a 2- or 4-h period depending on larval age, and then anaesthetised with ethyl-4-amino-benzoate. The larvae were then examined under a light microscope to
´
examine the gut content. The method described by Yufera et al. (1993a) is based on the use of green-coloured rotifers by means of short refeeding period in a dense suspension of microalgae cells. These green rotifers can be distinguished from those that have been in rearing tanks for several hours, because the latter look brown. The fullness of guts follows an asymptotic function
2bt
C5Cmax(12e )
where C is the number of green rotifers (per larva showing gut content), Cmax is the 21
asymptote of the curve (rotifers?larva ), t is time (h), and b is a regression parameter 21
which indicates the instantaneous rate of gut filling (h ). This model was fitted by the iterative method to the asymptotic function. The ingestion rate (I ) was calculated as the derivative of this function against time of this function at the starting point, when no green rotifers had yet been evacuated
I5Cmaxb
21
The daily specific ration (SR) was calculated as SR5I?M?24 DW , where I is the 21 21
ingestion rate (rotifer larva h ), M is the average rotifer dry weight (mg) and DW is the larval dry weight (mg). When I is multiplied by rotifer dry weight (mg), ingestion
21 21
rate is expressed as dry mass ingested per larva per hour, IR (mg larva h ). Rotifer dry weight and energy content values used for the calculations were determined as a
´
function of the egg / female ratio observed in the larval gut (Yufera et al., 1997). The energy intake (I ) was calculated using the ingestion rates and the rotifer energy content.e
Percent of actively feeding larvae were determined by examining at least 100 larvae from the same samples used in determining the ingestion rate.
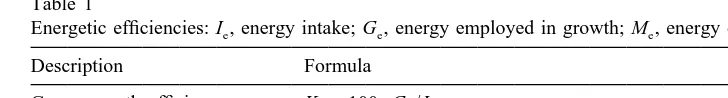
Table 1
Energetic efficiencies: I , energy intake; G , energy employed in growth; M , energy expended in metabolisme e e
Description Formula
Gross growth efficiency K15100?G /Ie e Assimilation efficiency A5100?(Ge1M ) /Ie e Gross metabolic efficiency M15100?M /Ie e
was wired via a data acquisition board (Metrabyte DAS8-PGA) to a PC program used for continuous data logging. The Weiss equation was used to estimate oxygen solubility in relation to temperature and salinity (Weiss, 1970). After a 5–15 min equilibration period, the electrode was stabilised and oxygen concentration declined at a constant rate. Oxygen uptake by the larvae was estimated as the slope of the regression line of oxygen concentration on time during 20–30 min following electrode stabilisation. Sterilised and
21
air-saturated seawater (salinity 33 g l ) was used. The respiratory chamber was kept at a constant temperature (19.5060.058C). The water volume in the respiratory chamber was approximately 3 ml. The number of larvae in each experiment ranged from 5 to 9. The larvae were held without food in the chamber, but they had been held under normal rearing conditions in the tanks prior to measurements. When mortality occurred inside 21
the chamber, the data were excluded. Oxygen uptake was calculated in nmol O larva2
21
h . After each experiment, larval dry weight was determined for calculation of specific 21 21
oxygen consumption (nmol O2 mg h ). Oxygen consumption (OC) for each prey density in relation to larval weight were fitted to a curve of the type
b OC5aDW
DW being the larval dry weight, and a and b regression parameters.
During the early development, the seabream larvae that starved for more than 12 h suffer serious damage and this period is insufficient to evacuate the gut content because the larvae tend to retain the ingested food within the gut in absence of prey in the medium. Consequently, it is not realistic to perform experiments using larvae with empty guts. Therefore, we assumed measurements represented routine metabolism plus the specific dynamic action. The energy expended in metabolic processes (M ) wase
21
calculated using the oxygen uptake rates and the oxycalorific coefficient (13.56 J mg dry weight) from Brett and Groves (1979) for conversion into energy units. The energetic efficiencies were calculated using the energy intake (I ), the energy employede
in growth (G ) and the metabolic energy (M ) as is shown in Table 1.e e
Data from the different treatments were compared using one-way ANOVA and Student t-test for slopes comparison. When significant differences were detected, the Newman–Keuls multiple-range procedure was used to determine the statistical differ-ences between treatments. Before the statistical analyses, the dry weight and total length data were log-transformed and the survival percentage values were arcsine transformed.
3. Results
Table 2
21
Sparus aurata: total length (TL; mm), dry weight (DW;mg), percentage of survival, energy content (J mg ),
21 21
growth rates (G; d ) and biomass net production (P; mg l ) in 15-day-old larvae under different prey densities
DW 61.17611.84 110.82614.10 107.10622.30
a b c
Survival 6.6763.65 39.31616.74 91.12612.26
a a b
Energy content 17.1861.44 17.1960.98 19.2360.23
a a b
G 0.19860.048 0.18060.012 0.14660.020
a b c
P 21222624 8666631 422361256 a
Data represent mean6SD of three replicates. Same superscript letter denotes no statistical differences (P,0.05).
21 21
and 10 rotifer ml , whereas when fed 0.1 rotifer ml the larvae showed a significantly lower dry weight (P.0.05) (Table 2). This was a consequence of the corresponding growth patterns (Fig. 1). From the onset of feeding (day 4), when the larvae weighed
21
approximately 25 mg, the weight gained at day 15 with 0.1 rotifer ml was less than 21
one-half of that obtained with 1 and 10 rotifer ml . However, Fig. 1 shows that there 21
was a 2-day delay in starting growth with 1 rotifer ml , and a 5-day delay with 0.1 21
rotifer ml . Considering from the start of growth, the specific growth rate (G) in larvae
21 21
fed on 10 rotifers ml was lower than in larvae fed with 0.1 and 1 rotifer ml (P.0.05). Mortality increased strongly during the experimental period with decreasing rotifer concentration, and only 6.7% of larvae survived at day 15 when fed 0.1 rotifer
21
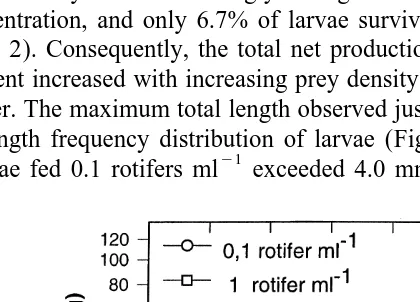
ml (Table 2). Consequently, the total net production from first feeding to the end of the experiment increased with increasing prey density up to a maximum of 4223mg dry mass per liter. The maximum total length observed just before first feeding on day 4 was 4.0 mm. Length frequency distribution of larvae (Fig. 2) revealed that on day 9, only
21
10% of larvae fed 0.1 rotifers ml exceeded 4.0 mm total length. On the other hand,
Fig. 2. Total length frequency distribution of Sparus aurata larvae reared under the different prey concentrations. Numbers within the graphs indicate the rotifer concentration. Dashed bars indicate the maximum length class observed at the onset of feeding.
21
most larvae fed 10 rotifers ml (¯90%) exceeded 4.0 mm on day 9, while larvae fed at
21
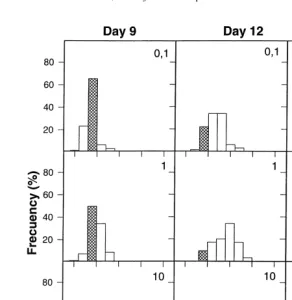
1 rotifer ml showed an intermediate figure, with 42% of the population over 4.0 mm. The proportion of actively feeding larvae during development is shown in Fig. 3. The percentages of larvae able to start feeding increased when the prey density increased.
21
When larvae were fed with 10 rotifers ml , this percentage increased progressively from the first days of feeding, reaching a maximum of approximately 90% by day 12
21
after hatching (Fig. 3a). Conversely, when fed with 0.1 and 1 rotifer ml , the percentage of feeding larvae decreased during the first days, especially with 0.1 rotifer
21
ml . Only beyond the point of irreversible starvation, after the starving larvae died, did 21
this percentage increase to reach values similar to those observed at 10 rotifer ml by day 15. Fig. 3b shows the relationships between the percentage of actively feeding larvae and the mean dry weight of the population. It is interesting to note that when the population grew above 35–40 mg most of the larvae (.60%) were actively eating, irrespective of prey density.
21 21
Fig. 3. Percentage of the actively feeding Sparus aurata larvae under three different rotifer concentrations in relation to (A) larval age and (B) mean larval dry weight.
21 21
on 0.1 rotifers ml than 1 and 10 rotifers ml . On day 6, when the larval size 21
differences among treatments were still small, larvae fed 0.1 rotifers ml only ingested 30% of their dry weight per day, while at the other tested rotifer densities the specific daily rations (SR) were higher (70–80%) (P,0.05). The differences in SR tended to
21
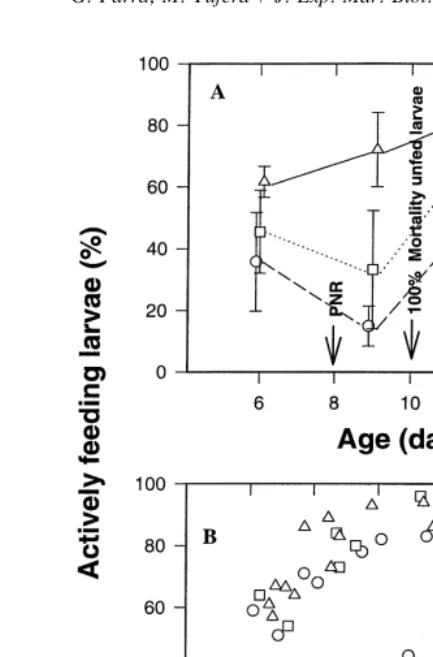
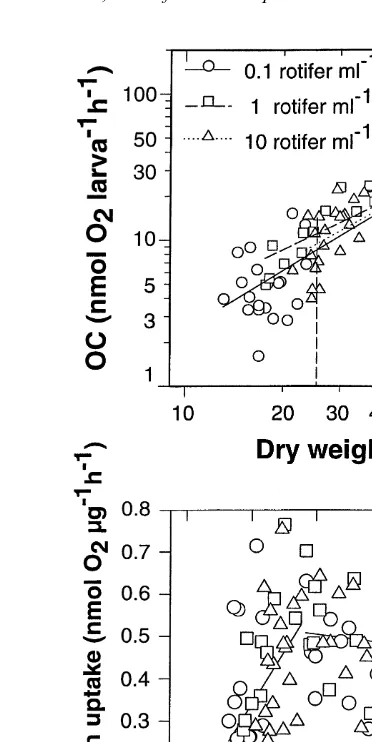
decrease with age, but larvae fed with 1 rotifer ml always showed the highest SR. The oxygen uptake increased with larvae weight (Fig. 4a). Power functions relating
21 21
the oxygen uptake (CO; nmol O larva2 h ) to dry weight (DW;mg) were fit for each prey. Regression functions are:
21 1.418
0.1 rotifer ml CO50.083 DW r50.830 n530 21 1.193
1 rotifer ml CO50.236 DW r50.881 n520 21 1.350
10 rotifer ml CO50.116 DW r50.872 n543
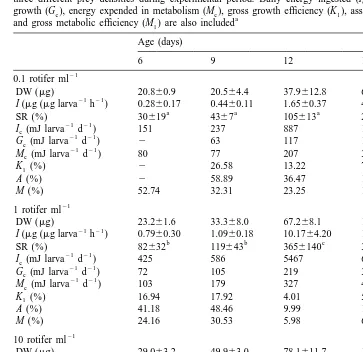
Table 3
21 21
Sparus aurata: ingestion rate (I;mg larva h ) and specific daily ration (SR; %) observed in larvae under three different prey densities during experimental period. Daily energy ingested (I ), energy employed ine growth (G ), energy expended in metabolism (M ), gross growth efficiency (K ), assimilation efficiency (A),e e 1
a and gross metabolic efficiency (M ) are also included1
Age (days)
Data represent mean6SD of three replicates. Same superscript letters indicate no statistical differences in SR for each larval age (P,0.05).
1.044
CO50.398 DW r50.813 n560
21 21
The specific oxygen uptake (nmol O2 mg h ) showed minimum and maximum 21 21
Fig. 4. (A) Oxygen uptake as a function of dry weight of Sparus aurata larvae fed with three different prey densities. Vertical dashed line indicates mean dry weight at first feeding (Day 4). (B) Specific oxygen uptake
21 21
(nmol O2mg h ) as a function of dry weight. Two straight lines have been fitted to data below and above 25mg dry mass.
Gross growth efficiency (K ) decreased with increasing age and dry weight under the1
three prey densities tested, reaching minimum values of around 4–7% (Table 3). Assimilation efficiency (A) showed the same tendency, showing minimum values of around 10–20% at the end of the experiment period. Gross metabolic efficiency (M )1
displayed a similar pattern with all prey densities tested. However, the initial value (on day 6) in larvae fed on 0.1 was higher (53%) than the values in later days and also higher than the values in larvae fed with 1 and 10, where M was never over 32% (Table1
4. Discussion
The relationship between growth and age during the first stages of larval development is determined by the transition from endogenous to exogenous feeding. S. aurata larvae hatch at an approximate dry weight of 30mg and decrease to 25mg at the opening of the
´
mouth. At this time the yolk reserves are practically exhausted (Yufera et al. 1993b), and the larvae need to start exogenous feeding in order to continue development and start growth. The commencement of feeding requires a learning process lasting a few days, during which the percentage of actively eating larvae increases progressively from the opening of the mouth to the point of irreversible starvation. This learning period varies with species. Tucker (1988) found that over 80% of black sea bass (Centropristis striata
striata) larvae were able to eat on the first day of feeding, while bay anchovy (Anchoa mitchilli ) larvae needed 5 days to reach this level. Likewise, above 90% of Senegal sole
´
(Solea senegalensis) larvae eat on the first day of feeding (Yufera, unpublished). This differential feeding behaviour determines a particular bioenergetic pattern for each species during this period.
The present study shows that prey availability affects the duration of the transition period before growth commences, causing delays in starting growth. More specifically, it seems to be related to succeeding in starting to feed, which depends on encounter opportunity and on the particular ability of each larva to catch prey. From day 4 to day 6, only the part of population, probably the most vigorous larvae, start feeding. With 10
21
rotifers ml there is enough prey for the rest of the larvae with less ability to catch prey, so they can also start feeding during the following days. However, with 1 rotifer
21
ml , practically the same number of larvae able to eat on day 6 continue eating after 21
the moment of irreversible starvation (day 9), while with 0.1 rotifer ml the number of eating larvae decreases. These patterns are reflected in the size-frequency distribution on day 9 (Fig. 2), and the most remarkable is the coincidence between percentage of larvae above 4 mm at day 9 and the survival results at the end of the experiments. Only at the lowest rotifer density, survival was lower than the percentage of larvae showing gut
21
content on day 9. This means that a concentration of 0.1 rotifer ml does not warrant a continuous feeding for those larvae able to feed at the onset of exogenous feeding. Consequently, this low prey concentration does not warrant their survival. The estimates of the total biomass produced from first feeding to the end of the experiment were highly
21
related with prey concentration. At 0.1 rotifer ml , the net production balance resulted negative due to mass mortality of larvae unable to start feeding, although such value could be underestimated, because some mortality occurred also after the theoretic point of irreversible starvation.
During the first days of exogenous feeding, fish larvae increase their swimming activity and improve their feeding ability progressively. In our experiments with gilthead seabream, most larvae above approximately 35 mg are actively eating irrespective of prey density. At that mean dry weight practically no starved larvae remained alive in the populations, but it seems that larvae need to reach such a minimum size in order to eat and grow with reasonable efficiency. In addition, food restriction induces a selection of 21
21
higher growth rates at the lower prey densities (0.1 and 1 rotifer ml ). A compensatory growth response, after a food-limited period, has been reported for larvae of several species (Van der Meeren and Naess, 1993; Gotceitas et al., 1996), although the higher growth rates observed in our study can be a consequence of the selection of most vigorous larvae. In our study, larvae mortality produced a progressive change in the larvae / prey ratio mainly at low prey density; however, prey density remained constant. Changes in prey accessibility during the experiment were due to the development of swimming and predatory capabilities beyond 35mg dry weight (approximately 4.2–4.4 mm total length) as mentioned previously. This enhancement of the predatory ability justifies the increase in specific ingestion during the experimental period, even in the
´
lowest prey density. Yufera et al. (1995) observed that this upward tendency in the specific ingestion changes above approximately 100 mg larval dry weight. A similar pattern was observed in Solea solea larvae during the first days of feeding (Day et al., 1996).
Gross growth efficiency and assimilation efficiency of S. aurata larvae fall below the range determined for growing larvae of marine fish in general (Houde and Zastrow, 1993; Letcher and Bengtson, 1993), although K values close to 10% and assimilation1
efficiencies close to 20% has been reported for Anchoa mitchilli (Houde and Schekter, 1983; Tucker, 1988). Such low efficiencies could be a consequence of a feeding strategy tending to maximise the ingestion with a low food residence time in the gut in presence of high prey density. In fact, it is usual to see rotifers and eggs still alive in the faeces. In addition, the particular conditions of the intensive culture procedure, with permanent illumination and 24 h feeding a day, contribute to maximise the larval growth but probably with low assimilation efficiency.
21
The oxygen uptake at first days of feeding ranged from 3 to 10 nmol ind h . These 21
values match with the 6 nmol ind h determined for yolksac larvae (Rønnestad et al., 21
1994) and with the 3.5 to 6.5 nmol ind h for first feeding larvae (Quantz and Tandler, 1984) of this species. Exponents in the oxygen uptake vs. larval weight equations ranged from 1.2 to 1.4, although the slopes in our study are biased by larvae unable to start feeding which lost weight as well as by the narrow dry mass range tested. Anyway, when considering pooled data of larvae above 25mg dry weight, that is, only growing larvae, the metabolism tend to increase isometrically (exponent: 1.04) with larval weight. The methodology used in the present study has some limitations. Dry weight and metabolism has been determined in samples which grouped several larvae. Nevertheless, differences in length and dry weight on day 6 are still too small, while the larvae unable
´
to start feeding did not survive to day 12 (Yufera et al., 1993b). Therefore, only samples at day 9 could accumulated large feeding and small starved larvae, although differences in total length are also small (Fig. 2). On the other hand, we did not found any group effect in the oxygen consumption determinations (Parra, 1998) as observed by Imabayashi and Takahashi (1987) working with larvae of Pagrus major.
increase in the metabolism at first feeding is considered as a consequence of the development of the digestive tract and the increase of the larval activity searching for food during the learning period. After some days, the organs with high metabolic activity would have an isometric grow and the catch efficiency acquired by the larvae would allow to maintain a constant searching activity. The metabolic rate appeared to be similar and independent of food availability at the first developmental stages, although the high variability of our data would prevent to detect the differences. Nevertheless, a decrease in oxygen uptake with decreasing food ration has been reported in growing
Clupea harengus larvae (Kiorbøe et al., 1987).
Gross metabolic efficiency (M ) showed similar decreases in relation to body weight1
in larvae fed with the three prey densities. Therefore, the energy used in metabolism followed a similar pattern irrespective of prey density. Only at day 6 in larvae fed 0.1
21
rotifer ml did the M value not follow this trend. In that case, the energy involved in1
21 21
metabolism was approximately 80 mJ larva day , while the ingested energy was 151 21 21
mJ larva day . Metabolic energy represented more than 50% of ingested energy. Taking into account that part of rotifer biomass cannot be assimilated (lorica and maxtac), those larvae had little energy available for activities other than maintenance. This energy restriction could explain why a percentage of larvae showing rotifers in the gut on day 6 did not continue eating on day 9 and that they did not survive to day 15. Such an energetic limitation was not observed at higher prey densities. M reached a1
value of close to 32% after day 9 because their predatory capacities increased and consequently there was enough energy to allow growth.
The M values obtained in the present study are close those reported by Yamashita1
and Bailey (1989) in Theragra chalcogramma larvae. Larvae were reared with two prey 21
densities also close to our highest prey densities (10 and 1 rotifer ml ). The M values1
reported at the beginning of their experiment were 30 and 36%, for the two prey densities. They concluded that there were no differences in growth, ingestion and efficiencies among both prey densities. However, in the present study, the lowest prey density is ten times smaller than lower density tested in Yamashita and Bailey study, and
21
we found differences in growth and survival between larvae fed on 0.1 rotifers ml and 21
1 and 10 rotifers ml . In gilthead seabream larvae, low prey densities can delay growth and affect survival rather than affect growth rate. This have been also reported in
Oncorhynchus mykiss, the larvae of which, under a delay in starting to feed, showed
lower weights but maintained the same growth rate (Kamler, 1992). The maximisation of growth in early stages shortens the period during which larvae are highly vulnerable to predation and disease (Houde and Zastrow, 1993; Cowan et al., 1996).
The experimental conditions used in the present study differed from nature, mainly in both larvae and prey densities, as well as in the species diversity (considering fish larvae, prey and predators). Therefore, it is difficult to know to what extent the results obtained coincide with the actual values of feeding and metabolic activities in natural habitats, but they are representative of physiological tendencies and responses. Mackenzie et al.
21
(1990) reported in natural areas a mean prey density of around 25mg l , which is close 21
21
(Houde, 1978). Following that criterion, 0.1 rotifer ml is lower than the critical prey concentration. From the point of view of seabream larvae reared under laboratory
21
conditions (usually at a density ranging between 3 and 10 rotifer m l ), a concentration 21
of 1 rotifer ml is sufficient for half of the population to succeed in starting to eat and grow. Therefore, above such live prey density a food restriction never occurs and larvae will grow continuously.
Acknowledgements
We thank J.M. Espigares and J.A. Miquel for their helpful technical assistance. This
´ ´
work was supported by the Comision Interministerial de Ciencia y Tecnologıa, Spain (CICYT Projects AGF-94-0756 and MAR97-0924-C02-01).
References
Bauchot, M.L., Hureau, J.C., 1986. Sparidae. In: Whitehead, P.J.P., Bauchot, M.L., Hureau, J.C., Nielsen, J., Tortonese, E. (Eds.), Fishes of the North-Eastern Atlantic and the Mediterranean, Vol. II, UNESCO, Bungay, pp. 883–907.
`
Bernabe, G., Guissi, A., 1994. Adaptations of feeding behaviour of larvae of the Sea bass, Dicentrarchus
labrax (L.), to an alternating live-food / compound-food feeding regime. Aquacult. Fish Manag. 25,
537–546.
Brett, J.R., Groves, T.D.D., 1979. Physiological energetics. In: Hoar, W.S., Randall, D.J. (Eds.), Fish Physiology, Vol. VIII, Academic Press, New York, pp. 279–344.
Cowan, Jr. J.H., Houde, D.E., Rose, K.A., 1996. Size-dependence vulnerability of marine fish larvae to predation: an individual-based numerical experiment. ICES J. Mar. Sci. 53, 23–37.
Day, O.J., Jones, D.A., Howell, B.R., 1996. Food consumption, growth and respiration of sole, Solea solea (L.), during early ontogeny in a hatchery environment. Aquacult. Res. 27, 831–839.
` Divanach, P., Kentouri, M., 1983. Influences des condicions trophiques initiales sur la resorption des reserves
`
lipidiques, la croissance et la survie des larvas de daurades, Sparus aurata, en elevage extensif. Aquaculture 35, 43–55.
´ ´ ´
Fernandez-Dıaz, C., Yufera, M., 1997. Detecting growth in gilthead seabream, Sparus aurata L., larvae fed on microparticules. Aquaculture 153, 93–102.
Gotceitas, V., Puvanendran, V., Leader, L.L., Brown, J.A., 1996. An experimental investigation of the ‘match / mismatch’ hypothesis using larval Atlantic cod. Mar. Ecol. Prog. Ser. 130, 29–37.
Hayashi, M., 1995. Growth, survival and vitality of sea bream, Pagrus major, and Japanese flounder,
Paralichthys olivaceus, fry fed microbound diets. Israel J. Aquacult. 47, 119–128.
Holt, G.J., 1993. Feeding larval Red Drum on microparticulate diets in a close recirculating water system. J. World Aquacult. Soc. 24, 225–230.
Houde, E.D., 1978. Critical food concentrations for larvae of three species of subtropical marine fishes. Bull. Mar. Sci. 28, 395–411.
Houde, E.D., Schekter, R.C., 1983. Oxygen uptake and comparative energetics among eggs and larvae of three subtropical marine fishes. Mar. Biol. 72, 283–293.
Houde, E.D., Zastrow, C.E., 1993. Ecosystem- and taxon specific dynamics and energetics properties of larval fish assemblages. Bull. Mar. Sci. 53, 290–335.
Imabayashi, H., Takahashi, M., 1987. Oxygen consumption of postlarval and juvenile red sea bream, Pagrus
major, with special reference to group effect. J. Fac. Appl. Biol. Sci. Hiroshima Univ. 26, 15–21.
Kiorbøe, T., Munk, P., Richarson, K., 1987. Respiration and growth of larval herring Clupea harengus: relation between specific dynamic action and growth efficiency. Mar. Ecol. Prog. Ser. 40, 1–10.
Kolkowski, S., Tandler, A., Kissil, W., Gertler, A., 1993. The effect of dietary exogenous digestive enzymes on ingestion, assimilation, growth and survival of gilthead seabream (Sparus aurata Sparidae, Linnaeus) larvae. Fish Physiol. Biochem. 12, 203–209.
Koven, M.W., Tandler, A., Kissil, G.W., Sklan, D., Friezlander, O., Harel, M., 1990. The effect of dietary (n-3) polyunsaturated fatty acids on growth, survival and swim bladder development in Sparus aurata larvae. Aquaculture 91, 131–141.
Koven, M.W., Parra, G., Kolkovski, S., Tandler, A., 1998. The effect of dietary phosphatidylcholine and its constituent fatty acids on microdiets ingestion and fatty acid absorption rate in gilthead seabream, Sparus
aurata, larvae. Aquacult. Nutrit. 4, 39–45.
Letcher, B.H., Bengtson, D.A., 1993. Effects of food density on growth and on patterns of prey depletion by larval silverside fish, Menidia beryllina (Cope); a laboratory investigation with image analysis. J. Exp. Mar. Biol. Ecol. 167, 197–213.
Mackenzie, B.R., Leggett, W.C., Paters, R.H., 1990. Estimating larval fish ingestion rates: can laboratory derived values be reliably extrapolated to the wild? Mar. Ecol. Prog. Ser. 67, 209–225.
´
Mourente, G., Rodrıguez, A., Tocher, D.R., Sargent, J.R., 1993. Effects of dietary docosahexaenoic acid (DHA; 2:6n-3) on lipid and fatty acid composition and growth in gilthead seabream (Sparus aurata L.) larvae during first feeding. Aquaculture 112, 79–98.
Oikawa, S., Itazawa, Y., Gotoh, M., 1991. Ontogenetic change in the relationship between metabolic rate and body mass in a sea bream Pagrus major (Temmick and Schlegel). J. Fish. Biol. 38, 483–496.
´ ´
Parra, G., 1998. Fisiologıa y balance energetico durante el desarrollo larvario de peces marinos (Solea ´
senegalensis Kaup y Sparus aurata Linneo) en cultivo. Tesis doctoral, Universidad de Cadiz.
˜ ´ ´
Pascual, E., Arias, A., 1982. Diseno, construccion y funcionamiento de una planta piloto para la produccion de ´
alevines de dorada. Inf. Tecn. Inst. Invest. Pesq. 91 / 92, 52 pp.
´ ´
Person-Le Ruyet, J., Verillaud, P., 1980. Techniques d’elevage intensive de la daurade doree (Sparus aurata ` ˆ
(L.)) de la naissance a l’age de deux mois. Aquaculture 20, 351–370. ´
Polo, A., Yufera, M., Pascual, E., 1992. Feeding and growth of gilthead seabream, Sparus aurata L., larvae in relation to the size of the rotifer strain used as food. Aquaculture 103, 45–54.
Quantz, G., Tandler, A., 1984. The effect of weight and environmental temperature on the oxygen consumption of gilthead seabream (Sparus aurata L.) larvae. Eur. Maricult. Soc., Spec. Publ. 8, 229–239. Rønnestad, I., Koven, W.M., Tandler, A., Harel, M., 1994. Energy metabolism during development of eggs and
larvae of gilthead sea bream (Sparus auratus). Mar. Biol. 120, 187–196.
Tandler, A., Sherman, R., 1981. Food organism concentration, environmental temperature and survival of the gilthead seabream (Sparus aurata L.) larvae. Eur. Maricult. Soc., Spec. Publ. 6, 237–248.
Tandler, A., Helps, S., 1985. The effects of photoperiod and water exchange rate on growth and survival of gilthead seabream (Sparus aurata L.) from hatching to metamorphosis in mass rearing systems. Aquaculture 48, 71–82.
Tucker, Jr. J.W., 1988. Energy utilization in bay anchovy, Anchoa mitchilli, and black sea bass, Centropristis
striata striata, eggs and larvae. Fish. Bull. US 78, 279–293.
Van der Meeren, T., Naess, T., 1993. How does cod (Gadus morhua) cope with variability in feeding conditions during early larval stages? Mar. Biol. 116, 637–647.
´ ´ ´ ´
Vergara-Marın, J.M., Robaina Robaina, L.E., Hernandez-Cruz, C.M., Palacios, H., Fernandez-Palacios, J.E., Izquierdo, M.S., 1990. Estudios sobre el valor nutricional de un dieta microencapsuladad
˜
para larvas de dorada (Sparus aurata L). In: Ladin, A., Cervino, A. (Eds.), Actas Del Iii Congreso Nacional ´
De Acuicultura, Centro experimental de Vilaxoan, Pontevedra, pp. 39–44.
Weiss, R.F., 1970. The solubility of nitrogen, oxygen and argon in water and seawater. Deep Sea Res. 17, 721–735.
Werner, R.G., Blaxter, J.H.S., 1980. Growth and survival of larval herring (Clupea harengus) in relation to prey density. Can. J. Fish. Aquat. Sci. 37, 1063–1069.
Yamashita, Y., Bailey, K.M., 1989. A laboratory study of the bioenergetics of larval walleye pollock, Theragra
chalcogramma. Fish. Bull. US 87, 525–536.
´
´
Yufera, M., Pascual, E., Polo, A., Sarasquete, M.C., 1993. Effect of starvation on the feeding ability of gilthead seabream (Sparus aurata L.) larvae at first feeding. J. Exp. Mar. Biol. Ecol. 169, 259–272.
´ ´ ´
Yufera, M., Fernandez-Dıaz, C., Pascual, E., 1995. Feeding rates of gilthead seabream, Sparus aurata L., larvae on microcapsules. Aquaculture 134, 257–268.
´
Yufera, M., Parra, G., Pascual, E., 1997. Energy content of rotifers (Brachionus plicatilis and Brachionus