L
Journal of Experimental Marine Biology and Ecology 246 (2000) 179–221
www.elsevier.nl / locate / jembe
Changes in gametogenesis and fecundity of acroporid corals
that were exposed to elevated nitrogen and phosphorus
during the ENCORE experiment
*
Selina Ward , Peter Harrison
Centre for Coastal Management, Southern Cross University, Lismore NSW, Australia
Received 24 April 1999; received in revised form 3 September 1999; accepted 7 December 1999
Abstract
Colonies of two scleractinian reef coral species, Acropora longicyathus and Acropora aspera were transplanted into patch reefs at One Tree Reef, Great Barrier Reef, Australia as part of the ENCORE experiment. These corals and colonies of A. aspera which were naturally present in the patch reefs were exposed to four treatments over two years: controls with normal seawater, elevated levels of nitrogen only, phosphorus only, or nitrogen plus phosphorus. These corals were sampled and used to determine whether gametogenic cycles and fecundity were affected by nutrient enrichment. Acropora longicyathus had a single annual gametogenic cycle. Corals exposed to elevated nitrogen produced significantly smaller and fewer eggs and contained less testes material than those which were not exposed to nitrogen. Exposure to elevated phosphorus only resulted in corals producing more but smaller eggs, and more testes material. Egg numbers of colonies from other treatments decreased as the gametogenic cycles continued, but those of the phosphorus colonies showed almost no reduction in egg numbers between the early and late stages of the gametogenic cycles. These results have important management implications for coral reefs as they demonstrate that small increases in concentrations of nitrogen and phosphorus can have severe effects on reproductive activity in these species of scleractinian corals. 2000 Elsevier Science B.V. All rights reserved.
Keywords: Coral; Reproduction; Nutrients; ENCORE; Fecundity
1. Introduction
Coral reefs typically flourish in nutrient poor tropical seas (Darwin, 1842; Odum and
*Corresponding author. Present address: Centre for Marine Studies, The University of Queensland, Australia. E-mail address: [email protected] (S. Ward)
Odum, 1955), although they also occur in a wide range of nutrient concentrations (Kinsey, 1979; Kinsey and Davies, 1979; Smith et al. 1981). Nutrient levels in waters
around coral reefs range from 0 to 4 (mM nitrogen and 0.05–0.6 (mM phosphorus
(Kinsey, 1988; D’Elia and Wiebe, 1990), however nutrient concentrations on coral reefs are usually an order of magnitude lower than those of shallow water temperate ecosystems.
Eutrophication causes significant problems for coral reefs, and can result in degra-dation of reef ecosystems (e.g. Banner, 1974; Smith et al., 1981; Pastorok and Bilyard, 1985; Tomascik and Sander, 1985; Bell, 1992a,b). Nutrient enrichment can lead to enhanced growth of phytoplankton and attached algae (Pastorok and Bilyard, 1985; Schaffelke and Klumpp, 1998), changes in the composition of algal, coral and other benthic communities (Banner, 1974; Walker and Ormond, 1982; Naim, 1993), and a deterioration in water quality (Brodie, 1992). Elevated levels of nutrients can reduce the rate of growth and calcification of corals, and reef calcification (Kinsey and Davies, 1979; Walker and Ormond, 1982; Dubinsky and Jokiel, 1994) but Atkinson et al. (1995) found no reduction in growth rates of corals exposed to high nutrient levels in aquaria. Field studies along a gradient of eutrophication and other pollution in Barbados, West Indies, showed that planula production by the brooding reef coral Porites porites was reduced in polluted areas (Tomascik and Sander, 1987), and the abundance and diversity of coral recruits decreased with increasing eutrophication (Tomascik, 1991; Hunte and Wittenberg, 1992).
A number of anthropogenic activities increase nutrient loadings in marine environ-ments, including runoff from agricultural and urban areas (Bell, 1992b; Brodie, 1992) and deforestation in catchments (Webb, 1984; Kuhlmann, 1988; Brodie, 1992; Byron and Brodie, 1992). One of the most important anthropogenic sources of nitrogen and phosphorus to marine environments is sewage, and this can be a major problem for coral reefs (e.g. Doty, 1969; Banner, 1974; Kinsey, 1979; Marszalek, 1981; Smith et al., 1981; Walker and Ormond, 1982; Pastorok and Bilyard, 1985; Grigg, 1995). Phosphorus is found in both human waste and phosphorus based detergents, and in Australia 10 000 tonnes of phosphorus and 100 000 tonnes of nitrogen are produced in sewerage effluent annually (Brodie, 1992).
The ENCORE (Elevated Nutrients on Coral Reefs Experiment) experiment was conducted in order to better understand the effects of elevated levels of nitrogen and phosphorus on coral reefs. ENCORE was a large scale manipulative reef fertilization experiment designed to quantify the fate of nitrogen and phosphorus within a coral reef and to assess their relative impact on a variety of coral reef organisms (Steven and Larkum, 1993; Larkum and Steven, 1994). An important difference between the ENCORE experiment and previous work on nutrients is that ENCORE concentrated on examining effects of nitrogen and phosphorus in isolation, rather than in conjunction with other confounding factors such as sediment, heavy metals and other toxins that are often associated with nutrient enrichment in eutrophic areas. Thus, differences between treatments in ENCORE can be directly attributed to the effects of the nutrients.
S. Ward, P. Harrison / J. Exp. Mar. Biol. Ecol. 246 (2000) 179 –221 181
gonochoric (Fadlallah, 1983; Harrison and Wallace, 1990). In hermaphroditic coral species, eggs and spermaries may develop on the same mesenteries (as in the faviids and mussids), on different mesenteries within the same polyp (most pocilloporids and acroporids), in different polyps within the same colony, or rarely, at different times within the same colony (Fadlallah, 1983; Harrison and Wallace, 1990). Acroporids are hermaphroditic with eggs and spermaries on different mesenteries within the same polyp.
Measures of fecundity such as the number of eggs or the number of planulae per polyp can provide a useful index of reproductive effort and, as such, are a useful indicator of the health of a coral (Kojis and Quinn, 1984; Harrison and Wallace, 1990). Consequently, changes in these measures can be an indication of sublethal stress in corals. However, fecundity alone can underestimate the reproductive effort of the coral and is better combined with other reproductive measures such as the size of the eggs and the volume of testes material (Harrison and Wallace, 1990). It is important to understand the gametogenic cycle of the species so that sampling can occur at the most appropriate times.
The aims of these experiments were to examine the potential effects of elevated levels of nutrients on gametogenesis and fecundity in two reef coral species, Acropora
longicyathus and Acropora aspera, transplanted into the experimental microatolls.
Secondly, fecundity in colonies of Acropora aspera occurring naturally in the mi-croatolls was quantified to determine whether these were affected by the nutrient treatments. These species were chosen as they have relatively large polyps that can be dissected by hand so that the eggs and testes may be measured without the use of histological sections (Oliver, 1979; Wallace, 1985). When measuring reproductive output it is preferable to use polyp dissections rather than histology, as tissue shrinkage occurs during histological processes, and gametes or larvae may not occur in some sections, hence reproductive output may be underestimated in histological sections (Harrison and Wallace, 1990). A. longicyathus is also very suitable for transplantation because as the colonies grow, the basal areas die off, so that individual sections of one or more branches usually attach directly onto the substratum so sections of the colonies can be removed without damaging the remainder of the colony. The bottlebrush growth form also allows easy fragmentation.
2. Methods
One Tree Reef is located in the Mackay–Capricorn section at the southern end of the
Great Barrier Reef Marine Park (1528069E, 208319S) and is situated 70 km east of
Gladstone on the coast of Queensland and 18 km from the edge of the continental shelf.
One Tree Reef is a platform reef which measures 4.732.7 km and contains three
small circular patch reefs termed microatolls. At low tide, water within these microatolls is isolated from the surrounding lagoonal water for 3–4 h and during high tide the water rises 0.1 up to 1.2 m above the perimeter. The microatolls have walls made of coralline algae and coral and these walls drop vertically to the lagoon floor which is usually 5–8 m depth.
2.1. Experimental design
Twelve microatolls in the northern end of the lagoon were chosen for the ENCORE
3
experiment. These measured 16–25 m across, had volumes of 125–446 m and had similar coral / algal communities (Larkum and Steven, 1994). Three microatolls were randomly allocated to one of four treatments. Three microatolls were given no additional nutrients (controls), three microatolls were dosed with ammonium chloride only (nitrogen treatment), three were dosed with potassium dihydrogen phosphate (phosphor-us treatment) and three microatolls were dosed with a combination of nitrogen and phosphorus (ammonium chloride plus potassium dihydrogen phosphate).
2.2. Acropora longicyathus
Acropora longicyathus was chosen as the main experimental species and,
conse-quently, its gametogenesis was studied in the most detail. Sixty large colonies of
Acropora longicyathus were selected within the lagoon. These colonies were located in
the lagoon, around the outside of the ENCORE microatolls and nearby patch reefs in water no more than 2 m deep. In an attempt to avoid choosing clone colonies, most colonies were at least 10 m from each other and were selected on the basis of having different growth forms and pigmentation.
Several large pieces were taken from each parent colony and these were transplanted from the lagoon into the twelve ENCORE microatolls in February 1993, seven months before the nutrient dosing commenced. Five colonies were randomly chosen from the sixty parents to be transplanted to each of the 12 microatolls so that there was a total of 15 A. longicyathus transplants for each treatment (i.e. five colonies in three microatolls per treatment). The pieces of each colony were transplanted onto a separate plastic rack with PVC ‘‘legs’’ to hold it above the substratum. Pieces of coral were attached to the racks using cable ties and the racks were placed on the substratum of the microatolls. The parental colonies from which the transplants were taken were labelled so that they could be sampled throughout the study. They received no additional nutrients or manipulation.
2.3. Acropora aspera
S. Ward, P. Harrison / J. Exp. Mar. Biol. Ecol. 246 (2000) 179 –221 183
per treatment). Transplanted pieces were attached to plastic racks and placed into the microatolls in the same manner as those of Acropora longicyathus.
The five A. aspera parent colonies were not monitored.
2.4. Non-transplanted A. aspera
In addition, colonies of Acropora aspera were already growing naturally in nine of the microatolls and 18 of these naturally occurring colonies were labelled and mapped for sampling.
There were two fertilization periods; the initial dosing commenced in September 1993 and continued until January 1995. Microatolls were dosed twice a day, once every low tide when the microatolls were isolated from the surrounding lagoon. Nutrients were
added to achieve concentrations within the microatolls of 10 mM nitrogen and 2 mM
phosphorus at the start of each fertilization. The nutrients were rapidly dispersed within
the microatolls so that nutrient concentrations were 2 mM ammonium and 0.2 mM
phosphorus within minutes following addition, and were close to background levels within 1–3 hours after dosing (K. Koop, pers. comm.). The rate of nutrient dissipation was influenced by weather conditions with concentrations dropping fastest on windy days.
During the second fertilization phase, from January 1995 to February 1996,
con-centrations were increased to achieve loadings of 20 mM ammonium and 4 mM
phosphorus. Microatolls were dosed three times every low tide rather than once to ensure a more constant concentration. Actual concentrations of nutrients during the low tides in this period were much closer to the intended concentrations than those achieved
in the first period of fertilization. Concentrations of approximately 20 mM ammonium
and 4mM phosphorus were maintained for much of the low tide period. Over the 430
days of fertilization total loading of the microatolls ranged between 2097 and 5977
moles of NH –N and 245 to 1380 moles PO –P. The lower figures for each represent4 4
loadings between the low tide dosing periods. This experiment used short term pulsed additions which resulted in comparatively small increases in nutrient availability.
2.5. Sampling procedure
The 60 Acropora longicyathus transplants and 60 parental colonies were sampled at approximately three monthly intervals from February 1993 to November 1995. Sixty
Acropora aspera transplants were sampled approximately one month before spawning
and a few days prior to the predicted spawning period each year. The 18 colonies of A.
aspera naturally occurring in the microatolls were sampled a few days before the
predicted spawning period each year.
2.6. Processing of samples
Five polyps were scored for each sample. Individual polyps were dissected out from the decalcified tissue while viewed under a stereo dissecting microscope (after Oliver, 1979; Wallace, 1985). Each polyp was dissected to expose the eight mesenteries. Four mesenteries contained strings of eggs and four mesenteries developed testes. For each polyp, the number and the size of the eggs were scored. Two measurements were taken from each egg, a ‘‘length’’ and ‘‘width’’ measurement using a calibrated eyepiece micrometer in the dissecting microscope. The egg size was the mean of these two measures. The egg size of the polyp was the mean of the individual egg sizes. ‘‘Egg total’’ was calculated by adding all the individual egg sizes (or by multiplying the polyp egg size by the polyp egg number).
Testes were counted for the testes number. The length and width of each testis was measured using a calibrated eyepiece micrometer. The length and width of each testis were multiplied together and the sum of these calculations for each polyp was called the ‘‘testes total’’ for that polyp.
2.7. Statistical analyses
The egg number, polyp egg size, egg total and testes total were analysed for Acropora
longicyathus and Acropora aspera transplants using orthogonal two way nested analyses
of variance (Underwood, 1981). The main factors were the presence or absence of nitrogen and the presence or absence of phosphorus. For the nitrogen analyses, microatolls exposed to elevated nitrogen (nitrogen only and nitrogen plus phosphorus microatolls) were compared with those which did not receive nitrogen (controls and phosphorus only microatolls). For the phosphorus analyses, microatolls exposed to phosphorus (phosphorus only and nitrogen plus phosphorus microatolls) were compared with those which did not receive phosphorus (controls and nitrogen only). Microatolls were nested within the nitrogen by phosphorus interaction. Heterogeneity of variance was tested using Cochran’s test.
The data for the colonies of Acropora aspera naturally occurring in the microatolls were analysed using two way orthogonal analyses of variance without the microatoll nesting as these colonies were only present in nine of the twelve microatolls.
Fecundities of transplanted colonies of Acropora longicyathus in each treatment were compared with those of their parental colonies using one way analyses of variance.
3. Results
3.1. Acropora longicyathus transplants
S. Ward, P. Harrison / J. Exp. Mar. Biol. Ecol. 246 (2000) 179 –221 185
total (Figs. 1–7). Phosphorus alone had a different effect reflected in the many significant nitrogen by phosphorus interactions found in the analyses of variance. Phosphorus generally reduced the size of the eggs but often caused an increase in the number of eggs per polyp (Tables 1–7). For this reason the results for the phosphorus only corals will be described separately.
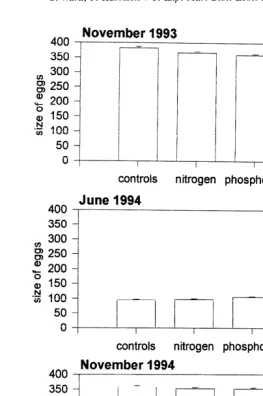
Fig. 2. The mean size of eggs (mm) present in polyps of Acropora longicyathus transplants from the experimental microatolls at One Tree Reef from November 1993 to November 1994. Error bars are standard errors.
3.2. Phosphorus only
S. Ward, P. Harrison / J. Exp. Mar. Biol. Ecol. 246 (2000) 179 –221 187
Fig. 3. The mean egg total (egg size3egg number) present in polyps of Acropora longicyathus transplants from the experimental microatolls at One Tree Reef from November 1993 to November 1994. Error bars are standard errors.
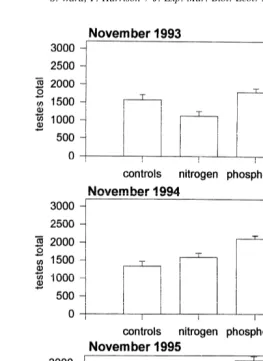
Fig. 4. The mean testes total present in polyps of Acropora longicyathus transplants from the experimental microatolls at One Tree Reef from November 1993 to November 1995. Error bars are standard errors.
In contrast, phosphorus significantly reduced the size of the eggs in November 1993
and November 1994 (Tables 1, 3; Fig. 2) with a mean egg size of 359mm in November
1993 compared with 382 mm in the control colonies. Phosphorus alone significantly
S. Ward, P. Harrison / J. Exp. Mar. Biol. Ecol. 246 (2000) 179 –221 189
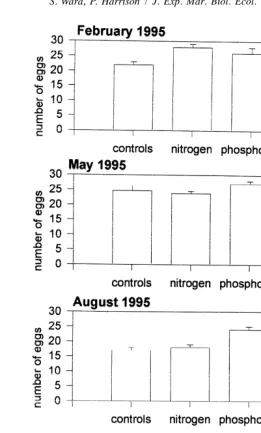
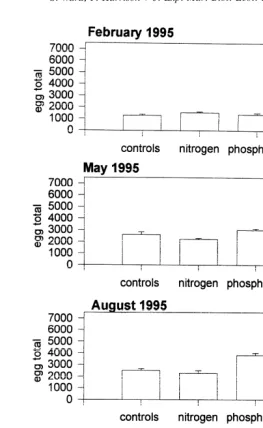
Fig. 5. The mean number of eggs present in polyps of Acropora longicyathus transplants from the experimental microatolls at One Tree Reef from February 1995 to November 1995. Error bars are standard errors.
3.3. Nitrogen
The effects of the presence of elevated nitrogen on the fecundity of Acropora
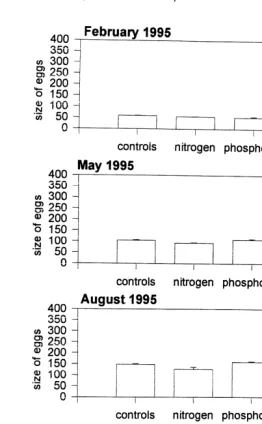
Fig. 6. The mean size of eggs (mm) present in polyps of Acropora longicyathus transplants from the experimental microatolls at One Tree Reef from February 1995 to November 1995. Error bars are standard errors.
S. Ward, P. Harrison / J. Exp. Mar. Biol. Ecol. 246 (2000) 179 –221 191
Fig. 7. The mean egg total (egg number3egg size) of polyps of Acropora longicyathus transplants from the experimental microatolls at One Tree Reef from February 1995 to November 1995. Error bars are standard errors.
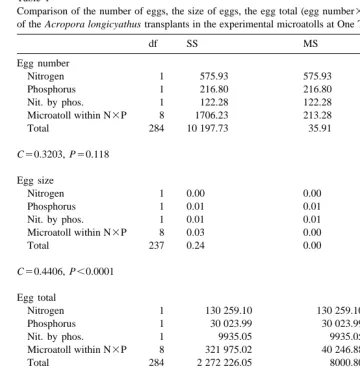
Table 1
Comparison of the number of eggs, the size of eggs, the egg total (egg number3egg size) and the testes total a of the Acropora longicyathus transplants in the experimental microatolls at One Tree Reef in November 1993
df SS MS F P
Egg number
Nitrogen 1 575.93 575.93 16.04 ,0.0001
Phosphorus 1 216.80 216.80 6.04 0.015
Nit. by phos. 1 122.28 122.28 3.41 0.066
Microatoll within N3P 8 1706.23 213.28 5.94 ,0.0001
Total 284 10 197.73 35.91
C50.3203, P50.118 Egg size
Nitrogen 1 0.00 0.00 0.01 0.910
Phosphorus 1 0.01 0.01 6.33 0.013
Nit. by phos. 1 0.01 0.01 12.71 ,0.0001
Microatoll within N3P 8 0.03 0.00 4.05 ,0.0001
Total 237 0.24 0.00
C50.4406, P,0.0001 Egg total
Nitrogen 1 130 259.10 130 259.10 16.28 ,0.0001
Phosphorus 1 30 023.99 30 023.99 3.75 0.054
Nit. by phos. 1 9935.05 9935.05 1.24 0.266
Microatoll within N3P 8 321 975.02 40 246.88 5.03 ,0.0001
Total 284 2 272 226.05 8000.80
C50.3156, P50.153 Testes total
Nitrogen 1 46 389 355.20 46389 355.27 50.73 ,0.0001
Phosphorus 1 1 084 505.18 1 084 505.20 1.19 0.277
Nit. by phos. 1 901 420.09 901 420.10 8.64 0.004
Microatoll within N3P 8 55 761 090.93 6 970 136.40 7.62 ,0.0001
Total 284 259 677 748.4 914 358.27
C50.3148, P50.160 a
Two way nested orthogonal analyses of variance were used. Treatments were presence or absence of nitrogen and presence or absence of phosphorus with microatoll number nested within the treatment interaction. Data were log(x11) transformed due to heterogeneity of variances. C denotes the Cochran’s test value.
Smaller eggs were found in the nitrogen treatments than in the non-nitrogen treatments and this effect was most pronounced in the corals exposed to nitrogen only
(e.g. a mean egg size of 302mm compared to 338mm in controls in November 1995).
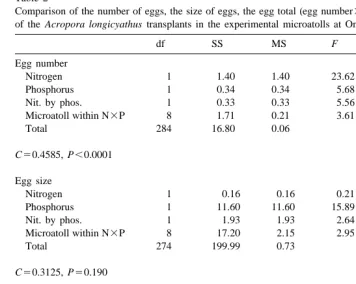
S. Ward, P. Harrison / J. Exp. Mar. Biol. Ecol. 246 (2000) 179 –221 193 Table 2
Comparison of the number of eggs, the size of eggs, the egg total (egg number3egg size) and the testes total a of the Acropora longicyathus transplants in the experimental microatolls at One Tree Reef in June 1994
df SS MS F P
Egg number
Nitrogen 1 1.40 1.40 23.62 ,0.0001
Phosphorus 1 0.34 0.34 5.68 0.018
Nit. by phos. 1 0.33 0.33 5.56 0.019
Microatoll within N3P 8 1.71 0.21 3.61 0.001
Total 284 16.80 0.06
C50.4585, P,0.0001 Egg size
Nitrogen 1 0.16 0.16 0.21 0.644
Phosphorus 1 11.60 11.60 15.89 ,0.0001
Nit. by phos. 1 1.93 1.93 2.64 0.106
Microatoll within N3P 8 17.20 2.15 2.95 0.004
Total 274 199.99 0.73
C50.3125, P50.190 Egg total
Nitrogen 1 2.68 2.68 20.30 ,0.0001
Phosphorus 1 1.55 1.55 11.75 0.001
Nit. by phos. 1 0.73 0.73 5.49 0.020
Microatoll within N3P 8 4.14 0.52 3.92 ,0.0001
Total 284 37.51 0.13
C50.3706, P50.003 a
Two way nested orthogonal analyses of variance were used. Treatments were presence or absence of nitrogen and presence or absence of phosphorus with microatoll number nested within the treatment interaction. Data were log(x11) transformed due to heterogeneity of variances. C denotes the Cochran’s test value.
elevated nitrogen (November 1993, 1994, 1995, May 1995, August 1995) (Tables 1–7; Figs. 2, 7). Egg total was also reduced by the presence of elevated nitrogen in November 1993, June 1994, November 1994 and November 1995 (Tables 1,2,3,7; Figs. 3, 7).
Exposure to elevated nitrogen reduced the amount of testes material produced with the nitrogen only corals having mean values of almost double those of the nitrogen plus phosphorus corals in November 1993. The testes total was significantly reduced by exposure to nitrogen in November 1993 and 1995 (Tables 1, 7). In November 1995 the nitrogen and nitrogen plus phosphorus treatments had mean testes total values approxi-mately two thirds those of the control colonies.
3.4. Acropora longicyathus: comparison of transplants and parental colonies
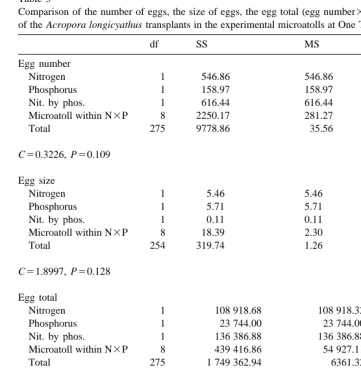
Table 3
Comparison of the number of eggs, the size of eggs, the egg total (egg number3egg size) and the testes total a of the Acropora longicyathus transplants in the experimental microatolls at One Tree Reef in November 1994
df SS MS F P
Egg number
Nitrogen 1 546.86 546.86 15.38 ,0.0001
Phosphorus 1 158.97 158.97 4.47 0.035
Nit. by phos. 1 616.44 616.44 17.34 ,0.0001
Microatoll within N3P 8 2250.17 281.27 7.91 ,0.0001
Total 275 9778.86 35.56
C50.3226, P50.109 Egg size
Nitrogen 1 5.46 5.46 4.34 0.038
Phosphorus 1 5.71 5.71 4.53 0.034
Nit. by phos. 1 0.11 0.11 0.09 0.765
Microatoll within N3P 8 18.39 2.30 1.83 0.073
Total 254 319.74 1.26
C51.8997, P50.128 Egg total
Nitrogen 1 108 918.68 108 918.32 17.12 ,0.0001
Phosphorus 1 23 744.00 23 744.00 3.73 0.054
Nit. by phos. 1 136 386.88 136 386.88 21.44 ,0.0001
Microatoll within N3P 8 439 416.86 54 927.11 8.63 ,0.0001
Total 275 1 749 362.94 6361.32
C50.3105, P50.211 Testes total
Nitrogen 1 12 970 522.44 12 970 522.44 19.23 ,0.0001
Phosphorus 1 501 382.34 501 382.34 0.74 0.389
Nit. by phos. 1 21 343 691.18 21 343 691.18 31.65 ,0.0001
Microatoll within N3P 8 61 677 283.07 7 709 660.40 11.43 ,0.0001
Total 275 185 460 785.7 74 402.86
C50.2939, P50.463 a
Two way nested orthogonal analyses of variance were used. Treatments were presence or absence of nitrogen and presence or absence of phosphorus with microatoll number nested within the treatment interaction. Testes volume data were log(x11) transformed due to heterogeneity of variances. C denotes the Cochran’s test value.
S. Ward, P. Harrison / J. Exp. Mar. Biol. Ecol. 246 (2000) 179 –221 195 Table 4
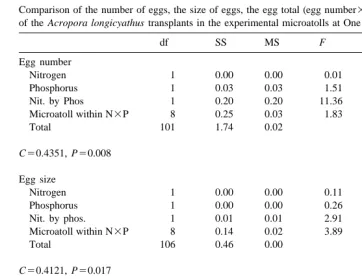
Comparison of the number of eggs, the size of eggs, the egg total (egg number3egg size) and the testes total a of the Acropora longicyathus transplants in the experimental microatolls at One Tree Reef in February 1995
df SS MS F P
Egg number
Nitrogen 1 0.00 0.00 0.01 0.943
Phosphorus 1 0.03 0.03 1.51 0.222
Nit. by Phos 1 0.20 0.20 11.36 0.001
Microatoll within N3P 8 0.25 0.03 1.83 0.080
Total 101 1.74 0.02
C50.4351, P50.008 Egg size
Nitrogen 1 0.00 0.00 0.11 0.741
Phosphorus 1 0.00 0.00 0.26 0.614
Nit. by phos. 1 0.01 0.01 2.91 0.091
Microatoll within N3P 8 0.14 0.02 3.89 ,0.0001
Total 106 0.46 0.00
C50.4121, P50.017 Egg total
Nitrogen 1 0.00 0.00 0.10 0.747
Phosphorus 1 0.02 0.02 0.98 0.324
Nit. by phos. 1 0.17 0.17 8.03 0.006
Microatoll within N3P 8 0.52 0.06 3.13 0.003
Total 101 2.09 0.02
C50.4619, P50.002 a
Two way orthogonal analyses of variance were used. Treatments were presence or absence of nitrogen and presence or absence of phosphorus. Data were log(x11) transformed due to heterogeneity of variances. C denotes the Cochran’s test value.
the colonies exposed to phosphorus only on a certain date, there would be more eggs in those transplants than their parental colonies on that date (Figs. 8–11).
There were no significant differences between the number of eggs per polyp in the control colonies and their parental colonies between November 1993 and 1995 (ANOVA
1993: df5139, F50.5021, P50.4798. 1994: df5130, F53.6591, P50.0580. 1995:
df5145, F50.5913, P50.4432) (Fig. 8). Although there were significantly fewer eggs
per polyp in the nitrogen transplants than the other treatments in November 1993, there was no significant difference between the number of eggs in these corals and their
parental colonies on this date or in November 1994 (ANOVA 1993: df5149, F51.2437,
P50.2666. 1994: df5140, F50.0207, P50.8857 In contrast, there were significantly
more eggs per polyp in the nitrogen only transplants than their parents in November
1995 (ANOVA df5149, F54.2093, P50.0420).
Table 5
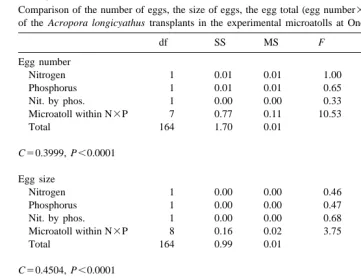
Comparison of the number of eggs, the size of eggs, the egg total (egg number3egg size) and the testes total a of the Acropora longicyathus transplants in the experimental microatolls at One Tree Reef in May 1995
df SS MS F P
Egg number
Nitrogen 1 0.01 0.01 1.00 0.320
Phosphorus 1 0.01 0.01 0.65 0.423
Nit. by phos. 1 0.00 0.00 0.33 0.566
Microatoll within N3P 7 0.77 0.11 10.53 ,0.0001
Total 164 1.70 0.01
C50.3999, P,0.0001 Egg size
Nitrogen 1 0.00 0.00 0.46 0.498
Phosphorus 1 0.00 0.00 0.47 0.494
Nit. by phos. 1 0.00 0.00 0.68 0.410
Microatoll within N3P 8 0.16 0.02 3.75 0.001
Total 164 0.99 0.01
C50.4504, P,0.0001 Egg total
Nitrogen 1 0.00 0.00 0.13 0.720
Phosphorus 1 0.02 0.02 0.91 0.340
Nit. by phos. 1 0.00 0.00 0.02 0.876
Microatoll within N3P 7 1.63 0.23 10.42 ,0.0001
Total 164 3.67 0.02
C50.4449, P,0.0001 a
Two way nested orthogonal analyses of variance were used. Treatments were presence or absence of nitrogen and presence or absence of phosphorus with microatoll number nested within the treatment interaction. Data were log(x11) transformed due to heterogeneity of variances. C denotes the Cochran’s test value.
1995 (e.g. ANOVA 1993: df5150, F519.4111, P,0.0001) and fewer eggs in the
nitrogen plus phosphorus corals than their parental colonies in 1993 and 1994 (e.g.
ANOVA 1993: df5149, F57.4951, P50.0069).
The size of the eggs of transplanted colonies was generally significantly smaller than those of the parental colonies (Fig. 9). The only exceptions were the control corals in
November 1993 (ANOVA df5112, F52.7986, P50.0972) and November 1995
(ANOVA df5146, F52.0885, P50.1506) and the nitrogen plus phosphorus corals in
November 1993 (ANOVA df5122, F52.2947, P50.1324).
The egg total of the parental colonies generally mirrored the transplants except where
there was a difference due to treatment (e.g. ANOVA 1993 phosphorus: df5150,
F513.9679, P50.0003; ANOVA 1994 nitrogen plus phosphorus: df5149, F515.1689,
S. Ward, P. Harrison / J. Exp. Mar. Biol. Ecol. 246 (2000) 179 –221 197 Table 6
Comparison of the number of eggs, the size of eggs, the egg total (egg number3egg size) and the testes total a of the Acropora longicyathus transplants in the experimental microatolls at One Tree Reef in August 1995
df SS MS F P
Egg number
Nitrogen 1 72.76 72.76 3.11 0.081
Phosphorus 1 163.71 163.71 7.00 0.009
Nit. by phos. 1 533.68 533.68 22.81 ,0.0001
Microatoll within N3P 8 839.75 104.97 4.49 ,0.0001
Total 164 1.70 0.01
C50.3613, P50.136 Egg size
Nitrogen 1 0.00 0.00 1.81 0.182
Phosphorus 1 0.02 0.02 8.77 0.004
Nit. by phos. 1 0.00 0.00 0.01 0.938
Microatoll within N3P 8 0.08 0.01 3.69 0.001
Total 104 0.29 0.00
C50.4228, P50.012 Egg total
Nitrogen 1 3 016 057.10 3 016 057.10 4.54 0.035
Phosphorus 1 7 550 206.50 7 550 206.50 11.36 0.001
Nit. by phos. 1 12 322 168.32 12 322 168.32 18.55 ,0.0001
Microatoll within N3P 8 22 552 044.67 2 819 005.60 4.24 ,0.0001
Total 104 69 092 659.79 664 352.50
C50.3612, P50.136 a
Two way nested orthogonal analyses of variance were used. Treatments were presence or absence of nitrogen and presence or absence of phosphorus with microatoll number nested within the treatment interaction.
A regular pattern was not obvious for the testes total of the transplants and parental colonies. In November 1993, only the nitrogen plus phosphorus corals had a
sig-nificantly lower testes total than that of the parental colonies (ANOVA df5149,
F513.3297, P50.0004). In November 1994 and 1995 the phosphorus transplant
colonies had significantly greater testes totals than those of the parental colonies and this
reflects the treatment differences (Fig. 11) (ANOVA 1994: df5147, F511.4736,
P50.0009. 1995: df5144, F556.53, P,0.0001). The control transplant colonies had
smaller testes than their parental colonies in November 1994 (ANOVA df5130,
F54.5246, P50.0353) but larger testes in November 1995 (ANOVA df5145, F5
6.8142, P50.0100).
3.5. Acropora aspera transplants
Table 7
Comparison of the number of eggs, the size of eggs, the egg total (egg number3egg size) and the testes total a of the Acropora longicyathus transplants in the experimental microatolls at One Tree Reef in November 1995
df SS MS F P
Egg number
Nitrogen 1 659.06 659.06 20.52 ,0.0001
Phosphorus 1 740.17 740.17 23.05 ,0.0001
Nit. by phos. 1 614.12 614.12 19.12 ,0.0001
Microatoll within N3P 8 1235.68 154.46 4.81 ,0.0001
Total 288 9267.30 32.12
C50.3107, P50.214 Egg size
Nitrogen 1 92.36 92.36 9.37 0.002
Phosphorus 1 33.37 33.37 3.39 0.067
Nit. by phos. 1 6.62 6.62 0.67 0.413
Microatoll within N3P 8 387.90 48.49 4.92 ,0.0001
Total 288 2837.63 9.85
C50.3143, P50.177 Egg total
Nitrogen 1 1.99 1.99 7.61 0.006
Phosphorus 1 2.92 2.92 11.16 0.001
Nit. by phos. 1 0.35 0.35 1.35 0.246
Microatoll within N3P 8 9.50 1.19 4.54 ,0.0001
Total 288 75.29 0.26
C50.3741, P50.003 Testes total
Nitrogen 1 76 001 109.80 76 001 110.00 68.72 ,0.0001
Phosphorus 1 5 824 819.61 5 824 819.61 5.27 0.022
Nit. by phos. 1 10 137 923.17 10 137 923.00 9.17 0.003
Microatoll within N3P 8 78 731 422.54 9 841 427.86 8.90 ,0.0001
Total 288 318 508 158.3 1 105 931.10
C50.2924, P50.526 a
Two way nested orthogonal analyses of variance were used. Treatments were presence or absence of nitrogen and presence or absence of phosphorus with microatoll number nested within the treatment interaction. Data were log(x11) transformed due to heterogeneity of variances. C denotes the Cochran’s test value.
sample branches. This was due to colonies having either no gametes in the particular branch which was sampled or having no gametes in the entire colony. Due to this lack of gametes in some of the November 1993 and particularly 1994 samples, the sample sizes were smaller than for the other dates. The mean number of eggs per polyp in the A.
S. Ward, P. Harrison / J. Exp. Mar. Biol. Ecol. 246 (2000) 179 –221 199
Fig. 8. The number of eggs present in the colonies of Acropora longicyathus transplanted to the experimental microatolls at One Tree Reef. These are represented by the blank bars. The shaded bars represent the number of eggs present in the parental colonies of the transplants which have remained in the lagoon at One Tree Reef. Error bars are standard errors.
Fig. 9. The size of eggs (mm) present in the colonies of Acropora longicyathus transplanted to the experimental microatolls at One Tree Reef. These are represented by the blank bars. The shaded bars represent the number of eggs present in the parental colonies of the transplants which have remained in the lagoon at One Tree Reef. Error bars are standard errors.
were bigger than those from 1994 or 1995 (Fig. 13). The mean egg size for all A. aspera
transplants for November 1993 was 425mm compared with 321mm in November 1995.
S. Ward, P. Harrison / J. Exp. Mar. Biol. Ecol. 246 (2000) 179 –221 201
Fig. 10. The egg total (egg size3egg number) present in the colonies of Acropora longicyathus transplanted to the experimental microatolls at One Tree Reef. These are represented by the blank bars. The shaded bars represent the number of eggs present in the parental colonies of the transplants which have remained in the lagoon at One Tree Reef. Error bars are standard errors.
significantly fewer eggs per polyp were found in the nitrogen plus phosphorus treatment than in other treatments in November 1994 (Table 8, Fig. 12). In October 1994, November 1994 and November 1995 there were significantly more eggs per polyp in the phosphorus alone treatment than in the other treatments (Fig. 12).
Fig. 11. The testes total present in the colonies of Acropora longicyathus transplanted to the experimental microatolls at One Tree Reef. These are represented by the blank bars. The shaded bars represent the number of eggs present in the parental colonies of the transplants which have remained in the lagoon at One Tree Reef. Error bars are standard errors.
the non-nitrogen treatments and in the phosphorus than in the non-phosphorus treatments (Table 9, Fig. 13). In November 1994 the eggs were larger in the nitrogen plus phosphorus treatments than the other treatments.
S. Ward, P. Harrison / J. Exp. Mar. Biol. Ecol. 246 (2000) 179 –221 203
Fig. 12. The mean number of eggs present in polyps from colonies of Acropora aspera which were transplanted into the experimental microatolls at One Tree Reef, during the period from November 1993 to November 1995. Error bars are standard errors.
the phosphorus only microatolls compared with the other treatments in October 1994, November 1994 and November 1995 (Tables 8–10; Fig. 14).
Fig. 13. The mean size of eggs (mm) present in polyps from colonies of Acropora aspera which were transplanted into the experimental microatolls at One Tree Reef, during the period from November 1993 to November 1995. Error bars are standard errors.
S. Ward, P. Harrison / J. Exp. Mar. Biol. Ecol. 246 (2000) 179 –221 205
Fig. 14. The mean egg total (egg number3egg size) present in polyps from colonies of Acropora aspera which were transplanted into the experimental microatolls at One Tree Reef, during the period from November 1993 to November 1995. Error bars are standard errors.
Fig. 15. The mean testes total present in polyps from colonies of Acropora aspera which were transplanted into the experimental microatolls at One Tree Reef, during the period from November 1993 to November 1995. Error bars are standard errors.
3.6. Acropora aspera occurring naturally in the microatolls
S. Ward, P. Harrison / J. Exp. Mar. Biol. Ecol. 246 (2000) 179 –221 207 Table 8
Comparison of the number of eggs, the size of eggs, the egg total (egg number3egg size) and the testes total a of the Acropora aspera transplants in the experimental microatolls at One Tree Reef in November 1993
df SS MS F P
Egg number
Nitrogen 1 0.09 0.09 0.02 0.885
Phosphorus 1 15.01 15.01 3.45 0.065
Nit. by phos. 1 29.85 29.85 6.86 0.010
Microatoll within N3P 8 79.80 9.98 2.29 0.024
Total 156 678.32 4.35
C50.3127, P50.395 Egg size
Nitrogen 1 0.00 0.00 0.75 0.386
Phosphorus 1 0.00 0.00 0.88 0.351
Nit. by phos. 1 0.00 0.00 1.43 0.233
Microatoll within N3P 8 0.01 0.00 1.56 0.139
Total 178 0.17 0.00
C50.4118, P,0.0001 Egg total
Nitrogen 1 107.01 107.01 0.10 0.748
Phosphorus 1 3181.75 3181.75 3.07 0.081
Nit. by phos. 1 6596.57 6596.57 6.37 0.013
Microatoll within N3P 8 18 964.78 2370.60 2.29 0.024
Total 156 161 438.32 1034.86
C50.3296, P50.285 Testes total
Nitrogen 1 0.41 0.43 1.35 0.247
Phosphorus 1 0.38 0.38 1.23 0.269
Nit. by phos. 1 0.48 0.48 1.57 0.212
Microatoll within N3P 8 4.06 0.51 1.67 0.112
Total 135 41.11 0.30
C50.36475, P50.019 a
Two way nested orthogonal analyses of variance were used. Treatments were presence or absence of nitrogen and presence or absence of phosphorus with microatoll number nested within the treatment interaction. Data were log(x11) transformed due to heterogeneity of variances. C denotes the Cochran’s test value.
Acropora aspera occurring naturally in the microatolls was greater in the controls in
Table 9
Comparison of the number of eggs, the size of eggs, the egg total (egg number3egg size) and the testes total a of the Acropora aspera transplants in the experimental microatolls at One Tree Reef in October 1994
df SS MS F P
Egg number
Nitrogen 1 1.54 1.54 12.95 ,0.0001
Phosphorus 1 0.60 0.60 5.02 0.026
Nit. by phos. 1 3.55 3.55 29.82 ,0.0001
Microatoll within N3P 8 6.96 0.87 7.30 ,0.0001
Total 282 33.59 0.12
C50.4313, P,0.0001 Egg size
Nitrogen 1 0.00 0.00 0.91 0.343
Phosphorus 1 0.01 0.01 4.66 0.034
Nit. by phos. 1 0.00 0.00 0.38 0.541
Microatoll within N3P 7 0.05 0.01 5.20 ,0.0001
Total 85 0.11 0.00
C50.4456, P50.011 Egg total
Nitrogen 1 6.66 6.66 12.08 0.001
Phosphorus 1 2.04 2.04 3.69 0.056
Nit. by phos. 1 15.04 15.04 27.29 ,0.0001
Microatoll within N3P 8 31.36 3.92 7.11 ,0.0001
Total 282 155.45 0.55
C50.4267, P,0.0001 Testes total
Nitrogen 1 18.93 18.93 15.72 ,0.0001
Phosphorus 1 2.74 2.74 2.28 0.132
Nit. by phos. 1 41.40 41.40 34.38 ,0.0001
Microatoll within N3P 8 75.06 9.38 7.79 ,0.0001
Total 282 339.53 1.20
C50.0.4375, P,0.0001 a
Two way nested orthogonal analyses of variance were used. Treatments were presence or absence of nitrogen and presence or absence of phosphorus with microatoll number nested within the treatment interaction. Data were log(x11) transformed due to heterogeneity of variances. C denotes the Cochran’s test value.
S. Ward, P. Harrison / J. Exp. Mar. Biol. Ecol. 246 (2000) 179 –221 209 Table 10
Comparison of the number of eggs, the size of eggs, the egg total (egg number3egg size) and the testes total a of the Acropora aspera transplants in the experimental microatolls at One Tree Reef in November 1994
df SS MS F P
Egg number
Nitrogen 1 1.68 1.68 15.49 ,0.0001
Phosphorus 1 0.25 0.25 2.29 0.132
Nit. by phos. 1 7.13 7.13 65.77 ,0.0001
Microatoll within N3P 7 5.37 0.77 7.07 ,0.0001
Total 205 22.22 0.11
C50.4044, P50.002 Egg size
Nitrogen 1 0.02 0.02 5.38 0.023
Phosphorus 1 0.03 0.03 10.74 0.002
Nit. by phos. 1 0.02 0.02 8.33 0.005
Microatoll within N3P 4 0.03 0.01 3.05 0.021
Total 84 0.24 0.00
C50.4315, P50.022 Egg total
Nitrogen 1 7.44 7.44 13.17 ,0.0001
Phosphorus 1 0.93 0.93 1.65 ,0.0001
Nit. by phos. 1 35.91 35.91 63.53 ,0.0001
Microatoll within N3P 7 27.67 3.95 6.99 ,0.0001
Total 205 115.88 0.57
C50.3802, P50.008 Testes total
Nitrogen 1 12.86 12.86 9.55 0.002
Phosphorus 1 1.25 1.25 0.93 0.336
Nit. by phos. 1 78.66 78.66 58.39 ,0.0001
Microatoll within N3P 7 59.86 8.55 6.35 ,0.0001
Total 205 276.14 1.35
C50.3898, P50.004 a
Two way nested orthogonal analyses of variance were used. Treatments were presence or absence of nitrogen and presence or absence of phosphorus with microatoll number nested within the treatment interaction. Data were log(x11) transformed due to heterogeneity of variances. C denotes the Cochran’s test value.
significantly fewer eggs in the nitrogen treatments (nitrogen and nitrogen plus phosphor-us) than in the non-nitrogen treatments.
Table 11
Comparison of the number of eggs, the size of eggs, the egg total (egg number3egg size) and the testes total of the Acropora aspera growing naturally in the experimental microatolls at One Tree Reef in November
a 1994
df SS MS F P
Egg number
Nitrogen 1 412.09 412.09 20.81 ,0.0001
Phosphorus 1 111.57 111.57 5.64 0.021
Nit. by phos. 1 3.18 3.18 0.16 0.690
Total 53 1049.34 19.80
C50.4244, P50.112 Egg size
Nitrogen 1 4.60 4.60 3.19 0.085
Phosphorus 1 27.42 27.42 18.98 ,0.0001
Nit. by phos. 1 3.13 3.13 2.17 0.152
Total 28 40.44 1.44
C50.3345, P50.134 Egg total
Nitrogen 1 69 194.20 69194.20 16.02 ,0.0001
Phosphorus 1 9925.28 9925.28 2.30 0.136
Nit. by phos. 1 157.40 157.40 0.04 0.849
Total 53 228 984.04 4320.45
C50.4314, P50.095 Testes total
Nitrogen 1 25.65 25.65 15.87 ,0.0001
Phosphorus 1 9.46 9.46 5.85 0.019
Nit. by phos. 1 0.26 0.26 0.16 0.687
Total 51 82.43 1.62
C50.5324, P50.006 a
Two way nested orthogonal analyses of variance were used. Treatments were presence or absence of nitrogen and presence or absence of phosphorus. Data were log(x11) transformed due to heterogeneity of variances. C denotes the Cochran’s test value.
Fig. 17). In contrast, in November 1995 the eggs were smaller in all nutrient treatments compared with the controls (Table 12, Fig. 17).
S. Ward, P. Harrison / J. Exp. Mar. Biol. Ecol. 246 (2000) 179 –221 211 Table 12
Comparison of the number of eggs, the size of eggs, the egg total (egg number3egg size) and the testes total of the Acropora aspera growing naturally in the experimental microatolls at One Tree Reef in November
a 1995
df SS MS F P
Egg number
Nitrogen 1 4.14 4.14 60.90 ,0.0001
Phosphorus 1 2.60 2.60 38.34 ,0.0001
Nit. by phos. 1 2.01 2.01 29.61 ,0.0001
Total 81 5.50 0.07
C50.4787, P50.005 Egg size
Nitrogen 1 0.00 0.00 0.73 0.396
Phosphorus 1 0.00 0.00 0.01 0.935
Nit. by phos. 1 0.00 0.00 0.30 0.584
Total 61 0.09 0.00
C50.4856, P50.0.014 Egg total
Nitrogen 1 14.10 14.10 59.24 ,0.0001
Phosphorus 1 11.23 11.23 47.17 ,0.0001
Nit by phos 1 9.95 9.95 41.78 ,0.0001
Total 81 19.28 0.24
C50.4796, P50.005 Testes total
Nitrogen 1 5 226 820.4 5 226 820.7 36.05 ,0.0001
Phosphorus 1 2 624 680.2 2 624 680.2 18.10 ,0.0001
Nit. by phos. 1 2 978 954.2 2 978 954.2 20.55 ,0.0001
Total 81 11 744 574.2 144 994.7
C50.5324, P50.006 a
Two way nested orthogonal analyses of variance were used. Treatments were presence or absence of nitrogen and presence or absence of phosphorus. Data were log(x11) transformed due to heterogeneity of variances. C denotes the Cochran’s test value.
Fig. 16. The mean number of eggs present in the polyps of colonies of Acropora aspera occurring naturally in the experimental microatolls. Error bars are standard errors.
4. Discussion
S. Ward, P. Harrison / J. Exp. Mar. Biol. Ecol. 246 (2000) 179 –221 213
Fig. 17. The mean size of eggs (mm) present in polyps of the colonies of Acropora aspera occurring naturally in the experimental microatolls. Error bars are standard errors.
during gametogenesis is due to resorption of developing oocytes, which may provide nutrients for the remaining oocytes (Harrison and Wallace, 1990). In contrast, the mean oocyte number per polyp was not reduced during the gametogenic cycle in the phosphorus only transplants. It is possible that the resorbed oocytes may provide a source of phosphorus for the remaining oocytes, and that in the case of the phosphorus transplants, oocyte resorption may not have been required because the colonies were receiving sufficient additional phosphorus experimentally.
The absence of oocyte resorption in the phosphorus treatments meant that the mean number of eggs present in polyps just prior to spawning was similar to the number of oocytes present early in the cycle. This resulted in the phosphorus treated transplants having significantly higher egg numbers than the other transplants prior to spawning. However, the eggs of the phosphorus transplants were generally smaller than those of the control colonies, hence phosphorus transplants had more, but smaller eggs.
Fig. 18. The mean egg total (egg number3egg size) present in polyps of the colonies of Acropora aspera occurring naturally in the experimental microatolls. Error bars are standard errors.
treatment compared with the other treatments, hence the phosphorus only treatment was increasing gametic output. In contrast, the nitrogen treatments resulted in a net reduction in gametic output as the egg size was generally smaller in these corals than in the non-nitrogen treatments. The egg number, egg total and testes total were also frequently reduced in the nitrogen and nitrogen plus phosphorus colonies, which suggests that these elevated nutrient treatments were sublethally stressing the corals.
In this study a number of aspects of fecundity were measured as it was difficult to predict which aspect would be sensitive to nutrient enrichment. Phosphorus caused both an enhancement and reduction in fecundity measures, with elevated total testes and egg numbers, but reduced egg sizes. It would be very informative to do fertilization trials using gametes from colonies that had been exposed to elevated levels of nutrients during gametogenesis, as this would provide a measure of their viability. Resulting larvae could then be used for settlement trials.
S. Ward, P. Harrison / J. Exp. Mar. Biol. Ecol. 246 (2000) 179 –221 215
Fig. 19. The mean testes total present in polyps of the colonies of Acropora aspera occurring naturally in the experimental microatolls. Error bars are standard errors.
research on echinoderms that reproductive output differs in relation to food availability (Emlet et al., 1987) and that inadequate diets adversely affect maternal fecundity, fertilization rates of eggs, and larval viability (Grahame and Branch, 1985). George (1990) compared reproduction in urchins from two areas that had different food sources. Urchins from one area produced eggs with higher lipid and protein content than the other, and these eggs resulted in larvae that grew faster and had greater survival rates than those from the urchins with a different diet.
Table 13
Summary of significant results presented in this paper
Corals Date Parameter Significant differences June 1994 Egg number NIT,NO NIT
Egg size PHOS.NO PHOS
Egg total NIT,NO NIT, P.C, N, NP Nov 1994 Egg number P.C, N, NP
Egg size NIT,NO NIT, PHOS,NO PHOS Egg total PHOS.NO PHOS
Testes total P.C, N, NP NP,C, N, P
Feb 95 Ns
May 95 Ns
Aug 95 Egg number P.C, N, NP
Egg size PHOS.NO PHOS, N,P, NP, C Egg total PHOS.NO PHOS
Nov 95 Egg number PHOS.NO PHOS
Egg size NIT,NO NIT Testes total NIT,NO NIT
A. aspera
in microatolls Nov 94 Egg number NIT,NO NIT, PHOS,NO PHOS
S. Ward, P. Harrison / J. Exp. Mar. Biol. Ecol. 246 (2000) 179 –221 217
that egg size is not a reliable predictor of the organic content of eggs, and differences in egg size do not reliably reflect differences in parental investment for starfishes.
The reduction in egg number, egg size and testes total in corals subjected to nutrient treatments at One Tree Reef would suggest a smaller resource investment, in this case due to a sublethal stressor. Some other studies have shown that corals have reduced reproductive output in response to pollutants or other stressors. Tomascik and Sander (1987) compared the reproductive activities of populations of the gonochoric brooding coral Porites porites at three reefs along a gradient of eutrophication and other pollution in Barbados, West Indies. The gametogenic cycles, which usually occur for 9–10 months of the year, commenced 1–2 months earlier in the polluted areas compared with the non-polluted areas, and there were lower numbers of larvae produced at the polluted reef areas. A 2:1 sex ratio of males to females (a shift to males) was observed at a polluted reef, which may have been due to the onset of rapid fragmentation. In addition, 2.7% of colonies sampled at a polluted areas were hermaphroditic rather than gonochoric (Tomascik and Sander, 1987). Glynn et al. (1994) noted that 14% of a population of the gonochoric broadcast spawner Porites lobata were hermaphroditic at one of their study sites (Cano Island) in the Caribbean, but the reason for this was not clear. During this study, in October and November 1993, shortly after nutrient dosing had commenced, some colonies of Acropora longicyathus were recorded with testes and no eggs, and in many cases the matching parental colony also had only testes. Most of these colonies developed eggs and testes the following year. Similarly, although many of the A. aspera transplants used in this study at One Tree Reef did not contain gametes or had branches that did not contain gametes, this did not appear to be related to nutrients as this also occurred amongst the control colonies.
Oil pollution also adversely affects sexual reproduction in corals (Harrison and Wallace, 1990). Rinkevich and Loya (1977) found that the fecundity of colonies of the brooding coral Stylophora pistillata was four times greater on an unpolluted reef compared with colonies on a reef subjected to chronic oil pollution near Eilat. They also found that there were fewer breeding colonies of S. pistillata, fewer ovaries and planulae per polyp, and a marked reduction in the reproductive index of corals on the polluted reef compared with the control reef. Chronic exposure to sublethal concentrations of crude oil resulted in a significant reduction in the number of ovaries in S. pistillata (Rinkevich and Loya, 1979) and induced premature abortion of planulae and eggs (Loya and Rinkevich, 1979). Five years after the Galeta oil spill near Panama, Guzman and Holst (1993) found that corals from the oiled reefs had smaller gonads than those from unaffected areas, whereas the number of reproductive colonies and the number of gonads per polyp was not affected by exposure to oil.
reduction in the number of eggs per polyp and the number of gonads per polyp in areas adjacent to lesions. Dislodgement caused a reduction in reproduction in Pocillopora
damicornis (Ward, 1995). Fragmentation of Goniastrea favulus colonies six months
prior to spawning reduced fecundity compared with colonies that had been separated for two years (Kojis and Quinn, 1981), and frequent fragmentation or partial colony mortality may severely reduce the reproductive output of corals (Szmant-Froelich, 1985). Planula production in Pocillopora damicornis at Hawaii was reduced in response to lowered salinity, low tides, high sea temperatures, and reduced ultraviolet light (Jokiel and York, 1982, Jokiel, 1985), and intraspecific competition reduced fecundity in
Stylophora pistillata (Rinkevich and Loya, 1985).
Thus, measures of fecundity in corals can provide a reliable and sensitive method for assessing the health of a coral population, especially in combination with the measure-ment of other reproductive parameters such as testes total, fertilization success and larval viability. The results of this study show that slight elevations in nutrient levels during gametogenesis can significantly alter reproductive output in acroporid reef corals. Elevated nitrogen has a detrimental effect on reproductive output causing a reduction in both egg and testes production. These results suggest that if a reef has elevated levels of nitrogen, acroporid corals will produce fewer and smaller eggs. In contrast, elevated levels of phosphorus caused an increase in testes total and the production of more but smaller eggs. Further work is needed to examine the fertilization rates, embryo development and settlement competency of coral larvae developing from gametes exposed to elevated levels of nutrients during their development. Although existing corals may continue to grow and survive in areas with elevated nutrient levels, it is essential to maintain water quality on coral reefs within ecologically appropriate limits, to ensure successful reproduction of corals and provide recruits for the long-term
maintenance and renewal of coral populations. [SS]
References
Atkinson, M.J., Carlson, B., Crow, G.L., 1995. Coral growth in high-nutrient, low-pH seawater: a case study of corals cultured at the Waikiki Aquarium, Honolulu, Hawaii. Coral Reefs 14, 215–223.
Banner, A.H., 1974. Kaneohe Bay, Hawaii: urban pollution and a coral reef ecosystem. In: Proc. Second Int. Symp. Coral Reefs, Brisbane, Vol. 2, pp. 685–702.
Babcock, R.C., Willis, B.L., Harrison, P.L., Heyward, A.J., Oliver, J.K., Wallace, C.C., Willis, B.L., 1986. Synchronous spawnings of 105 scleractinian coral species on the Great Barrier Reef. Mar. Biol. 90, 379–394.
Begon, M., Harper, J., Townsend, C.R., 1986. Ecology: Individuals, Populations and Communities, Blackwell Scientific, Oxford.
Bell, P.R.F., 1992a. Small scale and large scale eutrophication of coral reef regions – examples in the Great Barrier Reef (GBR) and Caribbean. In: Proceedings of the 7th International Coral Reef Symposium, Guam, Vol. 1, p. 345.
Bell, P.R.F., 1992b. Eutrophication and coral reefs – some examples from the Great Barrier Reef lagoon. Wat. Res. 26, 553–568.
S. Ward, P. Harrison / J. Exp. Mar. Biol. Ecol. 246 (2000) 179 –221 219 Byron, G., Brodie, J., 1992. Catchment management for marine ecosystems: Where does the Fitzroy River
system finish? Fitzroy Catchment Symposium, University of Central Queensland, Rockhampton. Darwin, C., 1842. The Structure and Distribution of Coral Reefs, Smith, Elder and Company, London. D’Elia, C.F., Wiebe, W.J., 1990. Biochemical nutrient cycles in coral reef ecosystems. In: Dubinsky, Z. (Ed.),
Coral Reef Ecosystems, Ecosystems of the World, Vol. 25, Elsevier, pp. 49–70. Doty, M., 1969. The Ecology of Honaunau Bay, Hawaii, University of Hawaii, Hawaii.
Dubinsky, Z., Jokiel, P.L., 1994. Ratio of energy and nutrient fluxes regulates symbiosis between zooxanthellae and corals. Pac. Sci. 48, 313–324.
Emlet, R., McEdward, L.R., Strathmann, R.R., 1987. Echinoderm larval ecology viewed from the egg. Echinoderm Studies 2, 55–136.
Fadlallah, Y., 1983. Sexual reproduction, development and larval biolgy in scleractinian corals. A review. Coral Reefs 2, 129–150.
George, S.B., 1990. Population and seasonal differences in egg quality of Arbacia lixula (Echinodermata: Echinoidea). Invertebrate Reprod. Dev. 17, 111–121.
George, S.B., Lawrence, J.M., Fenaux, L., 1991. The effect of food ration on the quality of eggs of Luida clathrata (say) (Echinodermata:Asteroidea). Invertebrate Reprod. Dev. 20, 237–242.
Giese, A., Pearse, J., 1974. Introduction: General principles. In: Giese, A., Pearse, J. (Eds.), Reproduction of Marine Invertebrates, Vol. 1, Academic Press, New York, pp. 1–49.
Glynn, P.W., Colley, S.B., Eakin, C.M., Smith, D.B., Cortes, J., Gassman, N.J., Guzman, H.M., Del Rosario, J.B., Feingold, J.S., 1994. Reef coral reproduction in the eastern Pacific: Costa Rica Panama, and Galapagos Islands (Ecuador) II. Poritidae. Mar. Biol. 118, 191–208.
Grahame, J., Branch, G., 1985. Reproductive patterns of marine invertebrates. Oceanogr. Mar. Biol. Ann. Rev. 23, 373–398.
Grigg, R.W., 1995. Coral reefs in an urban embayment in Hawaii: a complex case history controlled by natural and anthropogenic stress. Coral Reefs 14, 253–266.
Guzman, H., Holst, I., 1993. Effects of chronic oil-sediment pollution on the reproduction of the Caribbean reef coral Siderastrea siderea. Mar. Pollut. Bull. 26, 276–282.
Harrison, P.L., Wallace, C.C., 1990. Reproduction, dispersal and recruitment of scleractinian corals. In: Dubinsky, Z. (Ed.), Coral Reefs. Ecosystems of the World, Vol. 25, pp. 133–207.
Harrison, P., Babcock, R.C., Bull, G.D., Oliver, J.K., Wallace, C.C., Willis, B.L., 1984. Mass spawning of tropical reef corals. Science 223, 1186–1189.
Hatcher, A.I., Frith, C.A., 1985. The control of nitrate and ammonium concentrations in a coral reef lagoon. Coral Reefs 4, 101–110.
Heatwole, H., 1981. A Coral Island – The Story of One Tree Reef, William Collins Pty Ltd, Sydney. Hunte, Wittenberg, 1992. Effects of eutrophication and sedimentation on juvenile corals. II. Settlement. Marine
Biology 114, 625–631.
Jokiel, P., 1985. Lunar periodicity of planula release in the reef coral Pocillopora damicornis in relation to various environmental factors. In: Proceedings of the 5th International Coral Reef Congress, Tahiti, Vol. 4, pp. 307–312.
Jokiel, P., York, R.J., 1982. Solar ultraviolet photobiology of the reef coral Pocillopora damicornis and symbiotic zooxanthellae. Bull. Mar. Sci. 32, 31–315.
Kinsey, D., 1979. Carbon turnover and accumulation by coral reefs. PhD thesis, University of Hawaii, Honolulu.
Kinsey, D.W., 1988. Responses of coral reef systems to elevated nutrient levels. In: Proceedings of Workshop Nutrients in the Great Barrier Reef Region, C. Baldwin, pp. 55–60.
Kinsey, D., Davies, P., 1979. Effects of elevated nitrogen and phosphorus levels on coral reef growth. Limnol. Oceanogr. 24, 935–940.
Kojis, B.L., Quinn, N.J., 1981. Aspects of sexual reproduction and larval development inthe shallow water hermatypic coral Goniastrea australiensis (Edwards and Haime 1857). Bull. Mar. Sci. 31, 558–573. Kojis, B., Quinn, N., 1984. Seasonal and depth variation in fecundity of Acropora palifera at two reefs in
Papua New Guinea. Coral Reefs 3, 165–172.
Larkum, A.W.D., Steven, A.D.L., 1994. ENCORE: The effect of nutrient enrichment on coral reefs. 1. Experimental design and research programme. Mar. Pollut. Bull. 29, 112–120.
Loya, Y., Rinkevich, B., 1979. Abortion effect in corals induced by oil pollution. Mar. Ecol. Prog. Ser. 1, 77–80.
Marszalek, D., 1981. In: Proceedings of the 4th International Coral Reef Symposium, Manila, Vol. 1, p. 213. McEdward, L., Carson, F., 1987. Variation in egg organic content and its relationship with egg size in the
starfish Solaster stimpsoni. Mar. Ecol. Prog. Ser. 37, 159–169.
Naim, O., 1993. Seasonal responses of a fringing reef community to eutrophication (Reunion Island Western Indian Ocean). Mar. Ecol. Prog. Ser. 99, 137–151.
Odum, H., Odum, E., 1955. Trophic structure and productivity of a windward coral reef community on Eniwetok Atoll. Ecol. Monogr. 25, 291–320.
Oliver, J., 1979. In: Temporal and Spatial Variations in the Growth of acropora Formosa (dana 1846) On A North Queensland Fringing Reef, Marine Biology Department, Townsville, James Cook University, p. 90. Pastorok, R.A., Bilyard, G.R., 1985. Effects of sewage pollution on coral-reef communities. Mar. Ecol. Prog.
Ser. 21, 175–189.
Rinkevich, B., Loya, Y., 1977. Harmful effects of chronic oil pollution on a Red Sea coral population. In: Proceedings of the 3rd International Coral Reef Symposium, Miami, Vol. 2, pp. 586–591.
Rinkevich, B., Loya, Y., 1979. The reproduction of the Red Sea coral Stylophora pistillata I. Gonads and planulae. Mar. Ecol. Prog. Ser. 1, 133–144.
Rinkevich, B., Loya, Y., 1985. Intraspecific competition in a reef coral: effects on growth and reproduction. Oecologia 66, 100–105.
Schaffelke, B., Klumpp, D.W., 1998. Short-term nutrient pulses enhance growth and photosynthesis of the reef macroalga Sargassum baccularia. Mar. Ecol. Prog. Ser. 170, 95–105.
Smith, S.V., Kimmerer, J., Laws, E.A., Brock, R.E., Walsh, T.W., 1981. Kaneohe Bay sewage diversion experiment: perspectives on ecosystem responses to nutritional perturbation. Pacific Sci. 35, 279–402. Steven, A., Larkum, T., 1993. ENCORE: The effect of nutrient enrichment on coral reefs. Search 24, 216–219. Stimson, J.S., 1976. Reproduction of some common Hawaiian reef corals. In: Mackie, G. (Ed.), Coelenterate
Ecology and Behaviour, Plenum Press, pp. 271–279.
Stoddart, J., Black, R., 1985. Cycles of gametogenesis and planulation in the coral Pocillopora damicornis. Mar. Ecol. Prog. Ser. 23, 153–164.
Szmant-Froelich, A., 1985. The effect of colony size on the reproductive ability of the Caribbean coral Montastrea annularis (Ellis and Solander). In: Proc. Fifth Int. Coral Reef Congress, Tahiti, Vol. 4, pp. 295–300.
Thompson, R., 1982. The relationship between food ration and reproductive effort in the green sea urchin, Strongylocentrotus droebachiensis. Oecologia 56, 667–676.
Tomascik, T., 1991. Settlement patterns of Caribbean scleractinian corals on artificial substrata along a eutrophication gradient Barbados, West Indies. Mar. Ecol. Prog. Ser. 77, 261–269.
Tomascik, T., Sander, F., 1985. Effects of eutrophication on reef-building corals. 1. Growth rate of the reef-building coral Montastrea annularis. Mar. Biol. 87, 143–155.
Tomascik, T., Sander, F., 1987. Effects of eutrophication on reef-building corals. III. Reproduction of the reef-building coral Porites porites. Mar. Biol. 94, 77–94.
Underwood, A.J., 1981. Techniques of analysis of variance in experimental marine biology and ecology. Oceanogr. Mar. Biol. Ann. Rev. 19, 513–605.
Vance, R., 1973. On reproductive strategies in marine benthic invertebrates. The American Naturalist 107, 339–352.
Van Veghel, M.L.J., Bak, R.M., 1994. Reproductive characteristics of the polymorphic Caribbean reef building coral Montastrea annularis. III Reproduction in damaged and regenerating colonies. Mar. Ecol. Prog. Ser. 109, 229–233.
Walker, D.I., Ormond, R.F.G., 1982. Coral death from sewage and phosphate pollution at Aqaba Red Sea. Mar. Pollut. Bull. 13, 21–25.
Wallace, C., 1985. Reproduction, recruitment and fragmentation in nine sympatric species of the coral genus Acropora. Mar. Biol. 88, 217–233.
S. Ward, P. Harrison / J. Exp. Mar. Biol. Ecol. 246 (2000) 179 –221 221 Webb, A., 1984. Consequences of agricultural land use in the Brigalow belt. The Royal Society of Queensland
Symposium.
Willis, B., 1987. In: Morphological variation in the reef corals Turbinaria mesenterina and Pavona cactus: synthesis of transplant, histocompatability, Electrophoresis, growth and reproductive studies, Marine Biology Department, Townsville, James Cook University, p. 202.