COMPARISON OF STATISTICAL MODELS FOR DETERMINATION OF RICE
FIELD PHOSPHORUS CRITICAL LEVEL
Mohammad Masjkur1, Bagus Sartono1, and Itasia Dina Sulvianti1
1Department of Statistics, Bogor Agricultural University
Bogor, Indonesia
Abstract
The method used in the determination of rice field phosphorus nutrient availability classes is a graphical method of Cate and Nelson (1965) and a modified analysis of variance model (Nelson and Anderson, 1977). On the other hand, there are other models commonly used by researchers in determining the nutrients critical levels that are linear plateau, quadratic, and logarithmic models. Different models could produce different nutrient critical levels and economic benefits. This study aims to determine the best model for determination of rice field phosphorus critical level. The research using multilocation experimental data of P fertilization on rice in Java, Sumatera and Lombok. Each trial consisted of four to five levels of P fertilizer treatment. Measured response is dry grain weight (ku/ha). Soil properties measured was total P (25% HCl) nutrient content before the experiment. The design used was a randomized complete block design with three replications. Results showed that sequentially the AIC value of the models are Cate-Nelson <Linear (Ln-X) <Linear (X) <Linear-Plateau (X) = Quadratic (Ln-X) <Linear-<Linear-Plateau (Ln-X) <Quadratic (X). However, only the model of Linear-Plateau (Ln-X) was significant (P-value < 0.05), while the other models are not significant (P-values> 0.05). Thus the best model is the model of Linear-Plateau with the logarithmic transformation of independent variables X (Ln-X). Critical threshold of 25% HCl-P is obtained at 34 mg HCl-P2O5/100g.
Keywords: Cate-Nelson, linear plateau, quadratic, logarithmic, AIC.
1. INTRODUCTION
There are several approaches that can be used for the determination of phosphorus
and potassium fertilizer doses on paddy rice, which are P and K status maps, the paddy soil
test kit (PUTs), Phosphorus and Potassium Decision Support System (PKDSS), and the
omission plot fertilizer trials approach. These approaches are complementary each other
(Setyorini et al., 2003; Abdulrahman and Sembiring, 2006; Sulaiman, 2010).
Phosphorus and potassium status maps is based on the results of the multilocation
soil test field calibration using 25%-HCl extract on a scale of 1: 250,000 and 1:50,000.
1:250,000 scale map is useful for the planning and direction of the national distribution of
fertilizer in each province, while 1:50,000 scale maps useful for regional rice paddy fertilizer
Three categories of critical levels are used as a reference grouping soil test results
that illustrate the extent of the soil P supply, respectively : (1) low status if the test results
<20 mg P2O5, (2) medium if the test results are 20 - 40 mg P2O5, and (3) high status when the
test result > 40 mg P2O5 (Rochayati and Adiningsih, 2002; Setyorini et al., 2003).
The method used in the determination of nutrient availability classes is a graphical
method of Cate and Nelson (1965) and a modified analysis of variance model (Nelson and
Anderson, 1977; Setyorini et al., 2003). However, there are other models commonly used by
researchers in determining the nutrient critical level which are linear plateau, quadratic, and
logarithmic models (Saunders et al., 1987; Mallarino and Blackmer, 1992; Mallarino, 2003;
Hamel et al., 2006 ; Izhar, 2012). The results show that different models could produce
different nutrient critical levels and economic benefits.
This study aims to determine the best model for determination of rice field
phosphorus critical level.
2. METHODOLOGY
This study uses multilocation trials data P fertilization on rice in Java, Sumatera and
Lombok (Moersidi et al., 1990; Puslitanak, 1992, 1993; 1994). Each trial consisted of four to
five levels P fertilizer treatment. Measured response is dry grain weight (ku/ha). Soil
properties measured was the total P (25% HCl) nutrient content before the experiment. The
design used was a randomized complete block design with three replications.
Relative yield is defined as the average of the results of the plots that were not
fertilized as a percentage of the average results of the fertilized plots at each location.
Relative grain yield (dependent variable) associated with P nutrient content (independent
variable) was analyzed by some statistical models. Statistical models used are Cate-Nelson,
linear plateau, quadratic, and logarithmic. Critical nutrient level is determined at the 100
percent sufficiency level. Criteria used in the selection of the best model is the Akaike
Information Criterion (AIC).
3. RESULTS AND DISCUSSION
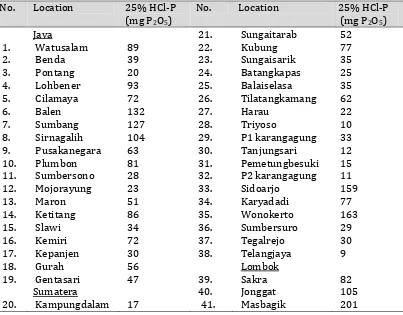
Total P content (25% HCl) before experiments ranged from 9-201 mg P2O5/100g.
Based on the assessment criteria for the chemical nature of soil (Soil Research Centre, 1983)
as many as 1 trial location was at very low P levels (<10 mg P2O5/100g), 6 locations at low P
levels (10-20 mg P2O5/100g) , 12 locations were medium levels (21-40 mg P2O5/100g), 4
locations were high P levels (41-60 mg P2O5/100g), and the 18 pilot sites is very high P levels
(> 60 mg P2O5/100g) (Table 1).
Table 1. Trial location and total-P content (25% HCl)
No. Location 25% HCl-P Pusakanegara Plumbon Kampungdalam
89 Tilatangkamang Harau
Triyoso
recommendation), and P4 (100% recommendation). P fertilizer recommendations differ
between various locations. P fertilization experiment in the Sumatera island, generally using
doses of P fertilizer with level of 0, 50, 100, 150 and 200 kg TSP/ha. The P fertilization
experiment on the Lombok island, and several locations on the Sumatera island use of
fertilizer P with level of 0, 50, 100, and 150 kg TSP/ha.
Rice grain yield in multilocation trials ranged between 17.67 - 88.2 ku/ha with an
average of 56.24 ku/ha. Lowest grain yield of rice is on site P1 Karangagung-South Sumatera,
while the highest grain yield is on site Kampungdalam, West Sumatera. Results of analysis of
variance of rice P fertilization at each location can be seen in Table 2. Significant phosphorus
fertilizer treatment on rice grain yield identified on 5 trials from 41 locations. This is likely
related to the soil P content of location that generally moderate to very high levels.
Linear correlation of relative grain yield with total-P (25% HCl) was - 0.010 (P-value
= 0948), while the linear correlation of relative crop yield with ln-total P was 0.044 (P-value
= 0.783) (Figure 1 and 2). This suggests that linear increasing of rice grain yield with
increasing total soil-P content was not significant.
Figure 2. Scatter diagram of relative yield and Ln-HCl P
3.2. Model Fitting
Examination of the data showed that the distribution was normal.
Kolmogorov-Smirnov statistic value was 0.092 with P-value = 0.200. Normal Q-Q plot shows straight line
pattern (Figure 3).
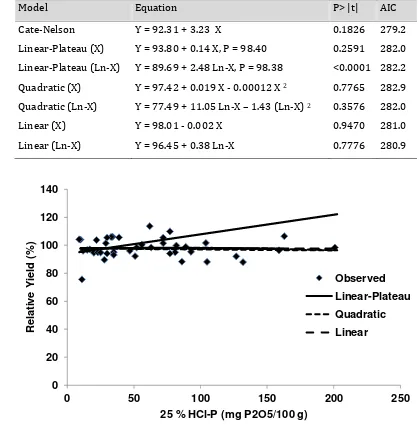
plateau (X) model, whereas quadratic (Ln-X) and linear (Ln-X) models are lower than
quadratic (X) and linear (X) models. Sequentially AIC value of the model is Cate-Nelson
<Linear (Ln-X) <Linear (X) <Linear-Plateau (X) = Quadratic (Ln-X) <Linear-Plateau (Ln-X)
<Quadratic (X). Cate-Nelson models have smaller AIC values than other models. However,
only the model of Linear-Plateau (Ln-X) were significant (P-values < 0.05), while the other
models are not significant (P-values > 0.05). Thus the determination of the critical threshold
of 25% HCl-P using the model of Linear-Plateau (Ln-X) only. Critical threshold of 25% HCl-P
is obtained at 34 mg P2O5 /100g.
Table 4. Statistical models for determining the critical threshold of 25% HCl P
Model Equation P> |t| AIC
Cate-Nelson
Linear-Plateau (X)
Linear-Plateau (Ln-X)
Quadratic (X)
Quadratic (Ln-X)
Linear (X)
Linear (Ln-X)
Y = 92.31 + 3.23 X
Y = 93.80 + 0.14 X, P = 98.40
Y = 89.69 + 2.48 Ln-X, P = 98.38
Y = 97.42 + 0.019 X - 0.00012 X 2
Y = 77.49 + 11.05 Ln-X – 1.43 (Ln-X) 2
Y = 98.01 - 0.002 X
Y = 96.45 + 0.38 Ln-X
0.1826
0.2591
<0.0001
0.7765
0.3576
0.9470
0.7776
279.2
282.0
282.2
282.9
282.0
281.0
280.9
Figure 4. Plot linear-plateau, quadratic, and linear models (X)
0 20 40 60 80 100 120 140
0 50 100 150 200 250
R
e
la
ti
v
e
Y
ie
ld
(%
)
25 % HCl-P (mg P2O5/100 g)
Observed
Linear-Plateau
Quadratic
Figure 5. Plot linear-plateau, quadratic, and linear models (Ln-X)
4. CONCLUSION
The best model for determination of rice field phosphorus critical level was
Linear-Plateau model with logarithmic transformation of the independent variables X.
5. REFERENCES
Rachman, S. and H. Sembiring. 2006. Determination of phosphate fertilizer doses for rice plant. Crop Sciences No. 1. Center for Rice Research.
Cate, Jr. R. B., and L. A. Nelson. 1971. A Simple Statistical Procedures for Soil Test Correlation Partitioning Data into Two Classes. Soil. Sci. Soc. Amer. Proc. 35:658-660.
Hamel, S. C., and J. C. Heckman. 2006. Predicting Need for Fertilizer Phosphorus by Soil Testing During Seeding of Cool Season Grasses. HortScience 41 (7): 1690-1697. Izhar, L. 2012. Development of soil testing to establish criteria for phosphorus and
potassium fertilizer recommendations on tomato plants. Graduate School. Bogor Agricultural University. Bogor.
Mallarino, A. P. 2003. Field Calibration for Corn of the Mehlich-3 Soil Test Phosphorus with Colorimetric and Inductively Coupled Plasma Emission Spectroscopy Determination Methods. Soil Sci. Soc. Pm. J. 68: 1928-1934.
Mallarino, A. P., and A. M. Blackmer. 1992. Comparison of Methods for Determining Critical Phosphorus Concentrations of Soil Test for Corn. Agron. J. 84: 850-856.
Moersidi S., J. Prawirasumantri, W. Hartatik, A. Pramudia, and M. Sudjadi. 1990. The second evaluation phosphate requirement of intensified rice fields in Java. Soil and Agro-climate Research Center. Bogor.
Nelson, L. A., and R. L. Anderson. , 1977. Partitioning of Soil Test Crop Response-Probability. Inclusive Soil Testing: Correlating and Interpreting the Analytical Results. ASA Special
0 20 40 60 80 100 120
0 1 2 3 4 5 6
R
e
la
ti
v
e
Y
ie
ld
(%
)
Ln-25 % HCl P (mg P2O5/100 g)
Observed
Quadratic
Linear-Plateau
Puslitanak. 1993. Research on P and K status and the response of rice to P and K fertilizer. AARD.
Puslittanak. 1994. Parameter Identification Research of P and K fertilizer requirements for intensified lowland in West Sumatera and South Sumatera. Research Report. Bogor. Rochayati S. and J. S. Adiningsih. 2002. Coaching and development program for P and K
nutrient soil test in paddy fields. Puslittannak. AARD.
Saunders, W. M. H., Sherrell C. G., and I. M. Gravett. 1987. Calibration of Olsen bicarbonate phosphorus soil test for pasture on some New Zealand soils. New Zealand Journal of Agricultural Research 30 (3): 387-394.
Setyorini D, Adiningsih J. S., Rochayati S. 2003. Soil Test as the Basis for Fertilizer Recommendations. Monograph Series 2: Land Resources of Indonesia. Bogor: Soil Research Institute. AARD.