Economic Benefits of Using SOI Phase Information for Crop Management
Decision in Rice-Base Farming System of West Java, Indonesia
Rizaldi Boer and Elza Surmaini
Laboratory of Climatology, Department of Geophysics and Meteorology, Faculty of Mathematics and Natural Sciences, Bogor Agricultural University
Kampus IPB Darmaga, Bogor 16680, Indonesia e-mail: [email protected]
Abstract
Variability of dry season rainfall in Indonesia is strongly influenced by the El-Nino-Southern
Oscillation (ENSO) phenomenon. In ENSO ‘warm event’ (El-Niño) years, for most cases the
dry season starts earlier and the rainfall amount is often substantially reduced. Under this condition most of second rice crops will suffer from drought. Based on historical rainfall data in the study areas, i.e. Ciparay and Bojongsoang sub-districts, when SOI phase prior to this season was constantly negative (phase 1) or rapidly falling (phase 3), the chance of having rainfall far below normal in this season would increase. Keeping planting rice in this season when rainfall far below normal would result in increasing production risk. Therefore, the use SOI phase information prior to the season would be useful for assisting farmers in making a satisfactory planting decision. The results of this study indicates that farmers who switch their crop to soybean or maize for May planting if April SOI Phase is 1 or 3 will get a higher income compared to farmers that keep planting rice. Cumulatively, over 24 years, the net income difference between farmers that use April SOI Phase information in deciding a crop type for May planting and those that do not is about 2000 USD at Ciparay and 2500 USD at Bojongsoang if they chose soybean as the second crops, and about 1000 and 1500 USD respectively if they chose maize. Farmers who choose not to plant a second crop will accrue a lower income than those that plant the crops. Furthermore, farmers who decide not to plant a second crop in April if March SOI Phase is 1 or 3 will get a much lower income compared to farmers who plant the second crops. This outcome suggests that the decision to planting or not to plant a second crop in May is more crucial than in April. Farmers who make what appears to be a proper decision for May planting based on April SOI Phase will, in the long term get consistently a much higher benefit than farmers who keep planting rice irrespective of the April SOI Phase.
1. Introduction
Floods and droughts are climate hazards that commonly occur in rice-based farming systems in West Java, Indonesia. In these farming systems, farmers plant rice crop twice a year; the first rice crops are planted in the wet season (between November and February), and the second rice crops are planted in the dry season (between March and June). The first crop is commonly affected by floods and second by drought. Floods are common between January and March (flood risk increases when monthly rainfall in these months increase above 300 mm), while drought typically develops in May. These hazards are frequently associated with ENSO events. In ENSO ‘warm
event’ (El-Niño) years, for most cases the dry season starts earlier and the rainfall
amount is often substantially reduced (Boer and Subbiah, 2005; Kirono and Partridge, 2002). Under this condition most of second rice crops will suffer from drought (Alimoeso et al., 2002; Meinke and Boer, 2002).
SOI phases have been commonly used to indicate the occurrence of El-Nino or La-Nina. SOI phases consist of five (Stone et al., 1996) namely consistently negative (Phase 1), consistently positive (Phase 2), rapidly falling (Phase 3), rapidly rising (Phase 4) and near zero (Phase 5). Phase 1 and 3 is commonly associated with ENSO ‘warm event’, Phase 2 and 4 with ENSO ‘cold event’, and Phase 5 with normal condition. Many studies have demonstrated that the SOI phases can provide skill in assessing future rainfall probabilities during the subsequent planting season (e.g. Stone and Auliciems, 1992; Stone et al, 1996). In Australia, the SOI phase information has been used widely in managing climate risk to crop production (Meinke, et al. 1996; Meinke and Stone, 1997; Meinke and Hochman, 2000). This study aimed to evaluate the economic benefit of using SOI (Southern Oscillation Index) phase information in March/April to determine a satisfactory planting decision for the second crop (April/May planting).
2. Methods
The study was conducted in Ciparay and Bojongsoang sub-districts of Bandung District, West Java Province, Indonesia. These two sub-districts like the rest of West Java have monsoon rainfall (‘Monsoon’) with a monthly rainfall peak in December. Areas with this type of rainfall are significantly affected by ENSO events (Tjasyono, 1997; Boer and Faqih, 2004; Boer and Subbiah, 2005).
Rice based farming systems and climate related hazards at the two sub-districts were evaluated through survey. The likely crops yields across seasons were evaluated using crop simulation models (DSSAT) with long-term, daily rainfall records (1950-2004). As the model requires other climatic data such as solar radiation and temperature, these two data were generated using the observed daily rainfall data (Boer
et al., 2004). The DSSAT was validated using experimental data collected from Sukamandi Rice Research Institute and Bogor Research Institute for Food Crops. The experiments were conducted in a number of sites, i.e. Bogor, Geritan, Pati and Binangun. The differences between observed and simulated yields were assessed using statistical t-test.
(March-June) with peak planting time in May. In El-Nino years, May planting was normally exposed to high drought risk. This study evaluated the variability of crops yields from year to year under three different planting arrangements. The first arrangement, the first crop was planted in 1st of December and the second crop in 1st of April. The second, the first crop was planted in 1st of January and the second crop in 1st of May. The third, the first crop was planted in 15th of January and the second crop in 15th of May. March/April SOI phase information is then used to determine whether the second crop would (April/May planting) be continued with rice or changed with other crops, i.e. maize or soybean or left to be fallowed.
With the above arrangement, there were four planting decisions namely: (i) Rice-Rice system, in which farmers will keep planting rice twice a year irrespective of SOI phase information; (ii) Rice-Maize system, in which farmers will switch their second crop into maize if March/April SOI Phase is 1 or 3, and keep planting rice otherwise; (iii) Rice-Soybean system, in which farmers will switch their second crop into soybean if March/April SOI Phase is 1 or 3, and keep planting rice otherwise; and (iv) Rice-fallow system, in which farmers will not plant a second crop if March/April SOI Phase is 1 or 3, but keep planting rice otherwise. The economic benefit of using SOI phases was assessed by cumulating the difference between gross margins (i) the Rice system and the Maize system, (ii) the Rice system and the Rice-Soybean system, and (iii) the Rice-Rice system and the Rice-Fallow system.
3. Results and Discussion
Rice Based Farming System and Climate Related Problems in West Java. Most of agriculture areas in the two sub-districts are irrigated, only a few are rainfed. Farmers normally plant rice twice a year in the irrigated areas and once a year in rainfed areas. Maize is the second main crops after rice. Other crops are cassave, sweet potato, onion, long bean, chilli, cucumber and some other vegetable crops. Soybean is planted only by very few farmers. At present, most farmers do not use their rice field for planting maize or soybean. They normally plant maize in dryland throughout the year. Soybean is also planted throughout the year but there is a big variation of planting area between years.
1. Technical irrigared lands
Rice-Rice-Fallow
2. Convenstional irrigared lands or rainfed: rice-rice-fallow Rice-Rice-Fallow
Rice-Upland-Vegerable/fallow Rice-vegetable-vegetable/Fallow 3. Dry lands agriculture:
Maize-Maize-Vegetable
Maize-soybean-vegetable
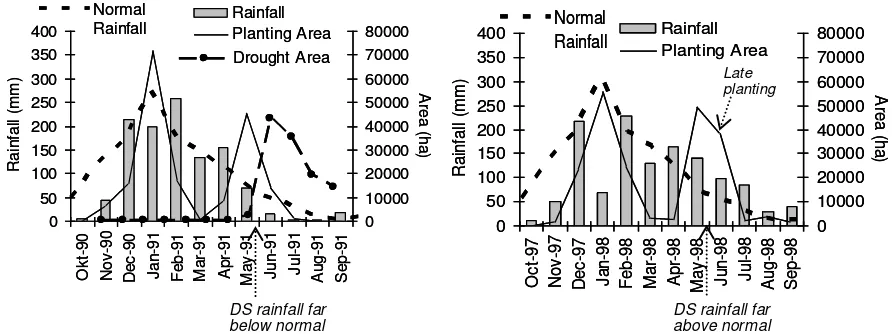
below normal. Too late planting for the second rice crop due to much delay of the onset of wet season can also cause drought. These conditions commonly occur in El-Nino years. Too late planting for second rice will not cause drought problem when rainfall in the season is much above normal which is commonly occur in La-Nina years. A study at Indramayu district of West Java province show clear connection between ENSO events and rainfall characteristic and its association with drought occurrence (Figure 1).
Figure 1. Relationship between rainfall characteristics and drought occurren ce in El-Nino (1990/91) and La-Nina (1997/98) years at Indramayu District of West Java Province (Boer, 2002)
This result of the study shows that the April SOI phases can provide skill in assessing DS rainfall probability distribution of May-June rainfall anomaly of the study areas (Figure 2). Probability to have above average rainfall (indicating by positive anomaly) in May-June increases when April SOI phase is 2 or 4. Probability to have below average rainfall (indicating by negative anomaly) in May-June increases when April SOI phase is 1 or 3. This suggests that profitability of rice farmers could be increased by using knowledge of atmospheric conditions obtained prior to planting to forward estimate production level and risk.
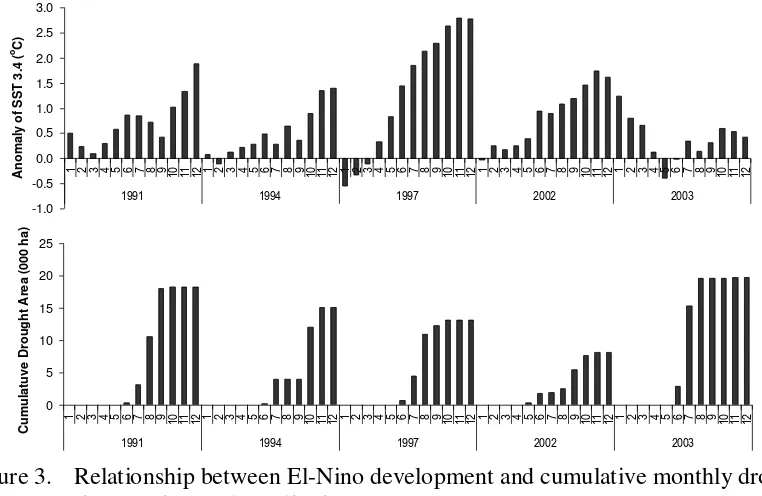
The above results indicate that in rice based cropping system, the timing of the first planting and rainfall condition during the second planting season are the two primary factors that should be considered in making second planting decision. Much delay in first planting due delay in the onset of rainy season will cause much delay in second planting. Under these circumstances, keeping planting rice for the second crop may be exposed to high drought risk. Figure 3 shows that weak El-Nino that occurred in 2003 caused higher drought impact than that occurred in strong 1997 El-Nino. This was because the second planting for rice delayed between one and two months due to late planting of the fist rice crops caused by late onset of wet season in 2002. In 1997, the El-Nino developed rapidly and very strong compare other El-Nino years. This caused the rainy season ended earlier and rainfall in May and June already disappeared before some farmers start planting their second rice crop. Therefore, total area being affected by drought in the strong 1997 El-Nino was lower than those in other El-Nino years.
Figure 3. Relationship between El-Nino development and cumulative monthly drought rice area in Bandung district.
Strong connection between Sea Surface Temperature (SST) anomaly at Pacific Ocean and rice production in Indonesia has motivated a number of scientist to develop rice production model from the SST anomaly. Taylor et al. (2002)
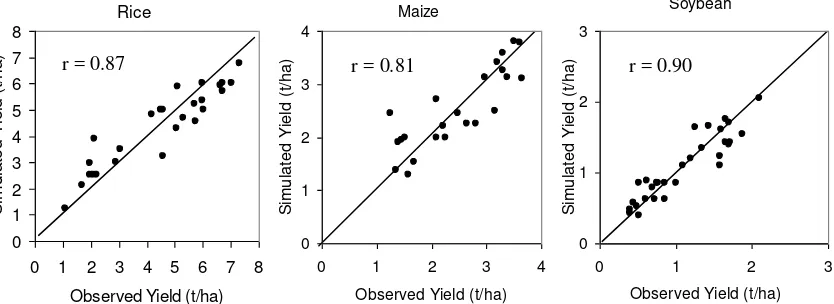
Economic Benefits of Using SOI Phase Information. The result of validation of the DSSAT model used to evaluate economic benefits of using SOI phase information in crop management decision was reasonably good (Figure 4). The differences between simulated and observed yields were not significantly different.
Figure 4. Comparison between simulated yields from DSSAT and observed yields for rice, maize and soybean
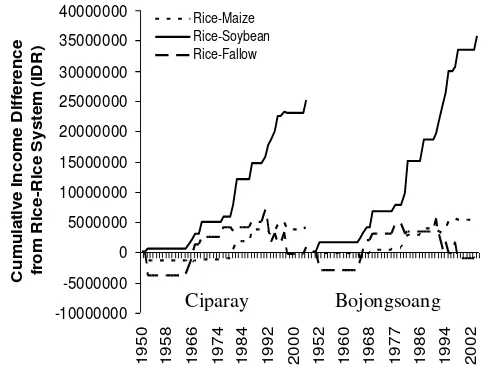
Further analysis to assess the economic benefits of using SOI phase was then done using the simulated yield. The results of the analysis show that farmers who switch their crop to soybean or maize for May planting if April SOI Phase is 1 or 3 will get a higher income compared to farmers that keep planting rice (Figure 5). Cumulatively, over 24 years, the net income difference between farmers that use April SOI Phase information in deciding a crop type for May planting and those that do not is about 25 million IDR at Ciparay and 35 million IDR at Bojongsoang if they chose soybean as the second crops, and about 2 and 5 million IDR respectively if they chose maize. Farmers who choose not to plant a second crop will accrue a lower income than those that plant the crops. Furthermore, farmers who decide not to plant a second crop in April if March SOI Phase is 1 or 3 will get a much lower income compared to farmers who plant the second crops. This outcome suggests that the decision to planting or not to plant a second crop in May is more crucial than in April. Farmers who make what appears to be a proper decision for May planting based on April SOI Phase will, in the long term get consistently a much higher benefit than farmers who keep planting rice irrespective of the April SOI Phase.
Figure 5. Income difference between farmers that use and do not use SOI Phase information
This approach can be used to assess the economic benefit of changing management options such as introducing new crop sequence (non-rice-rice-non-rice) if length of rainy season shorten or changing second crop with horticulture etc. The knowledge gained in study needs to be communicated to farmers so they can make us of the knowledge to assist them in coping with drought hazards. There are a number of means to communicate technologies and knowledge to farmers and each country will have different experiences in doing this. In Indonesia, the use of this simulation studies is for increasing the confidence. In additional, barriers and constraints faced by farmers for implementing the options also need to be assessed and removed.
(WILL BE EXPANDED)
1st Planting: 1 Dec, 2nd Planting: 1 April
-35000000
1950 1958 1966 1974 1984 1992 2000 1952 1960 1968 1977 1986 1994 2002
C
1st planting: 1 Jan, 2nd Planting: 1 May
-10000000
1950 1958 1966 1974 1984 1992 2000 1952 1960 1968 1977 1986 1994 2002
C
1st Planting: 15 Jan, 2nd Planting: 15 May
-10000000
1950 1958 1966 1974 1984 1992 2000 1952 1960 1968 1977 1986 1994 2002
4. Conclusion
References
Alimoeso, S., R. Boer, S.W.G. Subroto, E.T. Purwani, Y. Sugiarto, R.M.K. Rahadiyan and Suciantini. 2002. Distribution of drought prone rice growing area in Indonesia. Directorate of Plant Protection, Ministry of Agriculture, Jakarta (in Indonesian). Kirono, D. and I. J. Partridge. 2002. The climate and the SOI. p. 17-24. In I.J.
Partridge and M. Ma’shum (ed) Will It Rain?: The effect of the Southern Oscillation and El Niño in Indonesia. Queensland Government, Department of Primary
Industry, Australia.
Meinke, H. and R. Boer. 2002. Plant growth and the SOI. In I.J. Partridge and M.
Ma’shum (ed) Will It Rain? The effect of the Southern Oscillation and El Niño in
Indonesia. Queensland Government, Department of Primary Industry, Australia. p. 25-28.
Boer, R., and A.R. Subbiah. 2005. Agricultural droughts in Indonesia. In V.K. Boken, A.P. Cracknell, and R.L. Heathcote. Monitoring and Predicting Agriculture Drought. Oxford University Press, p:330-344.
Stone, R.C., and A. Auliciems. 1992. SOI phase relationship with rainfall in earstern Australia. International Journal of Climatology, 12:625-636
Stone, R.C., G.L. Hammer, and T. Marcussen. 1996. Prediction of global rainfall probabilities using phases of the Southern Osciallation Index. Nature 384:252-255.
Tjasyono, B. 1997. Mekanisme fisis para, selama, dan pasca El Niño. Paper disajikan pada Workshop Kelompok Peneliti Dinamika Atmosfer, 13-14 Maret 1997.
Boer, R and M. Faqih. 2004. Global climate forcing factors and rainfall variability in West-Java. Indonesian Journal of Agriculture Meterology 18:1-12
Boer, R, P. Rakiso and A. Faqih, 2004. The use of climatic data generator to cope with daily climatic data scarcity in simulation studies. In Proceedings of the 4th International Crop Science Congress Brisbane, Australia, 26 Sep – 1 Oct 2004,
http://www.cropscience.org.au/icsc2004/poster/2/6/index.htm#TopOfPage