DUCTILITY ASSESSMENT OF REINFORCED CONCRETE PILE-TO-PILE CAP
CONNECTIONS IN APPLICATION
Mochamad Teguh
Lecturer at the Department of Civil Engineering,
Faculty of Civil Engineering and Planning, Islamic University of Indonesia Integrated Campus, Jl. Kaliurang Km 14,5, Yogyakarta 55584
e-mail: [email protected]
ABSTRACT
Ground motion occurred during moderate seismic event causes pile-to-pile cap connections producing a large curvature demand and a plastic hinge at the pile head. Severity damage along the pile is controlled by limiting the curvature ductility demand in the potential plastic hinge region of the pile. The strength and stiffness of the soil-pile interaction and the equivalent plastic hinge length of the pile directly quantify the curvature ductility demand of fixed pile-to-pile cap connection. A routine that incorporates the limit state analysis based on the kinematic model and the moment-curvature analysis was developed to calculate the displacement ductility factor to the local curvature ductility demand. A fixed-head pile-to-pile cap connection embedded in cohesive and cohesionless soils was studied. The result shows that the first plastic hinges for both soil conditions occur at the interface of fixed-head pile connection. The ductility assessment demonstrates that curvature ductility demands for the fixed-head pile embedded in cohesive soil is higher compared to the pile embedded in cohesionless soil providing a different location of the second plastic hinges.
Keywords: curvature demand, ductility demand, plastic hinge, fixed-head, pile-to-pile cap connection
INTRODUCTION
Previous seismic design practice of the pile
foundations has commonly simplified the effect of
the ground motions applied to the structure,
particularly in the design of pile-to-pile cap
connections. This concept is generally a conservative
design assumption for a spectral analysis approach,
as the flexible pile foundation results in period
lengthening and increased damping, and consequent
decreased structural forces relative to a fixed base
case. In extreme cases, such as the 1985 Mexico City
Earthquake, however, period lengthening causes
increased spectral values in relation to the current
code specifications recommended by the National
Earthquake Hazards Reduction Program (NEHRP)
(Holmes, 2000). Seismic behavior of the pile-to-pile
cap connections depends on the ductility capacity of
its yielding members. In the case of reinforced
concrete piles, the overall ductility capacity of the
structure is dependent on the local ductility capacity
of the pile, which should be adequately confined to
ascertain a ductile behavior. In addition, amount of
reinforcement
details
of
longitudinal
and
confinement and the compressive strength of
concrete directly affect to the lateral stiffness,
Consequently,
the
lateral
force-deformation
characteristics of the pile also depend on the
interaction between the pile and surrounding soil.
The analyses described in the present study were
carried out to provide a better definition of the
ductility capacity and to specifically identify the
parameters affecting equivalent plastic hinge length,
depth to equivalent fixity for displacement, and depth
to position of maximum moment. A soil with
stiffness increasing linearly with depth (typically for
a granular soil) was assumed. The lateral loading of
pile acting on the pile cap produces different moment
patterns depending on either free-head or fixed-head
piles. The controlling hinge in a fixed-head pile will
develop at the pile-to-pile cap connection; attainment
of the full inelastic potential of this hinge will
generally result in the formation of a second,
subgrade hinge (Budek et al., 2000).
MODEL DESCRIPTION OF LATERALLY
LOADED PILE: FIXED-HEAD CASE
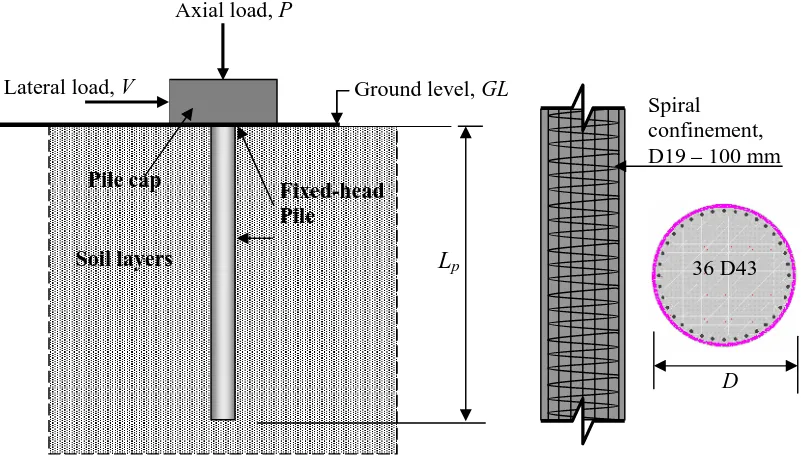
An analytical model of laterally loaded pile was
applied to the fixed-head pile-to-pile cap connections
embedded in cohesive and cohesionless soils as
depicted in Figure 1. According to NEHRP (2001),
soil profiles of the two soil conditions are classified
as cohesive soil and cohesionless soil. In this study, a
single reinforced concrete pile-to-pile cap connection
is fully embedded in the soil to analyze ductility
assessment of the structure. Fixity of the pile head
against rotation was considered. The pile has a
diameter of D = 1.83 m and an embedded length of
33 m, as shown in Figure 1a. The pile as presented in
Figure 1b was reinforced with 32 longitudinal
reinforcements of 43 mm diameter and confined with
spiral reinforcement of 19 mm diameter and 110 mm
spiral pitch. Compressive strength of 27.6 MPa and
an axial load compression of 7259 kN or 0.1 A
c.f
c’
was assumed. Probable yield strength of rebar was
assumed to be 455 MPa, 10% above normal grade
value. Material and section properties of the pile
used in this analysis are listed in Table 1.
(a) Detail of fixed-head pile
(b) Circular pile cross-section
Figure 1. Winkler beam model of soil-pile system
Table 1. Material and section properties of reinforced concrete pile
Material description
Quantity
Pile diameter, D
1.83 m
Concrete cover
50.4 mm
Compressive strength of concrete, f
c’
27.6 MPa
Expected compressive strength of concrete,
f
ce'
1
.
3
f
c'35.9 MPa
Tensile strength
- 1.9 MPa
Yield strain
3.5x10
-3Unconfined crushing strain
4.0x10
-3Confined crushing strain
14.6x10
-3Spalling strain
6.0x10
-3Concrete elastic modulus, E
c24870 MPa
Confined concrete strength
35.9 MPa
Longitudinal reinforcement
36 D43
Axial load, P
Lateral load, V
Soil layers
D
Ground level, GL
L
pFixed-head
Pile
Pile cap
Lanjutan Tabel-1:
Spiral reinforcement and pitch
D19
–
110 mm
Yield strength of longitudinal and spiral steel, f
y455 MPa
Expected yield strength of longitudinal and spiral steel, f
ye= 1.13 f
y514.2 MPa
Embedded pile length, L
d33.0 m
Moment of inertia (I
x= I
y)
5.6x10
11
mm
4Longitudinal reinforcement ratio,
ρ
l1.99%
Transversal spiral reinforcement ratio,
ρ
s0.6 %
Unconfined area of concrete
281.6x10
3mm
2Confined area of concrete
2.3x10
6mm
2Axial force, P = 0.1 A
cf
c’
7259 kN
MOMENT-CURVATURE
ANALYSIS
Moment-curvature
analysis
is
essentially
required to define a sectional capacity of the
reinforced concrete pile, such as the
moment-curvature relationship at yield and ultimate
conditions. A nonlinear sectional analysis using the
XTRACT source code (Chadwell and Imbsen, 2004)
was carried out to determine equivalent elastoplastic
yield and ultimate curvatures to satisfy seismic
performance of a structure, as the damage can be
controlled by limiting the strain values in critical
regions.
To start with, the concrete pile section was
discretised into small triangular elements to cover
confined
and
unconfined
concrete
areas in
determining accurate confined concrete strength and
crushing strain. As a comparison, a reinforced
concrete pile modeled by Budek et al. (2000) was
selected in the application as presented in this
section. Table
1 shows material and section
properties of a reinforced concrete pile used in the
analysis of laterally loaded piles.
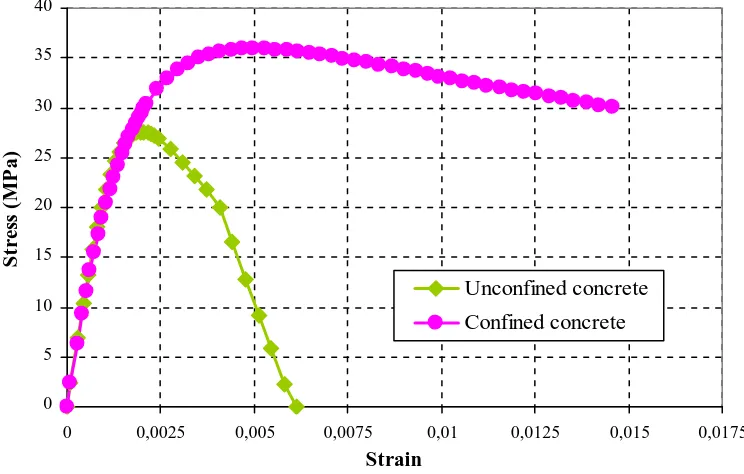
The modified Scott Model was utilized to
compute the stress and strain of confined concrete.
The
unconfined
and
confined
stress-strain
relationships are shown in Figure 2, while the
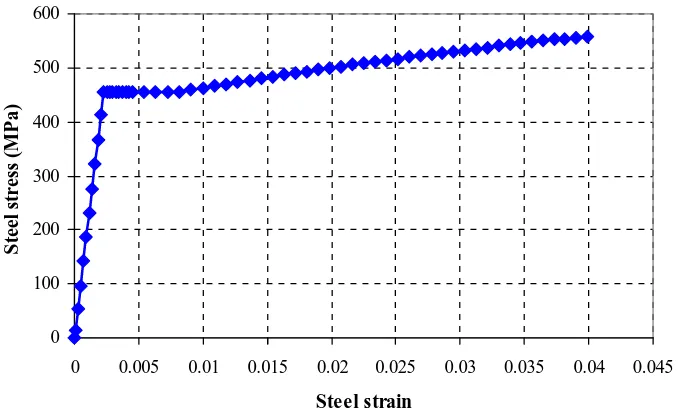
stress-strain relationship of longitudinal and transverse
spiral steels is presented in Figure 3. Due to the
circular cross-section of the pile and symmetric
longitudinal steels, only the moment-curvature about
the x axis was computed.
0 5 10 15 20 25 30 35 40
0 0,0025 0,005 0,0075 0,01 0,0125 0,015 0,0175
Strain
S
tr
es
s
(M
P
a)
Unconfined concrete
Confined concrete
0 100 200 300 400 500 600
0 0.005 0.01 0.015 0.02 0.025 0.03 0.035 0.04 0.045
Steel strain
S
te
el
s
tr
es
s
(M
P
a
)
Figure 3. Stress-strain relationships for longitudinal and spiral reinforcement
Two interaction models were performed in this
analysis, i.e. axial force moment interaction and
moment-curvature interaction. In the first interaction
model, limiting strains for both concrete and steel
materials were specified and the reduction factor for
moment and axial load was varied from 0.7 to 0.9,
with maximum axial capacity set equal to 0.56 A
g.f
c’
.
For the second interaction model, the first step load
applied was provided equal to 0.1 A
g.f
c’
and the load
was incremented at moment about the x axis (M
xx).
The plastic hinge length was assumed as 915 mm,
which is equal to half the pile diameter, to calculate
the moment rotation. The confined concrete model
was reduced to incorporate the effects of concrete
arching action (Paulay and Priestley, 1992). Figure
4a shows a discretised cross-section for the
undeformed condition and Figure 4b presents a
deformed cross-section at the ultimate load, with the
bottom in compression about the x axis. Figure 4b
shows an image of the deformed cross-section that
has experienced such deformations. The blue fibers
illustrate the confined concrete in compression, the
white fibers represent unconfined cover concrete that
has spalled off, and the green bars symbolize
longitudinal reinforcement in the strain-hardening
regime.
The
moment-curvature
analysis
results
presented in Figure 5 and Table 2 show good
agreement; which is achieved when the
moment-curvature computed with the sectional technique is
compared with theoretical analysis proposed by
Budek et al. (2000). In this analysis, the confined
model used the Modified Scott model while Budek et
al. (2000) have used the Mander model (Mander et
al., 1988). When the reinforcement starts yielding at
the inelastic condition, the Mander model has shown
a more conservative moment-curvature compared
with the Modified Scott model; however, the results
have
satisfied
the
theoretical
stress-strain
relationships.
0 5000 10000 15000 20000 25000
0 0.005 0.01 0.015 0.02 0.025 0.03 0.035 0.04
Curvature at the x axis (1/m)
M
o
m
en
t
a
t
th
e
x
a
x
is
(
k
N
-m
)
Nonlinear Sectional Analysis
Budek et al. (2000)
Bilinearisation
Figure 5. Moment-curvature relationships for the circular reinforced concrete pile
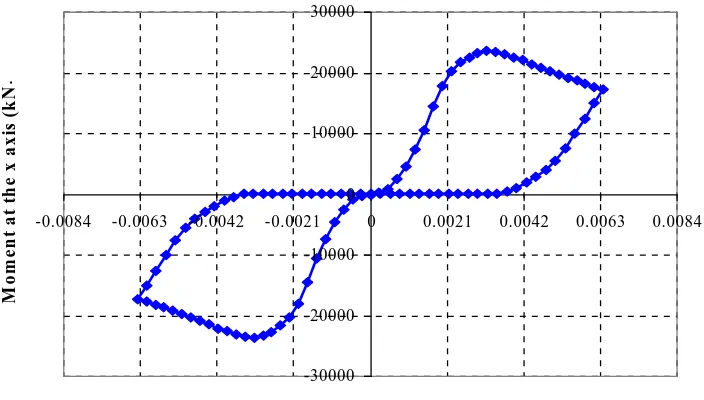
The axial force moment interaction was used as
an alternative to calculate the axial force-ultimate
curvature relation. The purpose of this interaction is
to perform a sequence of moment-curvature analyses
with differing axial forces. In this case, a
moment-curvature analysis is only performed with the axial
force of 0.1 A
g.f
c’
applied to the confined concrete
cross-section shown in Figure 6. More details on a
combination of the moment-curvature for different
parameters, such as different axial forces, pile
cross-sections, and reinforcement ratios, are described in
Teguh (2007).
-30000 -20000 -10000 0 10000 20000 30000
-0.0084 -0.0063 -0.0042 -0.0021 0 0.0021 0.0042 0.0063 0.0084
Curvature at the x axis (1/m)
M
o
m
e
n
t
a
t
th
e
x
a
x
is
(
k
N
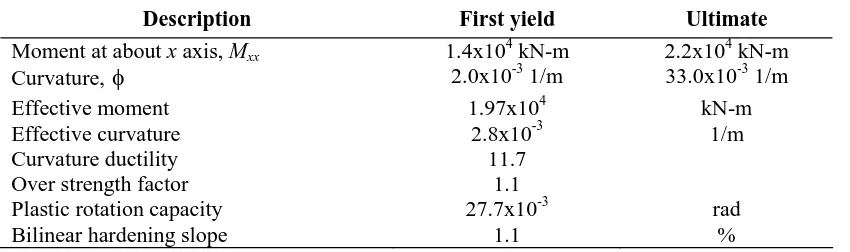
Table 2. Pile analysis results
Description
First yield
Ultimate
Moment at about x axis, M
xx1.4x10
4
kN-m
2.2x10
4kN-m
Curvature,
2.0x10
-31/m
33.0x10
-31/m
Effective moment
1.97x10
4kN-m
Effective curvature
2.8x10
-31/m
Curvature ductility
11.7
Over strength factor
1.1
Plastic rotation capacity
27.7x10
-3rad
Bilinear hardening slope
1.1
%
RESULTS AND DISCUSSION ON LIMIT
STATE ANALYSIS
An application of the limit state analysis is to
analyze deep pile foundations with fixed pile-to-pile
cap connections subjected to a large curvature
demand at the pile head or pile cap. Under seismic
events, pile damage induced by local inelastic
deformation depends on the magnitude of the lateral
displacement imposed on the pile.
In this application, a single reinforced concrete
pile-to-pile cap connection shown in Figure 1 is
considered as a floating pile embedded in cohesive
and cohesionless soils. With regard to the reinforced
concrete material, the ATC-32 (1996) suggested that
the expected compressive strength of concrete is
' '
3
.
1
cce
f
f
= 35.9 MPa. Caltrans
(2001) has
recommended that the expected yield strength of
steel is f
ye= 1.13 f
y= 514.12 MPa. Both soil profiles
have been classified referring to the NEHRP (2001)
recommendations as depicted in Table 3. For
estimation of curvature ductility demand, the soil
stiffness should correspond to the first yield limit
state and it should be strictly reduced, as softening of
the soil would have occurred upon first yielding of
the pile.
The moment-curvature response of the pile
section was idealized by an elastoplastic response as
shown in Figure 5. To meet seismic performance of
the pile foundation system, the pile damage was
controlled by limiting the strain values in the critical
regions. Kowalsky (2000) suggested a damage
control strain of 0.018 for the extreme fiber of the
confined concrete core, or 0.060 for the extreme
tension
fiber
of
longitudinal
reinforcement.
Following this suggestion for the damage control for
fixed-head piles, the limiting curvature of the pile is
03304
.
0
u
rad/m considered as the ultimate
curvature of the section (Table 1). Providing the
level of confining steel for the pile, the curvature
72
.
11
)
(
curvature ductility demand was estimated for a range
up to 3 of an imposed displacement ductility factor.
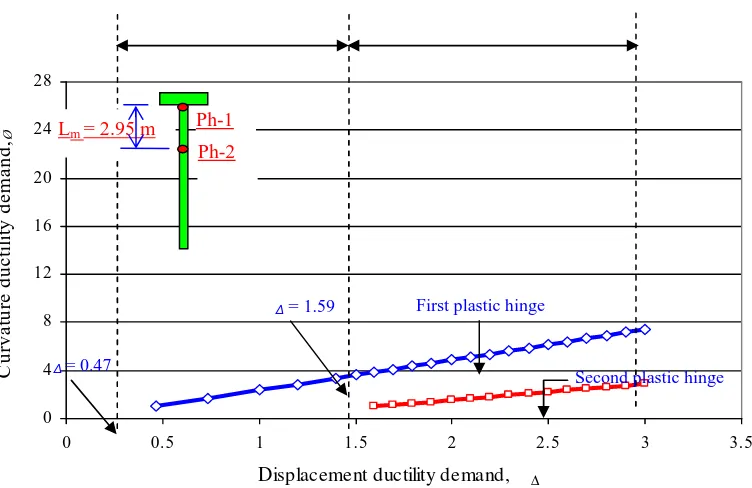
Referring to the analytical approach presented in
a companion paper, both kinematic relations for first
and second plastic hinges were calculated and the
results are then plotted in Figure 7 and Figure 8. The
resulting kinematic relations show that the curvature
ductility
factor
increases
linearly
with
the
displacement ductility factor for both plastic hinges,
however both straight lines of first and second plastic
hinges are not parallel. In the small displacement
range, where only one plastic hinge forms, i.e.
μ
Δ<
1.47, the slope of the line is also slightly different
from the slope where two plastic hinges form. For a
curvature ductility capacity of 11.72, as estimated for
the pile section, the result in Figure 7 indicates that
the fixed-head pile can tolerate a displacement
ductility factor of 1.63. For a displacement ductility
factor of
μ
Δ= 1, the curvature ductility demand in the
first plastic hinge is
1
5
.
19
. The reason for the
curvature ductility factor greater than unity is due to
the definition of the elasto-plastic yield displacement
Δ
y= 0.2335 m, which is larger than the lateral
displacement to cause the first yield of the pile
Δ
y1 =0.123 m.
The resulting kinematic relations are plotted in
Figure 8 for comparison with the case of soft clay.
The curvature ductility demand for the pile in dense
sand follows the same trend as that of the soft clay,
with a linearly increasing curvature ductility factor
for an increased displacement ductility factor. For a
given displacement ductility factor, however, the
curvature ductility demand in dense sand is
significantly smaller than the curvature ductility
demand in soft clay. For example, at a displacement
ductility factor of
μ
Δ= 3, the curvature ductility
demand is
1
7
.
41
for the case of dense sand
compared to the curvature ductility demand of
1
.
26
1
Table 3. Soil properties according to NEHRP (2001)
Description
Cohesive soil
Cohesionless soil
NEHRP soil classification, soil profile
Class E site, S
E(soft
clay)
Class C site, S
C(dense sand)
Undrained shear strength, S
u35.0 kPa
-Friction angle,
-
42
0Effective weight of soil,
γ ’
17.5 kN/m
320.5 kN/m
3Figure 7. Kinematic relation for a fixed-head pile embedded in cohesive soil
Figure 8. Kinematic relation for a fixed-head pile embedded in cohesionless soil
0 4 8 12 16 20 24 28
0 0.5 1 1.5 2 2.5 3 3.5
Displacement ductility demand, μ ∆
C
u
rv
a
tu
re
d
u
c
ti
li
ty
d
e
m
a
n
d
,
μØ
μ ∆ = 0.47
μ ∆= 1.59 First plastic hinge
Second plastic hinge
Lm= 2.95 m Ph-1
Ph-2
0 4 8 12 16 20 24 28
0 0.5 1 1.5 2 2.5 3 3.5
Displacement ductility demand, μ ∆
C
u
rv
a
tu
re
d
u
c
ti
li
ty
d
e
m
a
n
d
,
μØ
μ ∆= 0.60
μ ∆= 1.47
First plastic hinge
Second plastic hinge One plastic hinge Two plastic hinges
Ph-1
Lm = 3.82 m
CONCLUDING REMARKS
The following concluding remarks are drawn based
on the theoretical development presented in a
companion paper and its numerical applications.
1.
The resulting kinematic relations for
cohesive soil show that the curvature
ductility factor increases linearly with the
displacement ductility factor for both plastic
hinges; however, both straight lines of first
and second plastic hinges are not parallel. In
the small displacement range where only
one plastic hinge forms, i.e.
μ
Δ< 1.47, the
slope of the line is also slightly different
from the slope where two plastic hinges
form. For a curvature ductility capacity of
11.72 as estimated for the pile section, the
result in Figure 7 indicates that the
fixed-head pile can tolerate a displacement
ductility factor of 1.63.
2.
The curvature ductility demand for the pile in
dense sand follows the same trend as in soft
clay, with a linearly increasing curvature
ductility factor for an increased displacement
ductility factor. For a given displacement
ductility factor, however, the curvature ductility
demand in dense sand is significantly smaller
than the curvature ductility demand in soft clay.
As seen in the application, at a displacement
ductility factor of
μ
Δ= 3, the curvature ductility
demand is
1
7
.
41
for the case of dense
sand compared to the curvature ductility
demand of
1
26
.
1
for soft clay. Although it
was not plotted in Figure 8, the estimated
curvature ductility capacity of 11.72 for the pile
section would correspond to a displacement
ductility factor of
μ
Δ= 4.70.
3.
Advanced studies on laterally loaded piles
applied to free-head and fixed-head cases that
are embedded partially and fully in different soil
profiles are highly recommended to enhance
seismic performance of the pile-to-pile cap
connections.
REFERENCES
ATC-32., 1996, Improved Seismic Design Criteria
for
California
Bridges:
Provisional
Recommendations, Redwood City, California.
Budek, A. M., Priestley, M. J. N., and Benzoni, G.,
2000, Inelastic Seismic Response of Bridge
Drilled-Shaft RC Pile/Column,
Journal of
Structural Engineering, ASCE, V. 126(Issue 4),
510-517.
Caltrans, 2001, Caltrans Seismic Design Criteria,
Version
1.2.,
California
Department
of
Transportation, Sacramento, California.
Chadwell, C. B., and Imbsen, R. A., 2004, XTRACT
- Cross Section Analysis Software for Structural
and
Earthquake
Engineering,
http://www.imbsen.com/xtract.htm.
Holmes, W. T., 2000,
The 1997 NEHRP
Recommended
Provisions
for
Seismic
Regulations for New Building and Other
Structures, Earthquake Spectra, Vol. 16, No. 1,
pp. 101-114.
Kowalsky, M. J., 2000, Deformation Limit States for
Circular Reinforced Concrete Bridge Columns,
Journal of Structural Engineering, ASCE, Vol.
126, No. 8, pp. 869-878.
Mander, J. B., Priestley, M. J. N., and Park, R., 1988,
Theoretical Stress-Strain Model for Confined
Concrete, Journal of Structural Engineering,
ASCE, V.114, 1804-1826.
NEHRP, 2001, NEHRP Recommended Provisions
for Seismic Regulations for New Buildings and
Other Structures, FEMA 368, Washington, D.C.
Paulay, T., and Priestley, M. J. N., 1992, Seismic
Design of Reinforced Concrete and Masonry