Gene expression and enzyme activities of carbonic anhydrase and
glutaminase in rat kidneys induced by chronic systemic hypoxia
Keywords: CA9, chronic systemic hypoxia, GLS1, HIF-1α, kidney
pISSN: 0853-1773 • eISSN: 2252-8083 • http://dx.doi.org/10.13181/mji.v24i3.1190 • Med J Indones. 2015;24:139-45 • Received 20 Jan 2015 • Accepted 15 Sep 2015
Correspondence author: Andi N.K. Syariin, [email protected]
Copyright @ 2015 Authors. This is an open access article distributed under the terms of the Creative Commons Attribution-NonCommercial-ShareAlike 4.0 International License (http://creativecommons.org/licenses/by-nc-sa/4.0/), which permits unrestricted non-commercial use, distribution, and reproduction in any medium, provided the original author and source are properly cited.
Andi N.K. Syariin,1,2 Sri W.A. Jusman,3,4 Mohamad Sadikin3,4
1 Master Student, Biomedical Sciences Graduate Program, Faculty of Medicine, Universitas Indonesia, Jakarta, Indonesia
2 Faculty of Medicine, Universitas Halu Oleo, Kendari, Indonesia
3 Department of Biochemistry and Molecular Biology, Faculty of Medicine, Universitas Indonesia, Jakarta, Indonesia
4 Center of Hypoxia and Oxidative Stress Study, Jakarta, Indonesia
B a s i c M e d i c a l Re s e a rc h
ABSTRAK
Latar belakang: Hipoksia dapat menyebabkan peningkatan
produksi H+. Ginjal berperan dalam menjaga keseimbangan asam-basa, yang melibatkan aktivitas enzim karbonat anhidrase (CA) dan glutaminase (GLS). Jaringan ginjal dikenal selalu dalam keadaan hipoksia relatif. Penelitian ini bertujuan untuk mengukur ekspresi dan aktivitas enzim CA9 dan GLS1 serta kaitannya dengan ekspresi hypoxia-inducible factor-1α
(HIF-1α), suatu protein faktor transkripsi yang merupakan
penanda hipoksia.
Metode: Penelitian ini merupakan studi eksperimental in
vivo dengan desain paralel yang berpasangan. Sampel yang digunakan berupa 25 ekor tikus Sprague Dawley jantan, berat 150-200 g. Tikus dibagi menjadi 5 kelompok, yaitu kelompok kontrol (kondisi normoksia), kelompok perlakuan di dalam ruang hipoksia (10% O2: 90% N2) selama 1, 3, 5 dan 7 hari. Setelah perlakuan, semua tikus dikorbankan dengan eutanasia dan jaringan ginjal diisolasi, dihomogenisasi dan dianalisis untuk pemeriksaan ekspresi gen dan aktivitas enzim
CA9, GLS1 serta protein HIF-1α. Data dianalisis secara statistik
dengan metode ANOVA dan sebagai alternatifnya digunakan Uji Mann-Whitney dan Kruskal-Wallis.
Hasil: Ekspresi mRNA HIF-1α meningkat selama hipoksia,
tetapi tidak untuk protein HIF-1α. Tampaknya terjadi asidosis
di jaringan ginjal, ditandai dengan peningkatan ekspresi mRNA
CA9 dan GLS1 dan aktivitas spesifik CA total dan GLS1. Ekspresi
mRNA CA9 dan GLS1 keduanya menunjukkan korelasi positif
yang kuat dengan mRNA HIF-1α.
Kesimpulan: Selama hipoksia sistemik kronis, ekspresi
mRNA CA9 dan GLS1 meningkat sebagai respons terhadap peningkatan H+, dan terkait dengan ekspresi mRNA HIF-1α.
ABSTRACT
Background: Hypoxia can cause acidosis. Kidney plays an essential role in maintaining acid-base balance, which involves the activities of carbonic anhydrase (CA) and glutaminase (GLS). This study is aimed to determine the expression and activities of the CA9 and GLS1 enzymes in relation to hypoxia
inducible factor-1α (HIF-1α), a transcription factor protein
which is a marker of hypoxia.
Methods: This study was an in vivo experimental study with coupled paralel design. used 25 male Sprague-Dawley rats weighing 150-200 g. Rats were divided into 5 groups: the control group (normoxic condition) and 4 treatment groups. The latter were kept in a hypoxic chamber (10% O2: 90% N2) for 1, 3, 5 and 7 days. All rats were euthanized after treatment, kidneys excised, tissues homogenized and investigated for gene
expression of CA9, GLS1 and HIF-1α. On protein level, total enzymatic activities of CA and GLS and protein of HIF-1α were
also investigated. Data were analyzed statistically using ANOVA
for significance, and as its alternative, used Mann-Whitney and Kruskal-Wallis test.
Results: Results showed that HIF-1α mRNA increased during hypoxia, but not HIF-1α protein. It seemed that
acidosis occurs in kidney tissue, indicated by increased CA9 and GLS1 mRNA expression and specific activity of total CA and GLS1. Expression of CA9 and GLS1 mRNA both showed
strong positive correlation with HIF-1α mRNA, but not with HIF-1α protein.
Conclusion: It is suggested that during chronic systemic hypoxia, gene expression of CA9 and GLS1 and their enzyme activities were increased as a response to acidosis and
Hypoxia occurs when an organism as a whole, or an organ, undergoes reduced oxygen supply due to whatever cause. Organs may respond differently to the same condition. However, regardless the type or pattern of response, organism and organ respond to stress such as hypoxia in order to survive. As to survive organism or organ need energy, and the goal of different response is how to secure sufficient energy in such short supply state. One type of response can be in the form of switching metabolism to relatively anaerobic at the price of increasing acid production. It is well known that kidney is one of the major organs which are essential to maintaining blood or body pH. To this end the organ is equipped with a specific, powerful enzyme, the carbonic-anhydrase (CA).
Carbonic-anhydrase was included in the family of metaloenzyme containing zinc, catalyze the
reversible hydration of carbon dioxide (CO2). CA
plays a role in several biological processes such
as regulation of pH, CO2 and bicarbonic ion (HCO3
-) transport, and production of body fluids. CA
isoenzymes are expressed in different tissues, as well as in terms of the kinetics and mechanism of enzyme inhibition. CA9 is involved in the regulation of pH on hypoxia cell. The effect of pH adjustment of CA9 appears to be associated
with catalytic activity in producing HCO3- ions
that enter into the cytoplasm, then neutralizing intracellular proton and helps to maintain the neutral intracellular pH. Second, CA9 then contribute to decrease the pH value of hypoxic
cell environment.1-3
Glutaminase 1 (GLS1) and GLS2 encode several glutaminase isoenzymes. GLS1 encodes messenger ribonucleic acid (mRNA) transcript that is experiencing the type of splice which in turn translated into three isoenzymes human glutaminase: glutaminase-1 or kidney-type glutaminase (KGA), glutaminase C (GAC), glutaminase M (GAM). KGA expressed at most in
the kidney and in the brain.4
Net result of CA work in kidney is to excrete H+
and thus, it maintains the blood pH. However, the lowest tolerable pH for urine is about 4.5. To
keep the pH not lower than this value, the H+ has
to be converted to another compound without decreasing the pH. The substance is ammonia
(NH3) which combines with H+ to form NH
4 +,
which, on the contrary is slightly alkaline. The
source of NH3 is glutamine, which undergoes
deamination catalyzed by glutaminase. The aim of this study is to answer the question, how does
kidney respond to high H+ production formed
in hypoxic condition. As CA is essential for this purpose and must be aided by glutaminase, we proposed to approach the problem by measuring the gene expression and the enzymatic activities of CA and glutaminase. Another protein, hypoxia inducible factor-1 (HIF-1) is important in the cell’s response to hypoxia by controlling a number of genes which are needed to adequately respond to hypoxia. Therefore, we measured also the expression and the concentration of HIF-1.
METHODS
The experiment was performed on young male Sprague-Dawley rats weighing 150-200 g. The animals obtained from Laboratory of Drug and Food Control Agency, Ministry of Health, Republic of Indonesia, were adapted to our animal house condition for two weeks. All protocols in this study were reviewed and approved by Research Ethical Committee of Faculty of Medicine Universitas Indonesia (No. 113/112.FI/ETIK/2013).
Hypoxia experiments
Sprague-Dawley rats were grouped into five and each consisted of five rats. The number in each group was determined according to Federer formula. One group was chosen randomly as a control normoxic group and placed in
environment air condition (20% O2 partial
pressure). The other four groups were placed in a closed hypoxic chamber sealed to have no access to environmental air and connected only to a gas
mixture tube as oxygen source (O2 10%, N2 90%
and one atmosphere pressure). All rats had access
to standard food and water ad libitum. Rats were
sacrificed at days one, three, five and seven of hypoxia. Blood was collected and stored at -20°C. Excised organs were stored at -80°C.
Assay of mRNAs
NM_001107956.1, and NR_046237.1. From this survey we obtained the following primers: for HIF-1α 5’-ACA GTG GTA CTC ACA GTC GG-3’ (forward) and 5’-CCC TGC AGT AGG TTT CTG CT-3’ (reverse); for CA9 5’-GCT AAG CAG CTC CAT ACG CT-3’ (forward) and 5’-GCC AAA CAC CAA GGC TAG GA-3’ (reverse); for GLS1 5’-GTT TGC TGCGTA CAC TGG AG-3’ (forward) and 5’-GTT ATT CCA CCT GTC CTT GGG-3’ (reverse), and for 18s rRNA 5’-CGC GGT TCT ATT TTG TTG GT-3’ (forward) and 5’-AGT CGG CAT CGT TTA TGG TC-3’ (reverse).
The mRNA was isolated from kidney homogenate, which was prepared by placing 100 mg kidney tissue in a 1.5 mL microtube, followed by the addition of 0.5 mL tripure isolation reagent (Roche). Then RNA was isolated according to the procedure described in the kit’s manual. Relative expression of mRNA was accomplished using real time RT-PCR Mini Opticon (BIO-RAD) with software Bio-Rad CFX Manager. Each reaction mixture contains 1 mL RNA template (equivalent to 100 ng RNA), 0.2 mL forward primer, 0.2 mL reverse primer, 13.4 mL nuclease-free water, 0.2
mL KAPA-RT (real-time) Mix and 5 mL KAPA
SYBR® FAST master mix.
The PCR reaction proceeds using KAPA SYBR FAST One-step quantitative real time-polymerase chain reaction (qRT-PCR) kit. According to the procedure, complementary deoxyribonucleic
acid (cDNA) was synthesized at 42°C for five
minutes, KAPA RT mix inactivation at 95°C, five minutes. PCR cycles and detection (39 cycles) for 10 sec at 95°C, 30 sec at 56°C, and 30 sec at 72°C. For melting curve analysis, one minute at 95°C, one minute at 55°C and five sec at 55°C (80 cycles, the temperature increased 0.5°C each cycle). The
reaction was performed in duplo for each sample.
As negative control, we prepared another tube which was filled with nuclease-free water instead of template RNA.
Protein assays
The relevant proteins as gene products were studied in two ways. HIF-1α was assayed using HIF-1α ELISA Kit for Rat (Cusabio). As the two other proteins (CA and GLS) are enzymes, it is more convenient to assay them by means of their respective specific activity. Total tissue protein in all experiments was measured by
Warburg-Christian technique.5
Total CA specific activity was measured by using para-nitrophenyl acetate (pNPA) as a chromogenic substrate. In principle, CA will hydrolyze the ester bond and release para-nitrophenol (pNP) and acetic acid. The absorbance of the yellow color of the product pNP can be measured quantitatively at λ = 348 nm in equimolar amount with the substrate pNPA. One unit of specific activity is defined as the amount of enzyme needed for catalyzing the conversion of 1 mmol pNPA/
minute at room temperature (RT).6 The reaction
mixture consists of 750 mL pNPA 0.03 mM, 50 mL sample or organ homogenate and 700 mL tris sulfate buffer 0.1 M (pH = 7.4). The absorbance is read after 3 minutes of incubation at RT. For blank, 750 mL of pNPA is mixed with 750 mL tris buffer.
The glutaminase activity is measured by
counting the number of NH3 (in the form of NH4+)
released by the enzyme using Nessler reagent.
The absorbance of the reaction product of NH4+
and Nessler reagent is measured at 400 nm. The reaction mixture, containing 500 mL 1% of L-glutamine in 0.01 M phosphate-citrate buffer pH = 7 and 500 mL sample or homogenate, is incubated for 60 min at 37°C. At the end of this period, the enzymatic reaction is stopped by adding 250 mL of 1.5 M trichloroacetic acid (TCA) solution. The precipitated proteins are separated by a brief centrifugation at 5,000 rpm for five minutes, 5 mL of supernatant was added to 1,945 mL distilled water, followed by adding 50 mL
Nessler reagent.7,8
Statistical analysis
The results of each measurement were analyzed using ANOVA for significance, and as its alternative, we used Mann-Whitney test and Kruskal-Wallis if the data distribution was not normal. Pearson correlation test was performed for correlation analysis. All of the test was analyzed using SPSS 16.0 statistical programme.
Statistical significance was set at p < 0.05.
RESULTS
HIF-1α
Figure 1A shows the relative expression of HIF-1α at the mRNA level. 18s rRNA was used as control gene and quantification was made by using Livak
were normalized to the control. It is seen that the expression was decreased to less than 50% of the control on first day and increased progressively, later. Though at the end of experiment (seven th day) there was a slight decrease, the level was still much higher than control (p < 0.05 in Kruskal-Wallis test). There was a significant
difference between first day hypoxia group
with fifth day hypoxia group (Mann Whitney, p = 0.005) and between first day and seven th day hypoxia group (Mann Whitney, p = 0.009), marked with (*) sign. However, the same pattern was not found in HIF-1α protein, which gives a relatively constant, with certain fluctuation, amount of this protein, as showed in figure 1B (ANOVA, p > 0.05). The other study with same model, using mice as research sample, by Prijanti found that the mRNA and protein of HIF-1α increased significantly with the corresponding
pattern (strong correlation).10
Carbonic anhydrase (CA)
At the level of mRNA, we measured the
Figure 1. A) Relative expression of HIF-1α mRNA in kidney
tissue of rats induced by systemic hypoxia (10% O2) for 1,
3, 5, and 7 days; B) HIF-1α protein in kidney tissue of rat in
-duced by systemic hypoxia. *: p < 0.05 vs control group.
expression of a particular enzyme of CA family, the CA9. 18s rRNA was used as control gene and quantification was made by using Livak
method.9 On the other hand, at the level of the
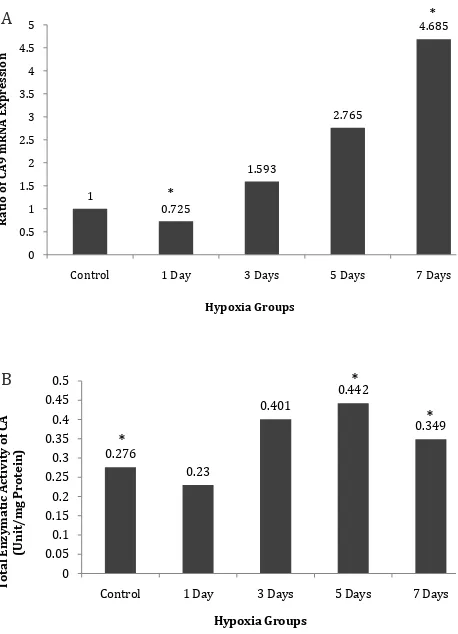
protein’s enzymatic activity, we measured total specific CA activity, not only the activity of CA9. Figure 2A shows clearly the constant increase of CA9 mRNA to day-7, after a decrease in day-1 (p < 0.05 ANOVA-LSD test). There is a significant difference between the control group and day-7 hypoxia group (LSD, p < 0.005), marked with (*) sign. Specific activity of total CA, which was measured as total enzymatic activities per mg of total homogenate protein (unit/mg protein), is presented in figure 2B. In a similar pattern as with CA9 mRNA, but not absolutely parallel, total CA enzyme activity increased after a slight decrease in day one. There were significant differences between the groups according to Kruskal Wallis (p < 0.05), and significant differences of controls with day-5 and day-7 in the hypoxia group (Mann-Whitney, in both cases p < 0.05), marked with (*) sign.
Figure 2. A) Relative expression of CA9 mRNA in kidney tissue of rats induced by systemic hypoxia (10% O2) for 1, 3, 5, and 7 days; B) Total enzymatic activities of CA in kidney tissue of rats
induced by systemic hypoxia . *: p < 0.05 vs control group.
Glutaminase (GLS)
Glutaminase-1 shows a decrease of mRNA expression on days one and three followed by a sharp increase on day five and a slight decrease from day five to day seven, as presented in figure 3A. There are significant differences between control and hypoxia groups (p < 0.05 in Kruskal-Wallis test) marked with (*) sign. 18s rRNA was used as control gene and quantification was
made by using Livak method.9 Total enzymatic
GLS activity, presented as unit/mg protein of kidney tissue, as shown in figure 3B indicates also an increase on days-3 and -5 (ANOVA, p < 0.05). There were significant differences
between control group and first, fifth, and
seventh day hypoxia group.
DISCUSSION
HIF-1α is a subunit of HIF-1 and a constitutive protein, which means it is synthesized
Figure 3. A) Relative expression of GLS1 mRNA in kidney tissue of rats induced with systemic hypoxia (10% O2) for 1, 3, 5, and 7 days; B) Enzymatic activities of glutaminase in kidney tissue
of rats induced by systemic hypoxia. * p < 0.05 vs Control group.
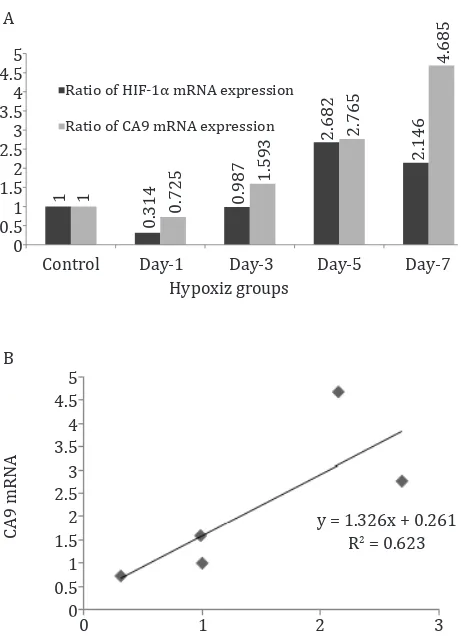
Figure 4. A) Comparison of HIF-1α and CA9 mRNA in kidney
of rat under systemic chronic normobaric hypoxia (10 % O2);
B) Correlation between HIF-1α and CA9 mRNA
continuously. However, it is immediately
degraded if cellular oxygen is at sufficient level.11
In normoxia condition, HIF-1α is hydoxylated
at prolyl residues (Pro402 and Pro564) by a prolylhydroxilase (PHD). Once hydroxylated, HIF-1α will be recognized and bound by von Hippel-Lindau (VHL) protein, then ubiquitinylized and
eventually degraded by proteasomes.12 This
degradation cascade does not occur in hypoxia; the stabile HIF-1α is translocated into the nucleus and combines with HIF-1β, to form HIF-1 which binds to hypoxia response element (HRE) of the promoter of target genes. Further, a number of genes, which are essential for survival in lack of oxygen, are up-regulated in order to ensure the
oxygen supply to the whole body,13 first proven for
erythropoietin (EPO), subsequently for vascular
endothelial growth factor (VEGF),and renin.14-17
Eckardt, et al17 reported the phenomenon that
kidney has a relatively high HIF-1α level.The
anatomical structure of the vascular system
1 Ratio of HIF-1α mRNA Expression
Ratio of CA9 mRNA Expression
Hypoxia Groups
Control Day-1 Day-3 Day-5 Day-7 Hypoxiz groups
Control Day-1 Day-3 Day-5 Day-7 Hypoxiz groups
Control Day-1 Day-3 Day-5 Day-7 Hypoxiz groups
Ratio of HIF-1α mRNA expression
Ratio of CA9 mRNA expression
in the kidney is considered to be the cause of relative hypoxia. Some blood can diffuse from intrarenal arterioles to the small veins by-passing
the capillaries.18 Consequently, a number of cells
may undergo hypoxia. This may be the reason, why in our experiments, changes in HIF-1α are statistically not significant: even in normal external oxygen condition HIF-1α protein level
is relatively high. This is not the result of de novo
synthesis, because the level of mRNA expression is low. However, kidneys still respond to external hypoxia, as indicated clearly by the change in HIF-1α mRNA during our experiments. Correlation of HIF-1α mRNA and HIF-1α protein is moderate, which means that there are other factors beside the genetic one, which play a role in maintaining a relatively high level of HIF-1α.
Kidneys are very important for the maintenance of acid-base balance and need the function of CA. CA9 is one of the main CA isoforms in kidney and also well known as indicator of hypoxia state in an organ. In this study, the CA9 response increased progressively in time course, mRNA as well as protein (enzymatic activities). There is a good correlation between HIF-1α mRNA and CA9 mRNA (Figure 4, p < 0.05).
CA9 facilitates the H+ excretion and acidifies
urine. However, urine pH cannot decrease below 4.5 which means that another mechanism is
needed to prevent further pH decrease.19 For
this purpose, kidney is equipped with GLS.
This enzyme produces NH3 from glutamine by
deamidation. NH3 binds H+ to produce NH
4
+ which
is excreted in the urine. In this way, kidney can
maintain the acid-base balance by increasing H+
excretion without decreasing urine pH beyond
the limit.20 We observed that mRNA level and
enzymatic activities increased clearly. There is a good correlation between HIF-1α mRNA and glutaminase mRNA (R = 0.975, p < 0.05). However, strong correlation and statistical significance do not mean automatically that there is a causal relationship between both and any mRNA cannot directly regulate another mRNA. We can only claim that both parameters respond in the same way to the same situation.
Because hypoxia increases H+ concentration in
blood, glutaminase mRNA is increased in response to this condition. However, it is not clear, whether mRNA expression responds to the hypoxic
condition or to the decrease of pH, probably both conditions can regulate glutaminase expression.
In general, it can be said that kidney, in constant relative hypoxia, is equipped with mechanisms
which can respond to the increasing H+ production
as a result of hypoxia, by up-regulating HIF-1α, CA9 and glutaminase. Because both enzymes are very essential in kidney function, which can undergo various types of perturbation, the regulation of their expression could be under several factors. It has been reported that glutaminase is activated through phosphorylation when cells are activated
by epidermal growth factor (EGF).21 On the other
hand, EGF is under the control of HIF-1.22 It was
also reported that kidney glutaminase is regulated
at a post-transcriptional level.23 In other words,
the enzyme could be in its phosphorylated form, as mentioned above, or in another form.
In conclusion, this study showed that during chronic systemic hypoxia, expression of CA9 and GLS 1 mRNA was increased as a response to
increased H+ levels and related to the expression
of HIF-1α mRNA.
Acknowledgment
The authors would like to acknowledge DRPM UI for providing funds for this study through Riset Utama Universitas Indonesia.
Conflict of interest
The authors affirm no conflict of interest in this study.
REFERENCES
1. Alterio V, Hilvo M, Di Fiore A, Supuran CT, Pan P, Parkkila S, et al. Crystal structure of catalytic domain of the tumor-associated human carbonic anhydrase IX. Proc
Natl Acad Sci U S A. 2009;106(38):16233-8.
2. Pastorekova S, Ratcliffe PJ, Pastorek J. Molecular mechanisms of carbonic anhydrase
IX-mediated pH regulation under hypoxia. BJU Int.
2008;101(Suppl4):8-15.
3. Phypers B, Pierce JMT. Lactate physiology in health and disease. Anes Crit Pain. 2006;6(3):128-32.
4. Kovavevic Z, McGivan JD. Mitochondrial metabolism of glutamine and glutamate and its physiological
signifinance. Physiol Rev. 1983;63(2):547-605.
5. Sing KW, Sofian-azirun M, Tayyab S. Protein analysis of Chrysomya megacephala maggot meal. Anim Nutr Food
Tech. 2012;12:35-46.
6. Özdemir H, Küfrevioğlu OI, Çetinkaya R. Effects of
II patients with diabetes mellitus. Turk J Med Sci.
2000;30:135-41.
7. Imada A, Igarasi S, Nakaham K, Isono M. Asparaginase
and glutaminase activities of micro-organisms. J Gen
Microbiol. 1973;76(1):85-99.
8. Nathiya K, Nath SS, Angayarkanni J, Palaniswamy
M. Optimised production of L-glutaminase: a
tumour inhibitor from Aspergillus flavus cultured on agro-industrial residues. Afr J Biotechnol.
2011;10(63):13887-94.
9. Livak KJ, Schmittgen TD. Analysis of relative gene expression data using real-time quantitative PCR and the 2(-Delta Delta C(T)) method. Method. 2001;25(4):402-8.
10. Prijanti AR. Peran hypoxia inducable factor -1α dalam
pengaturan ekspresi renin [dissertation]. Jakarta:
Universitas Indonesia; 2010. Indonesian.
11. Gunaratnam L, Bonventre JV. HIF in kidney disease and development. J Am Soc Nephrol. 2009;20(9):1877-87. 12. Haase VH. Hypoxia-inducible factors in the kidney. Am J
Renal Physiol. 2006;291(2):F271-81.
13. Semenza GL. Hypoxia-inducible factor-1: oxygen
homeostasis and disease pathophysiology. Trends Mol Med. 2001;7(8):345-50.
14. Maxwel P. HIF-1: an oxygen response system with
special relevance to the kidney. J Am Soc Nephrol. 2003;14(11):2712-22.
15. Stroka DM, Burkhardt T, Desbaillets I, Wenger RH, Neil DA, Bauer C, et al. HIF-1 is expressed in normoxic
tissue and displays an organ-specific regulation under
systemic hypoxia. FASEB J. 2001;15(13):2445-53.
16. Ziel KA, Campbell CC, Wilson GL, Gillespie MN. Ref-1/ Ape is critical for formation of the hypoxia-inducible transcriptional complex on hypoxic response element of rat pulmonary artery endothelial cell VEGF gene. FASEB
J. 2004;18(9):986-8.
17. Eckardt KU, Bernhardt WM, Weidemann A, Warnecke C, Rosenberger C, Wiesener MS. Role of hypoxia in
pathogenesis of renal disease. Kidney Int Suppl.
2005;99:S46-51.
18. Sherwood L. Human physiology: from cells to systems.
8th ed. USA: Brooks/Cole Cenage Learning; 2010. 19. Hilvo M, Rafajová M, Pastoreková S, Pastorek J, Parkkila
S. Expression of carbonic anhydrase IX in mouse tissues. J Histochem Cytochem. 2004;52(10):1313-21.
20. Harper HA. Review of physiological chemistry. 15th ed.
California: Lange Medical Publications. 1973.
21. Thangalevu K, Pan CQ, Karlberg T, Balaji G, Uttamchandani M, Suresh V, et al. Structural basis for the allosteric
inhibitory mechanism of human kidney-type glutaminase
(KGA) and its regulation by Ref-Mek-Erk signaling in
cancer cell metabolism. PNAS. 2012;15(109):7705-10.
22. Chun YS, Kim MS, Park JW. Oxygen-dependent and -independent regulation of HIF-1alpha. J Korean Med
Sci. 2002;17(5):581-8.
23. Edwards JR. Amino acid metabolism: The urea cycle and
urea cycle disorders. In Fulfillment for the requirements