CHAPTER 1
INTRODUCTION
1.1. Background
Today, industry in the world including in
Indonesia is growing fast. Every company has to compete
each other to survive. One of the ways to make the
company survive is to reduce the expenses. Production
department also has a contribution to the expenses.
Then one of the ways to reduce it is to make a good
scheduling which can minimize the expenses.
Scheduling, according to Burbidge (1971) is
determining when and where each operation needed to
make or assemble a product to be started. Production
time is related with production cost, if production
takes long time to be done, so the production cost
needed will be higher.
Makespan is total time needed to complete a group
of jobs (Stevenson, 2005). It is the length of time
between the start of the first job and the completion
of the last job in the group. Therefore production
schedule which can minimize makespan is needed.
The Production System Laboratory of UAJY has a
long-term research about the effect of product
structure complexity ( Bill of Material / BOM), routing
process, and ratio from setup and run time in makespan
than one level of the component. Product structure
complexity consists of number of level and number of
items in one level. Routing complexity consists of
number of machines and operations.
In this research, variable which will be evaluated
is lot size. Lot size is the quantity of product which
will be processed. The experiment with some size of lot
size is expected to produce minimum makespan. Optimum
lot size is lot size decision which gives the minimum
makespan.
The result of makespan is also influenced by setup
and run time. Setup time is time needed to prepare
machine before it starts the operation. Run time is
time needed to process some products in the operation.
The calculation of setup and run time ratio is average
of set up time divided by optimum lot size times
average run time.
The number of item to be produced in this thesis
is 45 and lot sizes examined are 5, 9, 15, and 45.
Product structure used in this research is 4 levels of
product structure with maximum parts are 4 in each
level.
1.2. Problem Statement
Based on the background, the problem is to know if
there is the effect of lot size and product structure
complexity in makespan minimization on multilevel
product scheduling.
1.3. Research Objectives
a. To define the makespan and optimum lot size of
each product structure and routing file.
b. To define if there is effect of product structure
complexity due to optimum lot size.
1.4. Scope of Research
The scopes of this research are:
a. Multilevel product used in this research is 4
levels and maximum 4 parts in one level.
b. The number of machine used is 3 machines. And one
machine represents to one process.
c. The operation of each part is 3 operations.
d. The number of item to be produced is 45 products.
e. The lot sizes examined are 5, 9, 15, and 45.
f. There are 4 replications due to generation of
routing file.
g. There is no variation of process sequence in each
routing file.
h. Set up time is varied from 5-10 min/lot and run
time is varied from 1-5 min/unit.
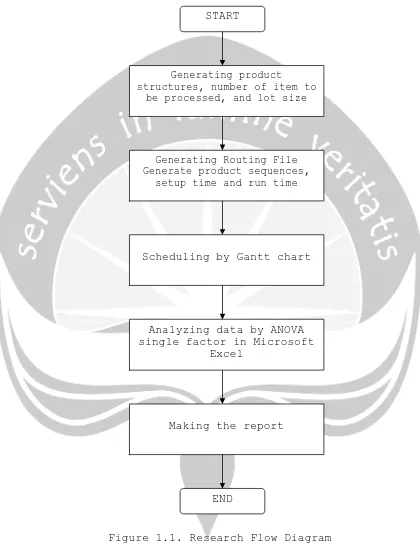
1.5. Research Methodology
There are four steps used in this research.
The steps are:
a. Generating data
Product structure is generated from possible
combination. It’s generated for 4 levels and
research it used only 10 of them which have been
chosen by several reasons. The reasons will be
evaluated in chapter 5. There are 4 routing file
replications had been generated, each routing file
has the same operations and work centers. The
difference is on the setup time and run time which
is generated by random number.
b. Data Processing Step
The Gantt chart is made manually by Microsoft
Excel program in computer to obtain the makespan
of each lot size for each product structure and
routing file. Lot size that result the minimum
makespan is called optimum lot size.
c. Analyzing Step
Minimum makespan and optimum lot size will be
analyzed by ANOVA Single Factor.
d. Making report
Make final report of the research, after the data
and result is obtained.
1.6. Report Outline
This thesis consists of 6 chapters:
Chapter 1: INTRODUCTION
This chapter provides background, problem
statement, research purpose, research
methodology, and report outline.
Chapter 2: LITERATURE REVIEW
This chapter provides list of earlier
researches and the differences between
the earlier researches and the current
research.
Chapter 3: BASIC THEORY
This chapter provides the basic theories
from books and internet as the reference
of the research.
Chapter 4: DATA
This chapter contains all the data needed.
The data consists of product structure,
routing file, and lot size.
Chapter 5: DATA ANALYSIS
This chapter discusses about the analysis
of research result.
Chapter 6: CONCLUSION and SUGGESTION
This chapter provides conclusion and
suggestion from the research.
START
END
Generating product
structures, number of item to be processed, and lot size
Generating Routing File Generate product sequences,
setup time and run time
Scheduling by Gantt chart
Analyzing data by ANOVA single factor in Microsoft
Excel
[image:6.612.99.519.107.650.2]Making the report