Enhancing Productivity Through Lean Behavior
A. Perumal Puvanasvaran
Technical University of Malaysia Malacca
Malaysia
1. Introduction
Productivity is a measure of output from a production process. It reflects the efficiency of production. A change in technology today, however, might increase production output with a given quantity of inputs, such an increase in productivity would be more technically efficient, but might not reflect any change in allocative efficiency. Lean initiatives that focuses on tools and techniques, often stumble as excitement from initial achievements diminishes and the lean way becomes more difficult. Behavioral change is the key to making lean initiatives sustainable and successful. Lean behavior on the other hand, improves the problem solving capabilities of people in the development system while eliminating wastages, reducing cost, increasing efficiency and enhancing productivity.
Furthermore, lean is one of the popular concepts that have been implemented in many companies. According to Bhasin and Burcher (2006), very few companies succeed in implementing lean manufacturing practices. The number of lean tools, techniques and technologies available to improve operational performance is growing rapidly, however a few companies that put effort to use them failed to produce significant results. One of the major reasons for unsuccessful implementation of lean manufacturing is the typical behaviors exhibited by people at the workplace, which are known to be deficient in trust and gain commitment too. Orr (2005) stated that the term “lean” manufacturing seems to have forgotten the debate on human motivation, and has focused on techniques, where the emphasis has been on deploying new methods, rather than understanding how work is organized and lead. The practice of lean behavior is shown to be an essential element for producing healthy work environments that can lead to economic improvement. At the same time, lean produces as stated by Emiliani (1998). Emiliani and Stec (2004) that lean behavior practices must apply all the lean principles where most companies failed to apply all the lean principles together in order to get significant result. It is essential that the right behavior among organization employees is maintained, so that the full benefits of lean can be enjoyed as stated by Sanjay and Peter (2006). Implementation lean is a long journey process and not easily implemented. To fully benefit the company for lean implementation, both the concept and techniques should be considered. Lean behaviors typically are essential factor and should be assessed for a successful and complete implementation.
the people in the development system. The importance of the problem solving capabilities of people in implementing lean process management will be also discussed. The survey was to conduct in an aerospace composite manufacturer in their kitting department. Self-administered questionnaire has been selected to be the survey instrument in enhancing productivity. These questionnaires were distributed to 45 employees working in the kitting department. Results of the findings and feedback are collected and analyzed by using the Statistical Package for Social Science (SPSS) software. The outputs of the analysis were in the form of index values, percentages and hypothesis testing. The result shows the improvement on lean behavior with the help of people development system implementation which enhance the people capabilities in eliminating wastages, reducing cost and increasing productivity. These are supported by comparing the results of surveys on lean behavior for the beginning and end of the year with the monitoring of real life data on the case study.
2. Lean behavior
A survey was conducted by interviewing the top management, middle management and the shop floor. The top management barrier to implement the tool related to issues of communication and power. There were concerns that middle managers and supervisors may feel threatened by the perceived loss of control as shop floor staffs gain more power to use initiatives and make certain changes without consultation with line managers. Even they felt that there were difficulties when it came to making decisions regarding throwing away certain pieces of equipment and machinery that are very old, do not work and take up valuable space. Middle management representatives commented that the 5Ss started off well but dwindled in certain areas. It was because they lost interest and it fell down on custom and practice/self-discipline. They also felt that they should have more power to make decisions relating to their positions. Shop floor felt that some employees had attitude problems, and put minimum effort into their jobs and were not bothered to use or implement the 5Ss, while others were actively involved. Besides, they also commented that their initiative was sometimes held back by their line managers. It was felt that certain line managers were fearful of their subordinates shining and potentially threatening their position. As a result, they did minimum and took no interest in the initiatives of 5S that were likely to be protected by their line managers. From the survey, it was clear to show that the management behavior is the important barrier to implement the lean tool. In Table 1, lean behaviors practices of impact lean manufacturing are highlighted.
Table 1.Component and Lean Behaviors Practice Of Impact Lean Manufacturing
3. Tips to build lean behavior
The organizational vertical integration has parallels input values with other lean disciplines such as lean behaviors are therefore important. Positive organizational behavior which is linked to human resource strengths and psychological capabilities for performance improvement and productivity enhancement in today’s workplace. Worker inappropriate behaviors are difficult to change because they are functional: they serve a purpose as an employee. The practice of lean behaviors is shown to be an essential element for producing healthy work environments that can lead to economic growth, as well as help businesses sustain efforts to become lean producers. The principal focus is on how individuals can consistently behave in ways that create value, with the goal of eliminating waste in both intra and interpersonal relationships M.L. Emiliani (1998).
Several tips that leaders can use to improve their team lean behavior. Such as:
1. Defining lean behavior
Most people like to see the correct or the right way of handling work but the correct or right way is not always clear. They might think of doing a right way without looking into lean principals. Lean wants problems and abnormal conditions to be exposed and no wastage nor costliness. Leaders have to make sure that doing the right way doesn’t have a high cost to team members.
2. Rewarding who has lean behavior
When the demand for goods is decreasing, workers stop to do overtime. The leader needs to thank to workers for their action. If the workers continue doing their overtime, they are doing it for the wrong reason and that is to increase the overhead cost of the company. Some people like to bypass a process to make things happen quickly. Leader should stop rewarding them of heroism. This might be sending a wrong message. 3. Making system support lean behavior
Leaders must make the workplace look like 5S environment that support lean behavior. Workers will do and follow what the leader normally says. If the workers keep collecting data without analyzing it or no change is being made. Do you think this system support lean behavior? Definitely not! This will lead to wasting of time and expenses.
4. Building up a right lean behavior team
When people see others exhibiting good behavior, they are more likely to continue or follow it. Leaders need to set up a good example of team that can perform good lean behaviors so that others will follow the right steps and procedures.
5. Eliminating problem members in the team
If a member doesn’t meet productivity and quality standards after repeated attempts to work with in order to improve, then get a new member. If a customer has expectations that are unreasonable and unprofitable to company, find more customers and nothing to say that you need to deal with them. If an employee chooses not to show lean behavior, they may not be a good match for the team.
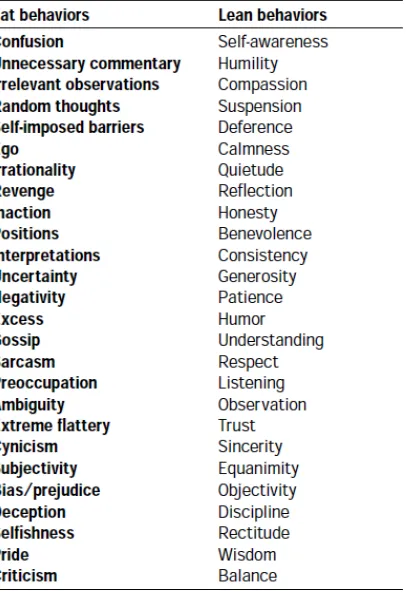
4. Comparison of behavior attributes
compares common fat behaviors that result in waste and selected lean behaviors that promote flow between people as stated by Cleary (1989) and (1996). It is important to realize that interpersonal skills and organizational effectiveness are developed by practicing and improving upon weaknesses (i.e. lean behaviors), not strengths (i.e. fat behaviors) as mentioned by M.L. Emiliani (1998).
Table 1.aComparison Of Behavior Attributes by Cleary (1989) and (1996).
5. Do lean behaviors correlate with productivity?
The answer is probably yes, when we consider the practice of lean behaviors as shown to be an essential element for producing healthy work environments that can lead to productivity growth, as well as help production sustain efforts to become lean producer. The principal focus is on how individuals can consistently behave in ways that create value (lean behavior), with the goal of eliminating waste in interpersonal relationships and development of people that possess basic capabilities for problem solving in their thoughts and actions. If the performance of lean behaviors can be practiced by individuals and then integrated into the organization, the productivity will definitely be enhanced by lean behavior.
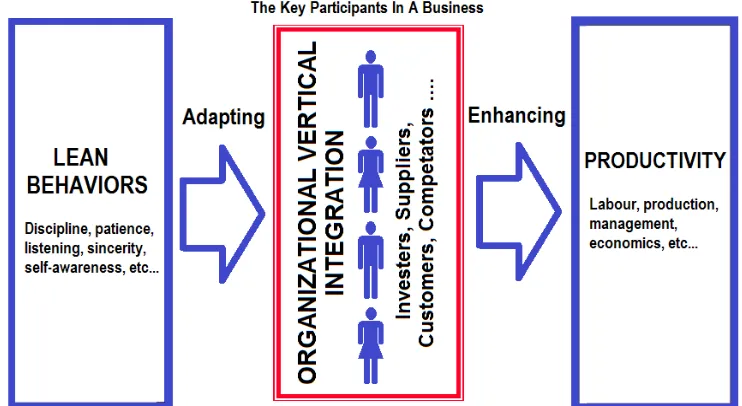
fully lean organization can only be reached if the employees are well aligned with new philosophy. In that case, it is important for an organization to understand and apply all lean behavior practices and principles, in addition to a comprehensive lean thinking which affects the whole business model as a key and not solely learner production. Figure 1 shows the key participants in a business, each having a relationship governed by processes and behaviors governing generative relationships. Each of these relationships should be carefully managed in order to minimize waste and maximize the benefits to productivity enhancing.
Fig. 1. Enhancing Productivity Through Lean Behaviors In A Business
6. Background of case study
The Company where the case study was conducted was incorporated on 16th August 1994. Currently, numbers of employees are 1155 person. The nature of business for this company is to manufacture composites components for aero and non aero structures. The name of this company is changed to ABC in terms of confidential issues. ABC was given a mandate by the government to spearhead Malaysia’s foray into the high technology industry of aerospace and composites manufacturing.
region and a known industry player in the world. Though ABC having start to implement Lean Manufacturing System since 2004, but there are some mistakes and frailness due to the lack of implementation which is observed as in production system, where the knowledge and understanding of lean manufacturing system as common and primary root cause problem. The whole of problems occurred throughout from the top level to the bottom. Due to this, the top management commitment, teamwork, and people capabilities in eliminating wastages are also lacking. Furthermore, the problems occurred because the lean implementation was not linking to the individual, department, and company’s key performance indicator which was unmotivated the total employees of the company to practice the real of lean concepts. Therefore, based on this reality the lean behavior among the employees never rooted. Effectively in the end of 2006, the company overcomes the past problems with new perspective of lean implementation by developing the integration and heuristic approach of lean concepts as a new strategy that involve all aspects of the company in their operation that correlated to the KPI. The scope of study for this project is conducted only at kitting department.
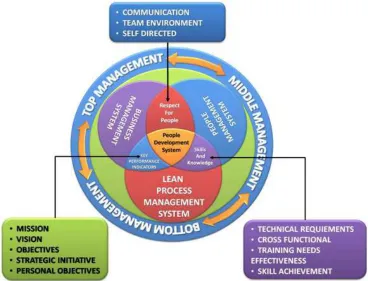
7. Developing a new system to productivity enhancing
Key performance indicator - KPI for every level such as company, department, section and individual levels which is linked towards the organization goal.
Respect for people – Respect for people which mainly focuses on the lean behaviors that each employee in organization should build in their mind.
Skill and Knowledge – Skill and Knowledge for employees will support them in practicing lean concept effectively and efficiently by utilizing the lean tool and techniques.
Another important element incorporated with this people development system framework is teamwork of top, middle and bottom management. The total commitment of all these three levels will enhance the productivity and the problem solving capability in lean process management among employees.
Fig. 2. PDS Framework for Enhancing Productivity and Problem Solving Capabilities Among Employees.
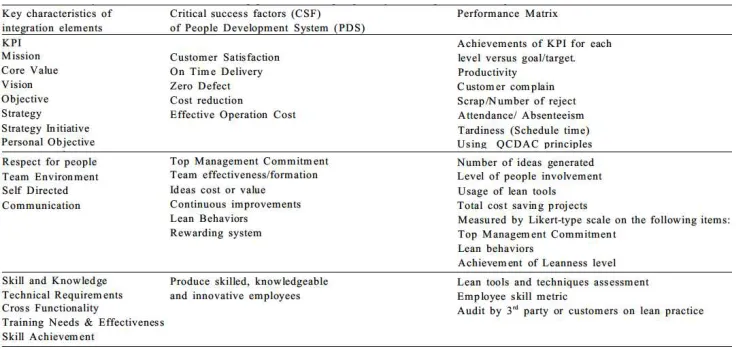
8. Key characteristic, critical success factors (CSF) and related performance
matrix
KPI in lean process management determination through Mission, Core Value, Vision, Objective, Strategy, Strategy Initiative and Personal Objective for people development system is crucial. This will align overall workforce of the company to follow one common goal. Each level has its own portion of contribution towards the target. The results are compared with the target or goal used to measure the success of KPI. The accumulation of success from each portion will reflect the overall achievement of the company goal.
Respect for people in lean process management is another crucial factor in developing the lean culture throughout organization. In order to measure the lean behaviors, top management commitment, leanness level of the company and perception of team member’s capability, Liker (2004) type scale is used to get the responses from respondent. For example, one can ask managers to rate the degree of support by top management on five-point scale from no support (1) to total support (5). Beside this, the problem solving capability also can be measured by counting the number of ideas generated, Level of people involved and the total cost of the project.
Skill and Knowledge in lean process management is the fundamental requirement for employees to equip themselves. Without this they can’t perform well in solving problem to identify and eliminate wastages. Lean tools and assessment techniques by using assessment criteria to determine the level of implementation using spider web chart with rating of 1 (beginning to introduce) to 5 (practice with excellent). Another measurement on employee skill metric will emphasize on employees skill and their cross functionality.
Table 2.An Analytical Framework For Measuring Problem Solving Capability In Lean Process Management
9. Methodology
categories which are; respect for people (RFP), continuous learning and improvement (CL&I) and process and result driven (P&RD). This is exactly to fulfill the Toyota “4 P model” Orr. For the RFP and CL&I, there are nine variables asked, and for P&RD, there are twelve variables to answer. The answers of questionnaire were using the four-point scale and circle the appropriate number. The response scale ranges from 1 to 4 representing the range of strongly agree, agree, disagree, and strongly disagree.
The index value is used to determine the strength and weakness of lean behavior practices. The index value is calculated by formula provided by Nesan and Holt (2002).
Index = [ ( n1 ) + 2 ( n2 ) +3 ( n3 ) + 4 ( n4 ) ] / [ 4 ( n1 + n2 + n3 + n4 ) ],
Where n1,…, n4 represent the number of respondents that indicated the respective practices
on the scale 1 to 4. The formula yields indices ranging from 0 to 1, where below 0.2 represent minimum strength and above 0.8 represents maximum strength
Nesan and Holt (2002). The second analysis is to determine the relationship or mean score of each level of management for each practice. Analysis of variance (ANOVA) is used to analyses situations in which there are several independent variables and how these independent variables interact with each other Field. Before calculating the ANOVA, one assumption must be considered is the score of variable is normally distributed. For the third analysis, correlation is used to measure the difference between each principle variables and how are they related. Before calculating a correlation coefficient, there are a few assumptions for correlation analysis which are normality and linearity Coakes (2005). Pearson’s correlation coefficient is a measure of linear association with the score for each variable is normal distributed. If the relationship is not linear and normal distributed, Spearman’s rho will be used to measure the correlation between the variables Coakes (2005).
9.1 Pilot test
Pilot test is conducted to ensure the finding from the questionnaire is valid and meet the objective of this project. This is done by sending the questionnaire to two lean expertise of the company. Discussion on the questionnaire was held when the company was visited. Opinion was given which help researcher to modify the questionnaire. Besides that, from the pre-test, the total time spend to answer the questionnaire also can be identified.
9.2 Sending and receiving questionnaire
questionnaire only rated by kitting area department for the last two level respondents. The feedback is received within two weeks from the company.
9.3 Analysis using SPSS
After getting the result from company, authors will use the software SPSS version 13 to make the analysis. In the 2 part of the question (about lean behavior), the outputs of the analysis were in the form of index values, percentages and hypothesis testing. In the literature review state that Emiliani and Stec (2004) explain lean behavior is applying lean principles and tools to improve leadership behaviors and eliminate behavioral waste.
10. Results and discussion
In order to assess the lean behavior before and after the lean implementation, a questionnaire was distributed and then an internal consistency analysis was used to evaluate the reliability of questionnaire.
10.1 Respondent rate
The questionnaire distributed directly to the employees to do the survey. The beginning of the year (January) questionnaire was distributed to 45 employees of the kitting department. However, 3 employees already resign. Thus, the questionnaire only assigned by 42 people and the feedback collected exactly 42 respondent results. At the end of the year, questionnaire was distributed to 44 people and collected back exactly 44 responds.
10.2 Reliability test
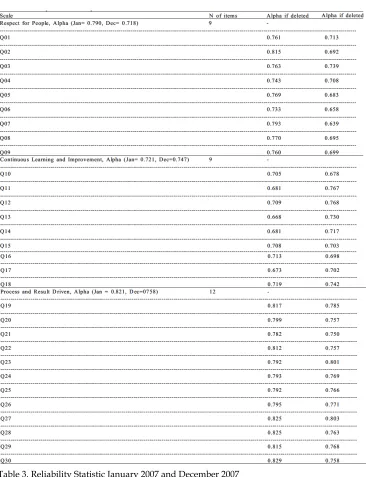
Internal Consistency Analysis: An internal consistency analysis was used to assess the reliability of questionnaire. It is an indicator of how well the different items measure the same issue. The measurement of internal consistency involve for calculation of Cronbanch’s coefficient alpha. The values of alpha range from 0 to 1 where the value close to 1 indicate higher reliability. Alpha value should be positive and usually greater than 0.7 which are considered acceptable for testing the reliability of factors. As shown in table 3, the alpha value for the January 2007 in the three categories range is from 0.721 to 0.821. For respect for People, the scale of reliability can be increased by eliminating Q02 which show 0.815. For Continuous Learning and Improvement, the scale of reliability it is better to include all of the nine questions and if any questions were eliminated, will reduce the scale reliability. Last but not least for Process and Result Drive, the scale of reliability can be improved by eliminating Q30 which show 0.829. For the December 2007 the alpha value in three categories ranges from 0.718 to 0.758. For respect for People, the scale reliability can be increased by eliminating Q03 which show 0.739. For Continuous Learning and Improvement & Process and Result Driven the scale of reliability were reduced Q12 and Q23,which show 0.768 and 0.801.
Table 3. Reliability Statistic January 2007 and December 2007
10.3 Analysis and results
the strength and weakness of lean behavior practices within the organization. Dimension 2 explored the relationship between the lean principles. For each dimension, four Likert (2004) scales ranging from 1 to 4 were provided and the scale was used is the agreement scale. Agreement scale is used to determine agreement on of the 30 lean behaviors practices, the scale ranged from 1 (strongly disagree) to 4 (strongly agree).
10.4 Analysis of strength and weakness of the lean behaviors practice
Data obtained from the survey were subjected to relative index calculations for agreement factor. The relative index was calculated by using the formula:
Index = [ ( n1 ) + 2 ( n2 ) +3 ( n3 ) + 4 ( n4 ) ] / [ 4 ( n1 + n2 + n3 + n4 ) ],
Where n1, n2 , n3 , n4 represent the number of respondents that indicated the respective
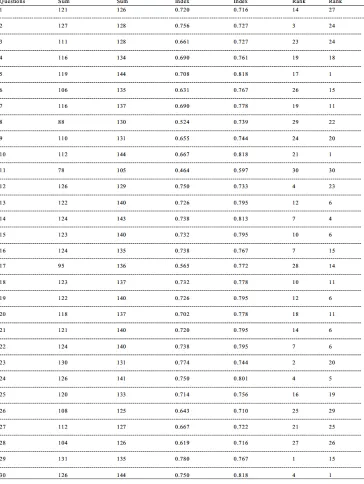
practices on the scale 1 to 4. The formula yields indices ranging from 0 to 1, where below 0.2 represent minimum strength and above 0.8 represents maximum strength Nesan and Holt (2002). From the table 4, the indices calculated for all of the lean practices showed a similar pattern, with indices ranging between 0.464 and 0.78 for January 2007. For the December 2007, the range is between 0.597 and 0.818. In addition, the min index for 30 practices also increased from 0.691 to 0.7614, total increments is about 10%. This indicates that lean behavior practices in aerospace composite manufacturer are improved, and it is near to the lean behavior standard. After comparing the 2 group of index, we found that the index for the practices is increased a lot. Such are:
Meetings start on time.+0.215
People from outside areas help to solve problems.+0.207
People share ideas and knowledge.+0.151
However, there is also some practices need to be improved where the indices show dropped. Such practices are:
People contribute openly and honestly in the meetings I attend.-0.029
People are coached and trained by their leaders/Supervisors.-0.017
People deliver what was promised.-0.013
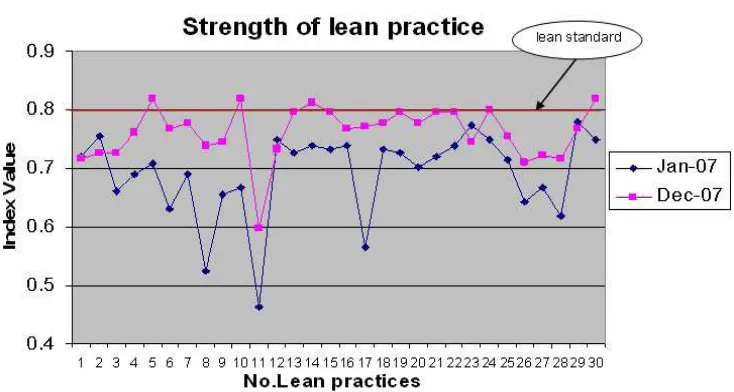
Basically, for the new result, many performances were practiced very well. It can be seen clearly In Figure 3 and the sum of index of practices is increased a lot and meets the lean behavior standard (0.800) already. The results are better if compared with the January 2007 which is totally negative and only one practice meet the lean behaviors standard. Below are the practices that meet the standard:
Before making decisions, people gather the information –from 0.708 to 0.818
People share ideas and knowledge-from 0.667 to 0.818
People are encouraged to improve their knowledge and skills at work -0.738 to 0.813
People look for ways to improve their work –from 0.750 to 0.801
People focus on the customer and the customer need (inside and outside the plant) - from 0.750 - 0.818.
Plant leadership is on the plant floor daily to provide assistance and improve the business is 0.597. However; the index also improved already, for the Jan 2007 just 0.464.
Beside the index, after comparing the 2 group of ranking the authors found that the ranking for the practices also change drastically. These are:
People share ideas and knowledge, it is raise 20 rank, from ranking 21 raise to 1. It is the biggest lift practices:
Before making decisions, people gather information. It is raise to 16 rank, from ranking 17 raise to 1.
People from outside help to solve the problem. It is raised 14 rank, from ranking 28 raise to 14.
Fig. 3. Strength of Lean Practices.
The result at Table 5 shows that the increment respects for people was the highest. The practices for RFP such as, people contribute openly and honestly in the meeting will give employees operational autonomy encouraged an innovative culture and let employee contribute more ideas to solving problems. Furthermore, the practices “people can participate in decision relevant to their job and focus on the problem” in RFP also got strong relationship with PSC. In a study among the employees of a manufacturing plant, it found a positive relationship between participation and employees' innovative behavior, measured using self-ratings of employees' suggestions and implementation efforts will contribute to the idea of solving problem.
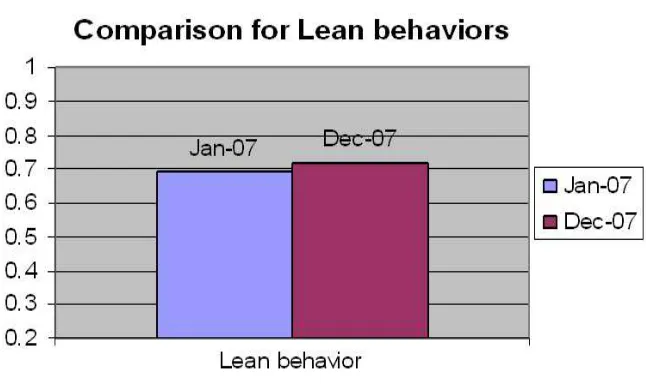
The Figure 4 shows that index value of three main categories which all have significant increase. Especially, respect for people, which is increased from 0.67 to 0.773. This is followed by continuous learning and improvement raised from 0.679 to 0.763 and the process and results driven shows improvement from 0.653 to 0.698 in each. Overall the results shows the company improved in all 3 construct, Thus, we can say, the company really put a lot of effort in practices lean behavior as shown in the comparison of lean behaviors in Table 8 and Figure 5. In conclusion, authors found that most practices of the lean behavior will improve the PSC of the employee. Thus, after implementing lean process after one year, problem solving capability of employee had been increased and make the lean result of company increase.
Fig. 4.Lean Behaviors Index Value
10.5 Analysis of the relationship between the lean principles
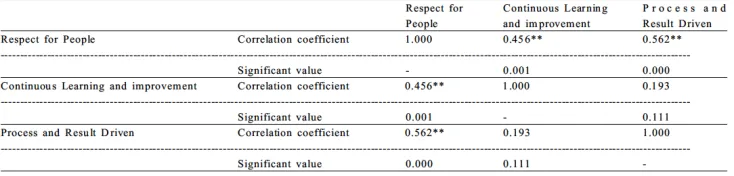
Correlation between Respect for People, Continuous Learning and improvement and Process and Result Driven are shown in Table 6 and Table 7. The data obtained was analyzed by using Statistical Package for Social Science (SPSS) software version 13. Correlation method was used where correlation is a measure of relationship involving variables Field. Table 6 and Table 7 show a matrix that is displayed giving the correlation between the three variables. For the January 2007correlation coefficient 0.587 between
Respect for People and Continuous Learning and Improvement is 0.456, and the significance value of this coefficient is 0.001. But for December 2007, the values become 0.129, and significance value is 0.202 while the correlation coefficient between Respect for People and Process and Result Driven is 0.526 with the significance value is 0. But for new result it is 0.101 and the significance value is 0.258.last but not least, correlation coefficient between Continuous Learning and improvement and Process and Result Driven is 0.193 with the significance value is 0.111. For new result is 0.310 and 0.020.
Table 7.Correlation between Factors In December 2007
Table 8. Index Value of Lean Behavior In January 2007 and December 2007
Fig. 5. Comparison for Lean Behaviors.
11. Success of people development system in case study company
11.1 Idea generated and level of involvement
Many studies focus mainly on the creative or idea generation stage of problem solving. In this context, employees can help to improve business performance through solving problem, such as generating ideas and use them as building blocks for new and better products, services and work processes Joreon. P.j.de.long (2007). From the graph shown below, every week at least one idea had been generated in kitting department, and the highest is 5 ideas generated per week. In past one year, a total of 139 ideas have been generated .It is proved that kitting department proactively and continually sought ideas to solve problems, indicates that employees have the capability to solve problem to become a central tenet of lean manufacturing best practice Kerrin (1999).
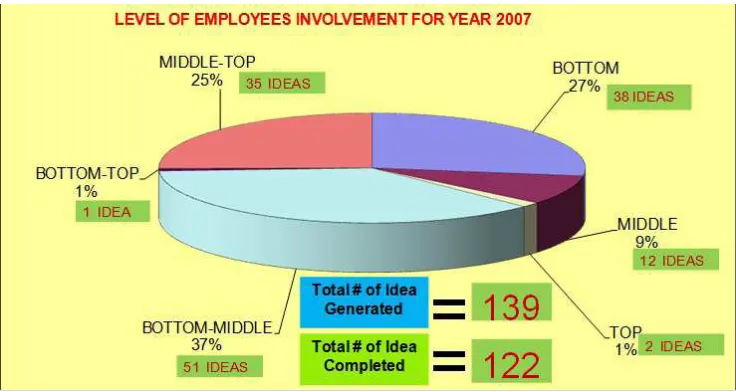
The employee involvement is categorized according to three main levels which are top, middle and bottom management. The Figure 6 below shows the level of involvement of employees by generating ideas for the year 2007. The highest contribution is coming from bottom level which is 38 and followed by middle level with 12 to top level which is 2. Besides this, there is also a combination level involvement in generating ideas. Bottom-middle level is 52, Bottom-middle-top is 35 and bottom-top is 1. Furthermore, total idea generated for group combination level is 87 and single group level is 52. The percentage for combination level is 63% for total ideas generated and 3 type levels is 37%. However if we compare 2 groups, the result shows that total idea generated by group combination level is 35 more than single group level. Thus, the result indicates the teamwork of bottom; middle and top management in both sharing and applying knowledge for generating ideas in solving problems that are important Delbridge et al (1998).
Fig. 6.Level of Employee's Involvement for Year 2007
11.2 Total of wastages
waste for company is the waste of space which is 39, the second one is time waste at 21, and the lowest waste is transportation which is at 5. Without classification of any wastage into performance measurement, no monitoring can be made and no problem solving can be done to reduce the waste, where the impact is the failure of lean process management implementation A.P. Puvanasvaran et al (2008). It indicates that the employees of the company have capabilities to solve waste problem using the performance measurement.
Fig. 7. Type of Wastage Eliminated for Year 2007.
11.3 Cost saving
Cost saving is an important standard to indicate the problem solving capability of the organization. The aim of lean manufacturing is elimination of waste in every area of production and includes customer relations, product design, supplier networks, and factory management. To meet the objectives of saving cost, Womack and Jones (1996). Kitting department ran a Kaizen Project in 2007, and the total amount of saving for reduces wastages in past one year is RM1, 952,617.98. Thus, achievement of cost saving for company indicates employee had contributed most of the solutions to solve the problem of waste. So, it can be construed that problem solving capability of employees actually improved significantly. The Table 9 indicates total cost savings of the kitting department with the reference to their kaizen project generated form the problem solving activities.
12. Lean tools used in problem solving and productivity enhancing
In general, lean tool for kitting department can be categorize to 9 types as shown in Figure 8, such as five S, total productive maintain, Kaizen, visual stream map, visual indicator, just in time, and standard work chart. The most common tool used by kitting department is TPM, which is 62 times, followed by 5s, 55 time and mean values of using lean tool is 21 times. In the past one year, the kitting department total used 189 times of lean tool. In order to introduce lean thinking within manufacturing environment, the philosophy relies on the identification and elimination of the waste problem, which have effectively targeted and applied the various lean tools B.J. Hicks (2007). Thus, the frequency of employee using the lean tool indicates employee understanding identification and elimination of waste problem. In deduction, the employees have capability of problem solving.
13. KPI achievement
KPI is an important element that enables the achievement of vision, mission, core value, strategy, and the personnel objective for people development is crucial. Achievement of KPI shows the evidence of people involvement to drive high performance to gain stakeholder and customer satisfaction. Monitoring on each performance, measurement and counter-measurement taken to solve any problem occurring have contributed to the achievement of KPI.
The Table 10 shows total monthly man hours percentage of Overtime at kitting department has set the limit to be below 12% for the year 07. During PDS implementation, overtime was controllable all the time; not even a month exceeded the limit of overtime, which eventually gave a value of 11.5% for the whole year. It indicates that the company has saved considerably on labors cost in the past one year. The cost saving is due to employee success in lowering the stop time for the machine DCS 1, DCS 2, DCS 3.
The table also shows the achievement for the value scrap is 1.97% which achieved the goal of 2.6%. The reason why the value is achieved is because the employees use the PDS methods to solve many scrap problems such as material dry and ply damage for the whole year. Complaints on product produce from internal and external customer shows null. It shows that quality of kitting department undergone significant upgrading due to problem solving capability of employees.
The Kitting department of the Company has gained benefits from many elements that have not been monitored before, the implementation of PDS. Wastages have reduced dramatically. Thus, the achievement KPI proves that productivity and problem solving capability has increased.
14. Conclusion
The purpose of this project has been to evaluate the improvement for the lean behavior possessed by the company in past one year. It reflects the enhancing productivity through lean behavior. The result show lean practices had been making improvement of the company in lean direction and important of problem solving capabilities in eliminating waste and saving cost thus, enhancing productivity. The results have provided support to the two proposed hypotheses. Besides that, evidence was found to support the relation between improvements of kitting department with problem solving capability on enhancing productivity through lean behaviors of employees in the organization.
The main findings show that the company is improving in past one year. Initial result of the kitting department was in moderate level stage to become lean, but result at the end of the year showed that they had nearly meet the high level stage of lean they need to keep their efforts in order to have productivity success in lean manufacturing implementation. It is also helpful to the company to recognize the importance of increased problem solving capability and productivity enhancing for employee to eliminate waste by adapting lean behaviors. In short, we are all looking toward “Better Productivity Through Better Lean Behavior”.
15. References
[1]Puvanasvaran, A.P., B.H. Tan, M.H.M.A. Megat, Tang S.H, Muhamad, M.R, A.M.S. Hamouda, 2008c. “Degree Of Leanness And Managerial Commitment In An Aerospace Company” Journal of Statistics and Management System, Vol. 11, No. 4, pp. 653–673, ISSN 0972-0510, Taru Publications, India.
[2]Puvanasvaran, A.P., M.H.M.A. Megat, Tang S.H, Muhamad, M.R, A.M.S. Hamouda, 2008a. “A Review of Problem Solving Capabilities in Lean Process Management” American Journal of Applied Sciences Vol.5 No. 5, 2008,ISSN 1546-9239 © 2008 Science Publications, pp: 504-511.
Journal of Productivity, National Productivity Centre, Petaling Jaya, Malaysia, 25 pp: 29-44.
[4]Anon, 1997. “Case study: Guiding cultural change at Motorola”, Management Development Review, 10(4/5): 185–187.
[5]Bhasin, S. and P. Burcher, 2006. “Lean viewed as a philosophy”, Journal of Manufacturing Technology Management, 17(1): 56-72.
[6]Cleary, T. (1989), Zen Lessons – The Art of Leadership, Shambhala, Boston, MA. [7]Cleary, T. (1996), The Human Element, Shambhala, Boston, MA.
[8]Coakes, S.J., 2005. SPSS: Analysis without Anguish-version 12.0 for Windows, John Wiley & Sons Australia. Ltd, Queensland.
[9]Comm, C.L., 2005. “A case study in applying lean sustainability concepts to universities”, International Journal of Sustainability in Higher Education, 6(2): 134-146.
[10]Delbridge, R., 1998. “Life on the Line in Contemporary Manufacturing,” International Journal of operation & Production Management, Oxford University Press, Oxford.
[11]Emiliani, M.L. and D.J. Stec, 2004. “Leaders lost in transformation”, Leadership and Organization Development Journal, 26(5): 370-387.
[12]Emiliani, M.L., 1998. “Lean behaviors”, Management Decision, 36/9, pp: 615– 631. [13]Field, A., 2005. “Discovering Statistics Using SPSS”, Sage Publications, pp: 107.
[14]Hicks, B.J., 2007. “Understanding and eliminating waste” international Journal of information Management.
[15]Jeroen, P.J. and N.D.H. Deanne, 2007. “How leaders influence employees' innovative behavior. Emerald Group Publishing Limited, pp: 761-771.
[16]Kerrin, N., 1999. Managing Innovation and Change: A Critical Guide for Organizations, Thomson, London.
[17]Liker, J.K., 2004. The Toyota Way: 14 Management Principles from the World’s Greatest Manufacturer. McGraw Hill: New York.
[18]Nesan, L., Jawahar and D. Holt Gary, 2002.“Assessment of organizational involvement in implementing empowerment ” , Integrated Manufacturing Systems, 13/4, pp: 201-211.
[19]O'hEocha, C., 2000. “Case studies: A study of the influence of company culture, communications and employee attitudes on the use of 5Ss for environmental management at Cooke Brothers Ltd”, The TQM Magazine, 12.(5): 321±330.
[20]Orr, C., 2005. “Lean Leadership in Construction”, Management of People and Team, Proceedings IGLC-13.
[21]Ronald, M. Becker, 2001. “Automotive Manufacturing and Production ” ,
http://www.findarticles.com/p/articles/mi_m0FWH/is_6_113/ai_76445159 (accessed on June 2001).
[22]Sanjay Bhasin & Peter Burcher, 2006. “Lean viewed as a philosophy”, Journal of Manufacturing Technology Management, 17 (1): 56-72.