IEEE Instrumentation and Measurement Technology Conference
Anchorage, Alaska,
zyxwvutsrqponmlkjihgfedcbaZYXWVUTSRQPONMLKJIHGFEDCBA
USA, 21-23 May, 2002Uncertainty of Mean Value and Variance Obtained from Quantized Data
zyxwvutsrqponmlkjihgfedcbaZYXWVUTSRQPONMLKJIHGFEDCBA
Giovanni Chiorboli
Dipartimento di Ingegneria dell'hformazione, University of Parma
Parco Area delle Scienze 181/A, Parma PR, 1-43100, ITALY
giovanni.chiorboli @unipr.it
zyxwvutsrqponmlkjihgfedcbaZYXWVUTSRQPONMLKJIHGFEDCBA
Abstract
zyxwvutsrqponmlkjihgfedcbaZYXWVUTSRQPONMLKJIHGFEDCBA
-
This paper aaiiresses the problem of recovering the mean valueand the variance of an input signal from the ou@ut ahla
zyxwvutsrqponmlkjihgfedcbaZYXWVUTSRQPONMLKJIHGFEDCBA
of a granular quan-tizer. Particular emphasis is
zyxwvutsrqponmlkjihgfedcbaZYXWVUTSRQPONMLKJIHGFEDCBA
dedkated to the measurement uncertainly withand without dither. Known geneml results are applied to random Gaussian
zyxwvutsrqponmlkjihgfedcbaZYXWVUTSRQPONMLKJIHGFEDCBA
and uniformly distributed signals and to deterministic sinusoidal signals.
Index Terms
-
Quantkation noise d e l , quanfization e m r , dikher, analog-lo-digifal conversion, measurement uncertainty.
I. INTRODUCTION
The effect of a deterministic quantizer with quantization steps
zyxwvutsrqponmlkjihgfedcbaZYXWVUTSRQPONMLKJIHGFEDCBA
q is usually modeled by an additive, signal-independent noise,
uniformly distributed in ( - q / 2 , q / 2 ) , with mean square value
of q2/12 and white spectrum [l] - [8]. Therefore, the mean
value
zyxwvutsrqponmlkjihgfedcbaZYXWVUTSRQPONMLKJIHGFEDCBA
ps and the variance 0:of thenon
quantized input signalzyxwvutsrqponmlkjihgfedcbaZYXWVUTSRQPONMLKJIHGFEDCBA
x
are obtained from the mean value and the variance of the quantized data X Q :(1)
A
~ X Q= E { X Q }
and, respectively,
Such an approximation simplifies the analysis, but it is appli- cable only if the quantization step is sufficiently small when compared to the standard deviation of the input signal. When this does not apply, the quantization error becomes apparently correlated with the input signal, since the distribution of the quantized output depends on the input offset position within the quantization cell [7], [12], so that the meaning of any mea- surement appears questionable.
In this paper it is proposed a general mathematical model for estimating the systematic contribution to the uncertainty. Sec- tion I1 resumes the state of the art of the statistical analysis of the quantization and Section I11 presents the mathematical framework with some examples.
11. STATISTICAL ANALYSIS OF QUANTIZATION:
STATE OF THE ART
Let
x
( X Q ) represent the input (output, respectively) signal ofthe quantizer, let v = X Q
-
x
represent the quantization er-ror, and let ~ ( x Q / x ) represent the channel profile [9], i.e. the
A
probability of X Q conditioned by x. By assuming P ( X Q / X )
independent of the channel position
x,
it can be shown that the quantization step, defined as qe
S_+,"p(xQ/x)dx, does not depend on XQ. If, moreover, the profile is symmetrical with respect to the center of the channel, it is possible to write~ ( x Q / x ) =
~ ( x
- X Q ) = ~ ( X Q -x),
where y(x)zyxwvutsrqponmlkjihgfedcbaZYXWVUTSRQPONMLKJIHGFEDCBA
= p ( O / x ) . In this case, the characteristic functions of the output code and ofthe quantization error, i.e. E{ej""Q} and E{ejwU}, are
A
k=+m
( P x Q ( U )
e
as(w
- 2 n k / q ) r ( w-
2 n k / q ) (3)k=- 00
and, respectively,
k = + m
W U )
5
( ~ ~ ( 2 ~ k i q )r ( w
- 2 7 ~ 7 )(4)
k=-m
where (Pz ( w ) is the characteristic function of the input signal
x and r ( w )
5
~ ~ ~ - y ( x ) e j w z d ; c [3], [4], [9].It is well known that, for a given channel profile, the moments of X Q and v can be evaluated from the characteristic functions (3) and
(4)
U11.A. Rectangular profile: the deterministic quantizer
The rectangular profile represents a deterministic, uniform quantization law [ 101 where the input
x
is compared to a cer- tain number of transition levels which partition the input range in disjoint intervals, so that only one digital code X Q corre-sponds to a given input voltage range. In the particular case of a rounding quantizer, the quantization law is given by
( 5 )
where
1x1
is the greatest integer less than or equal tox.
How- ever, because of the ADC's internal noise, the deterministic law represents only an ideal approximation, but it is convenient to ideally assume a noiseless quantizer with a noisy input signal.Since the transformation of the rectangular channel profile is
that, for a symmetric distribution of the input signal, the mean
and the mean square values of
zyxwvutsrqponmlkjihgfedcbaZYXWVUTSRQPONMLKJIHGFEDCBA
vare
zyxwvutsrqponmlkjihgfedcbaZYXWVUTSRQPONMLKJIHGFEDCBA
given byand, respectively, by
where R{s}
zyxwvutsrqponmlkjihgfedcbaZYXWVUTSRQPONMLKJIHGFEDCBA
( S { s } ) is the real (respectively, the imaginary)part of s.
Similarly,
zyxwvutsrqponmlkjihgfedcbaZYXWVUTSRQPONMLKJIHGFEDCBA
E { ~ Q } = E { z }zyxwvutsrqponmlkjihgfedcbaZYXWVUTSRQPONMLKJIHGFEDCBA
+
E { v } and E { z $ } = E { z 2 }zyxwvutsrqponmlkjihgfedcbaZYXWVUTSRQPONMLKJIHGFEDCBA
+
E { v 2 }
+
2 E { z v } , whereand &,(U)
4
zyxwvutsrqponmlkjihgfedcbaZYXWVUTSRQPONMLKJIHGFEDCBA
daX(w)/dw.By indicating with
zyxwvutsrqponmlkjihgfedcbaZYXWVUTSRQPONMLKJIHGFEDCBA
px the mean value of z, and assuming s =z
-
px, it can be shown that [7]zyxwvutsrqponmlkjihgfedcbaZYXWVUTSRQPONMLKJIHGFEDCBA
A
w
{
ax
(T)
zyxwvutsrqponmlkjihgfedcbaZYXWVUTSRQPONMLKJIHGFEDCBA
}
= COS ( 2 n k $ )as
( y )
(9)and
and that,
8
{
6,
(
y )
}
= cos ( 2 7 r k F )68
(
y )
-
where Q S ( w )
zyxwvutsrqponmlkjihgfedcbaZYXWVUTSRQPONMLKJIHGFEDCBA
is the characteristic function of s.The above equations point out a well known dependence of the statistics of the quantized data on the position within the quantization channel of the mean value of the input distribu- tion. When the quantization noise model represented by (1)
and (2) is applied, for instance, to the analysis of Gaussian input distributions with standard deviations sufficiently small, the estimates of px and ux can be affected by a relevant error since
aP(w)
does not vanishes for (wI 2 27r/q. The Sheppard'sapproximations (1) and (2) are affected by bias errors, that are given by
(12)
A
ell, = jlx
-
pz = E { v }and, respectively, by
A
where U; E { v 2 } -
(E{v})'
and uxv = E { z v }-
pxE{v}.The maximum values of the deviations ep= and eu; were inves- tigated in [7], [ 121, which derived a general expression of these deviations for sinusoidal, uniformly distributed and Gaussian signals.
111.
ANALYSIS
OF THE UNCERTAINTYIn general epT and eu2 can not be c o m t e d , because of their dependence on the unknown values of ux and pZ, so that they contribute to the measurement uncertainty together with the statistical fluctuations of pas and U&.
In the following paragraphs, the systematic contribution to the uncertainty will be directly calculated from the above equa- tions rather than from the maximum values of the bias errors, since ell= and e,,2 can not be usually considered uniformly dis- tributed between zero and the maximum.
m(y))' dpx) represent the mean value (the variance, respec- tively) of a generic function y = y(px). It can be easily demon- strated that
m(e,,) = 0 7 (14)
and that
The expression of .(e,,:) is much more complicated but, for the cases of interest, it can be approximated by
mku;:) = 4 e p , ) . ( 1 6 )
Although the above equations already represent a close-form expression of the bias error contribution, it is more practical to
use simpler but reasonable expressions.
If @ ? ( 2 n k / q )
<<
k2G,2(2.rr/q) V k>
1, .(ep2) can be approxi- mated bySimilarly, if Q z ( k )
<<
Ic4Q:(l) V k>
1, whereQs(lc)
a8(27rk/q)
-
( 2 ~ k / q ) a8(2nk/q), v(e+) becomesFinally, m(.) and U ( . ) have to be combined as
d
m
in order to obtain the type B uncertainty U B ( . ) [131.
Fig. 1. Type B uncertainty in the measurement of the
zyxwvutsrqponmlkjihgfedcbaZYXWVUTSRQPONMLKJIHGFEDCBA
mean value. of aGaussian distribution.
zyxwvutsrqponmlkjihgfedcbaZYXWVUTSRQPONMLKJIHGFEDCBA
A. Gaussian noise
The characteristic function of a random Gaussian noise with
zero mean value and variance U:
zyxwvutsrqponmlkjihgfedcbaZYXWVUTSRQPONMLKJIHGFEDCBA
iszyxwvutsrqponmlkjihgfedcbaZYXWVUTSRQPONMLKJIHGFEDCBA
s G (U) =
zyxwvutsrqponmlkjihgfedcbaZYXWVUTSRQPONMLKJIHGFEDCBA
e - O . 5 0 2 ~ ~ .zyxwvutsrqponmlkjihgfedcbaZYXWVUTSRQPONMLKJIHGFEDCBA
(20)Therefore,
v
zyxwvutsrqponmlkjihgfedcbaZYXWVUTSRQPONMLKJIHGFEDCBA
( ep5 ) and v ( euz ) are approximately given byand, respectively, by
Fig. 1 shows the exact value of the type B uncertainty of
E ,
zyxwvutsrqponmlkjihgfedcbaZYXWVUTSRQPONMLKJIHGFEDCBA
u ~ ( p ~ )
m,
and the approximate value obtained from (21). The maximum bias error is plotted in the same figure: notice that the ratio between the maximum value and the un- certaity u g ( p z ) is equal to &for ux>
0.25q and tends tofi
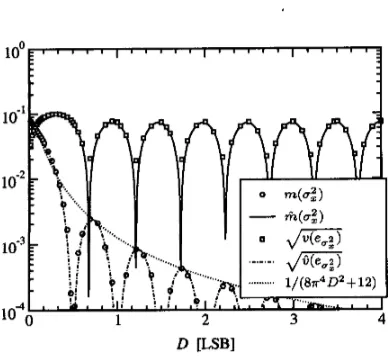
only when ux tends to zero.The two contributions to the type B uncertainty of uz are shown in fig. 2. It is interesting to observe that the maximum value of the bias error is approximately given by "(e,?) M
&(U:)
+
dm,
zyxwvutsrqponmlkjihgfedcbaZYXWVUTSRQPONMLKJIHGFEDCBA
and that, for ux<
0.3q, this expression ismore accurate than those reported in the cited literature.
B. Uniform noise
The characteristic function of the uniformly distributed noise
zyxwvutsrqponmlkjihgfedcbaZYXWVUTSRQPONMLKJIHGFEDCBA
h
Fig. 2. Systematic contributions to the measurement uncertainty of
02
for a Gaussian noise.that disappears much more slowly than for the Gaussian noise. The variance of the bias error e,, can be approximated by
1 2 3 4
Fig. 3. lLpe B uncertainty in the measurement of the mean value of an uniform distribution.
The asymptotic envelopes of the type B uncertainty of is
[image:3.613.316.511.98.255.2]l o 0 g
Fig. 4. Systematic contributions to
zyxwvutsrqponmlkjihgfedcbaZYXWVUTSRQPONMLKJIHGFEDCBA
zyxwvutsrqponmlkjihgfedcbaZYXWVUTSRQPONMLKJIHGFEDCBA
the measwematzyxwvutsrqponmlkjihgfedcbaZYXWVUTSRQPONMLKJIHGFEDCBA
uflceftainty ofzyxwvutsrqponmlkjihgfedcbaZYXWVUTSRQPONMLKJIHGFEDCBA
zyxwvutsrqponmlkjihgfedcbaZYXWVUTSRQPONMLKJIHGFEDCBA
U: = D2/3 for the
zyxwvutsrqponmlkjihgfedcbaZYXWVUTSRQPONMLKJIHGFEDCBA
uniformly distributed noise.shown in fig. 3 and, obviously, the maximum value of the error
zyxwvutsrqponmlkjihgfedcbaZYXWVUTSRQPONMLKJIHGFEDCBA
elm is given by
f i
ug(pCLa).zyxwvutsrqponmlkjihgfedcbaZYXWVUTSRQPONMLKJIHGFEDCBA
The standard deviation and themean value of e,; are shown in fig. 4, where it is apparent that
the asymptotic envelope of w(e 2 ) is given by q 2 / ( R 2 f i )
for D
>
412.C.
SinewavezyxwvutsrqponmlkjihgfedcbaZYXWVUTSRQPONMLKJIHGFEDCBA
A sinusoidal signal with amplitude
A
is characterized by the characteristic functionF
@ s s = Jo(wA) (26)
where Jo(.) is the zero-order Bessel function of the first kind. Even more than the previous signals, the sinewave is not band-
limited, i.e. its characteristic function does not vanishes for
Iw(
2
2 ~ / q - E (E>
0) and, therefore, the quantization noise model cannot be applied. The proposed model, approximates the variance of the error e,, asand the variance of the error e,; as
where
J1
(.) is the first-order Bessel function of the first kind. Even in this case (18) and (19) allows determining with a good agreement the two components of the systematic contribution to the uncertainty, as shown in figures5
and 6. The upperbound of the type B uncertainty of pCLa is
zyxwvutsrqponmlkjihgfedcbaZYXWVUTSRQPONMLKJIHGFEDCBA
m a x ( u B ( p z ) )q2/(J2Aq.rr4+12q2), while that of
q m / n 2 .
Fig. 5. B Uncertainty in the measmment of the mean value of a
deterministic sinewave.
1 0 y " ' I " " I " ' ' I " " I " '
Fig. 6. Systematic contributions to the measurement u n c e h t y of
U: = A 2 / 2 for the sinewave.
D.
Dithered sine waveAn other interesting consequence of the proposed equations
(18) and (19) is that they can be also applied to nonsubtractive dithered quantizers. When dither is added to the input signal, the characteristic function of the input signal, Q8(u), becomes
Q 8 ( w ) = Q U ( w ) Gd(w), where U and d account, respectively,
[image:4.616.99.293.81.259.2] [image:4.616.319.525.89.455.2]of the input, the dither signal must have a triangular probabil-
ity density function of peak-to-peak amplitude equal to
zyxwvutsrqponmlkjihgfedcbaZYXWVUTSRQPONMLKJIHGFEDCBA
29 (i.e.zyxwvutsrqponmlkjihgfedcbaZYXWVUTSRQPONMLKJIHGFEDCBA
zyxwvutsrqponmlkjihgfedcbaZYXWVUTSRQPONMLKJIHGFEDCBA
@ ~ T ( w ) = sinc2(Aw))
zyxwvutsrqponmlkjihgfedcbaZYXWVUTSRQPONMLKJIHGFEDCBA
[14].zyxwvutsrqponmlkjihgfedcbaZYXWVUTSRQPONMLKJIHGFEDCBA
However, in practical cases, thepeak-to-peak amplitude of the dither is only approximatively known and the transition levels of the quantizer are not equally spaced, so that making the peak-to-peak amplitude of the dither equal to the nominal value of q can be uneffective.
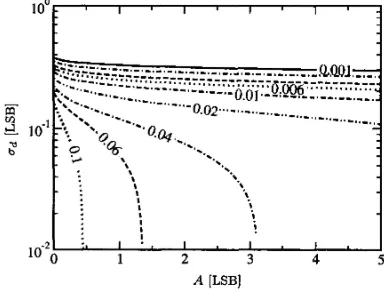
The reported equations allows quantifying the optimum value of the dither for a given signal, without referring to non-
practical hypotheses. Let consider as
zyxwvutsrqponmlkjihgfedcbaZYXWVUTSRQPONMLKJIHGFEDCBA
an example the sine waveof amplitude A with superimposed a nonsubtractive dither.
Gaussian dither added to the signal, changes the characteristic function of the input signal from (26) to
so that the maximum value of u ~ { p , } and of ,/.(eu:) be- and, respectively,
where
zyxwvutsrqponmlkjihgfedcbaZYXWVUTSRQPONMLKJIHGFEDCBA
U; = U $+
A 2 / 2 .Similarly, it is possible to determine u g { p z } and v(e+) for the uniform and triangular random dither. From the analytical expression of the maximum values of u e ( p Z } and v(eu:), it is easy to estimate the amount of dither that is necessary to
obtain
a given uncertainty. Fig. 7 shows, as an example, u ~ { p , } as a function of A and 0, for the Gaussian dither.
1oor----7
.-..-
.._...
'
zyxwvutsrqponmlkjihgfedcbaZYXWVUTSRQPONMLKJIHGFEDCBA
1
'.
I
'.
!
I !
! I
1
'
' 2'
' 3'
' 4'
' 5IV. CONCLUSIONS
A simple mathematical framework for estimating the system- atic contribution to the measurement uncertainty of mean value and variance has been provided. It has been verified for some typical distributions.
References
W.F. Sheppard. On the calculation of the most probable values of fkquencyconstants, for data arranged according to equidistant divisions
of a scale. Proc. of the London Mathematical Sociery,
zyxwvutsrqponmlkjihgfedcbaZYXWVUTSRQPONMLKJIHGFEDCBA
29, Part 2:353-380,1898.
W.R. Bennett. Spectra of quantized signals. Bell Syst. Tech. 1,27:446- 472,1948.
B. Widrow. Statistical analysis of amplitude quantized sampled data systems. Trans. Am,: Inst. Elec. Eng., Pt. 11, Applications and Industry,
79:555-568, January 1961.
G.A. KO" Hybridamputer techniques for measnring statistics from
quantized data. Simulation, 7~229-239,1965.
A. B. Sripad and D. L. Snyder. A necessary and sufii cient condition for quantization errors to be uniform and white. IEEE Trans. Acoust., Speech, Signal Processing, ASSP-25:442-448, October 1977. R. M. Gray. Quantization noise spectra. IEEE Trans. Information The-
ory, 36:1220-1244, November 1990.
I. Koll6I. Bias of Mean Value and Mean Square Value Measurements Based on Quantized Data. IEEE Trans. Instrumentation and Measure- ment, 43:733-739, October 1994.
B. Widrow, I. Koll6I and M.C. Liu. Statistical theory of quantiza- tion. IEEE Tmns. Instrumentation andMeasurement, 45353-361, April 1996.
I De. Lotto, S. Osnaghi. On random signal quantization
zyxwvutsrqponmlkjihgfedcbaZYXWVUTSRQPONMLKJIHGFEDCBA
and its effectsin nuclear physics measuremen& Nuclear Instruments and Methods,
56:157-159, 1967.
Methods and draft standardr for the dynamic characterisation and test-
ing of Analogue to Digital converters. European project DYNAD - SMT4-CT98-2214, http://www.fe.up.pt/Ilsm/dynad, Draft standard 3.4, July 2001.
A. Papoulis. Probability. Random Variables and Stochastic Processes.
New York McGraw-Hill, 1965.
P. Carbone, D. Petri. Mean value and variance of noisy quantized data.
Measurement, 23: 13 1-144, 1998.
I S 0 Guide to expression of Uncertainty in Measurement. International
Organization for Stanahniizarion, ISO, Ginevra, CH, 1993.
R. A. Wannamaker, S. P. Lipshitz, J. Vanderkcmy, J. N. Wright A theory of nonsubtractive dither. IEEE Trans. on Signal Pmcessing, 48:49%516, Feb. u)oo.
A [LSB]
Fig. 7. Contour plot of the type B uncertainty in the measurement of the
[image:5.613.97.289.453.599.2]