KARYA TULIS
TECHNOLOGY JOURNAL REPORT
ON SELECTION SYSTEM
A Critique on
Long-term impacts of logging in a
tropical rain forest – a simulation
study
Oleh :
RAHMAWATY
DEPARTEMEN KEHUTANAN
FAKULTAS PERTANIAN
KATA PENGANTAR
Puji syukur penulis panjatkan kepada Tuhan Yang Maha Esa, yang telah
memberikan segala rahmat dan karunia-Nya sehingga KARYA TULIS ini dapat
diselesaikan. Judul yang dipilih adalah “Long-term impacts of logging in a tropical rain
Forest – a simulation study”.
Tulisan ini merupakan suatu kritik mengenai TECHNOLOGY JOURNAL REPORT
ON SELECTION SYSTEM, ditulis oleh : A. Huth, T. Ditzer dan bersumber dari Journal
Forest Ecology and Management 142 (2001) 33-51.
Kami menyadari bahwa karya tulis ini masih jauh dari sempurna, oleh karena itu
kami mengharapkan saran dan kritik yang bersifat membangun untuk lebih
menyempurnakan karya tulis ini. Akhir kata kami ucapkan semoga karya tulis ini dapat
bermanfaat.
Medan, Mei 2006
CONTENTS:
I
Title of the Study
1
II
Rationale, Background and Objectives of the Study
1
2.1. Rationale of the Study
1
2.2. Background of the Study
1
2.3. Objectives of the Study
2
III Methods
2
3.1. The site
2
3.2. The rain forest growth model
2
3.3. Parameterization
5
3.3.1. Tree geometry
5
3.3.2. Biomass balance
5
3.3.3. Regeneration and mortality
5
3.4. Model validation
6
3.5. Logging scenarios
6
IV Results and Discussion
7
4.1.
Results
7
4.1. 1. Results for selected logging scenarios
7
4.1.2. How sustainable are the different logging scenarios?
8
4.2. Discussion
13
V Conclusion
14
VI General Comments on the Paper
14
A Critique on
Long-term impacts of logging in a tropical rain
Forest – a simulation study
By:
RAHMAWATY
Author: A. Huth, T. Ditzer
Journal: Forest Ecology and Management 142 (2001) 33-51
I. Title of the Study
•
As a researcher, the title provided by the authors has the element of simplicity, brevity,
specificity and subject matter focused. The reader can easily determine what the
study is all about and what it tries to investigate (
Long-term impacts of logging – a simulation study), where? In
a tropical rain forest; Brief title but it would be better if the
author mention the specific location to make more informative.
•
The keywords used such as “
Long-term impacts of logging in a tropical rain forest”. The
title gives the implicit meaning that the logging in tropical rain forest (Malaysia) using
the selection system, so the reader can easily understand that the concern of the
research study is related to silviculture. Clearly indicate that the subject matter is in the
field of silviculture.
II. Rationale, Background and Objectives of the Study
2.1. Rationale of the Study:
• Logging operations in tropical forests often have severe impacts on the forests. Though only a small portion of trees is harvested, a large portion of the forest may be impacted.
The
authors looked into the
Long-term impacts of loggingusing the selection system
in a tropical rain forest (Malaysia), with a simulation study,
using model FORMIX 3 (simulation models for growth of tropical forest).The authors
will use the FORMIX3 model for investigating the long-term impact of different logging cycles.2.2. Background of the Study:
•
According the authors,
the logging cycle is an important factor which strongly influences the maintenance of the forest. Too short logging cycles which ignore the natural regeneration capability of the forest degrades it further from one logging operation to the next.•
The complexity of tropical forest ecosystems on the one hand and the long time scales on which harvesting influences the growth of the forest on the other hand renders experimental approaches for studying the impacts of repeated logging events extremely difficult.• Forest growth models normally focus on the trees in the forest. Thus, these models allow analysis if how the future forest structure will be modified by management, but they tell us little about other aspects of the ecosystem (animal populations, hydrological functions, soil conservation, and biodiversity). However, these aspects are more or less related to forest structure. Thus, several implications of timber harvesting on rain forest can be analyzed with such models.
• FORMIX3 (Huth et al., 1997, 1998) is a model for the simulation of the growth of tropical forest stands with a size of 1 ha. To apply the model to a given forest stand, the user must provide stem number distributions for the different species groups. Tree species must be grouped into functional groups according to their potential height and light demands. The model includes tree growth, mortality, regeneration, and competition as main processes.
2.3.
Objectives of the Study :
• For investigating the long-term impact of different logging cycles (the long-term changes in forest structure due to logging, influence has the logging cycle on yield and structure of the remaining forest, useful are low impact logging methods compared to conventional methods, the main differences concerning yield and forest structure) using the FORMIX3 model.
III. Methods
3.1. The site
• The Deramakot Forest Reserve is situated in Sabah (North Borneo/Malaysia, 5025’N,
117030’E) (appendix 1).
• Located just north of the equator, Deramakot has the perhumid climate typical of the inner tropics.
• Mean annual temperature is 278 and mean annual rainfall is about 3500 mm.
• Geologically, Deramakot is characterized by tertiary sediments, mostly sandstone.
• The soils are mainly Acrisols.
• They are poor in nutrients and easily eroded, especially when the protective plant cover is removed.
• The Deramakot Forest Reserve is situated between 130 and 300 m in altitude.
• The prevailing forest type is Dipterocarp lowland forest.
• The forest remained essentially undisturbed until this century. Commercial logging started in 1956; intensity of logging and logging damages vary widely.
3.2. The rain forest growth model
• The FORMIX3 model was developed for the simulation of tropical rain forests in Malaysia (Huth et al., 1994, 1998).
• As main processes, the FORMIX3 model includes tree growth, competition, regeneration, and mortality.
a. Species grouping and spatial structure
• Tropical forest stands are usually composed of a large number of species. For the purpose of investigating forest dynamics, it is useful to classify species into a small number of functional groups.
• the author use three growth characteristics for grouping (potential height, light demands for growth and regeneration) and derive five species groups for the Dipterocarp forest at Deramakot (Table 1).
Table 1. Functional groups derived for simulation of growth of lowland Dipterocarp forest in Malaysiaa
• For simulation the forest stand area is divided into small patches. These patches have the size typical of treefall-gaps as naturally created by dying large trees (20 m by 20 m).
• the author aim to describe the shifting stand mosaic, and we therefore simultaneously simulate several patches explicitly in their neighboring locations within the stand.
• The patches themselves are pictured as homogeneous and in each of the patches we adopt a stratification of the tree community into height layers: All trees of a certain species group with their top falling into the range of a certain height layer completely belong to that layer (a similar approach was pursued with a gap model by Fulton, 1991, 1993).
• the author thus describe stand structure in the following way: tree species are aggregated into five functional groups, the vertical structure of the canopy is separated into five height layers, and the heterogeneity across the stand area of 1 ha is represented by 25 patches of 20 m by 20 m.
b. Individual tree growth
• The model calculates the development of a forest stand based on collectives of trees, which each Includes the trees of one species group in a certain height layer of a single patch.
• Such a collective is characterized by the number of trees included and by the size of one representative tree.
• Using tree geometry relations, the size of a tree can equivalently be expressed in terms of its above-ground biomass B, height h, or diameter d (diameter at breast height), respectively (Bossel and Krieger, 1991, 1994; Schafer et al., 1992):
• The crown projection area is calculated from stem diameter d via the proportionality of stem diameter and crown diameter (UNESCO et al., 1978; Whitmore, 1984; Poker, 1993). Assuming
a fixed leaf area index LAI within crowns, the tree's leaf area LT follows from its crown projection area.
• The growth of the individual tree is based on the carbon balance.
• The carbon balance includes photo production P of the tree on the one hand and biomass losses due to respiration and renewal on the other hand (Bossel and Krieger, 1991, 1994):
• Photo production P of a tree is calculated from the tree's leaf area LT and its specific productivity:
B = above-ground biomass of tree SR = biomass loss rate
h0 = height to the base
h1 = to the top of the crown
• The specific productivity of the leaves at height h depends on the local irradiance I(h) inside the canopy.
• The dependence of specific photosynthetic productivity on irradiance is modeled using a Michaelis-Menten-type light response curve parameterized for each species group (M initial slope of light response curve, PMAX maximum photosynthetic production).
• Within the patch, light attenuation downwards in the canopy is calculated with respect to absorption by the higher located leaf area:
I(h) = light intensity at height h, IS = light intensity above the forest,
L(h) = total leaf area index from the top of forest to height h K = light extinction coefficient.
• Biomass losses are estimated in relation to tree biomass (Kira, 1978; Yoda, 1983). Losses are composed of renewal of roots, above-ground litter fall, and respiration of woody tree organs and leaves.
• The increments calculated for the representative trees change the size of the trees of a given collective and determine the transitions of trees from lower to higher layers.
• Thus, size and stem number are recalculated for each species group in any of the height layers and patches. In simulation, this recalculation is performed at monthly time steps.
c. Competition
• Two types of growth competition are defected in the model: competition for light and space. Shading of larger trees affects the carbon production of each tree and the regeneration (see Sections 2.2.2 and 2.2.4).
• The fraction of a patch covered by tree crowns is used as crowding index CI, which is calculated for every canopy layer:
di = diameter of the with tree in a canopy layer, AP =spatial size of a patch
• The tree mortality increases if the crowding index is higher than one (crowding situation).
d. Regeneration and mortality
• Besides individual growth, the processes of seedling establishment and tree mortality are also constrained by the local competitive situation. Both are therefore modeled on the patch level. The establishment of seedlings requires suitable micro-climatic conditions at the forest floor.
• In FORMIX3, light intensity at the forest floor is used to control seedling establishment.
• Unfavorable growing conditions are reflected in low increments and lead to increased mortality rates. Additionally, the crowding of trees of similar size, i.e. of trees in one height layer, is assumed to cause an increased rate of mortality.
e. Growth of the forest
• Individual tree growth, regeneration and mortality are the driving processes for the simulation of the forest growth in each patch.
• Total stand dynamic is synthesized from the development of the single patches by adding their interaction.
3.3. Parameterization
• The FORMIX3 model was parameterized for the Dipterocarp forest of Deramakot Forest Reserve.
• Some parameters are identified on the basis of general Dipterocarp forest characteristics reported in the literature, others are derived from locally available data or where specifically measured (Tables 2 and 3, see appendix).
3.3.1. Tree geometry
• The fixed ratios of the tree geometry model (stem biomass to the tree's total above-ground biomass and crown diameter to stem diameter) as well as the size dependent form factor are drawn from different studies in Dipterocarp forest in Malaysia and Indonesia and checked by additional data from Sabah or Deramakot.
• The leaf area index (LAI) of individual tree crowns is estimated from global stand LAI data and the typical size distribution of trees The light absorption coefficient K characterizing light attenuation in the crown is assigned its typical value
• The parameters of the biomass balance are critical, here especially those of photosynthetic production as they describe the plant's response to its light microenvironment. Therefore, quantum efficiency M and light saturated specific production PMAX as parameters of the light response curve were measured for the five functional groups
3.3.2. Biomass balance
• The biomass loss rate does not describe the response to the competition situation, but only determines the overall level of productivity.
• Within reasonable limits this value is then calibrated by comparing the simulated total above-ground biomass of climax-state with respective data for primary forest at Deramakot.
3.3.3. Regeneration and mortality
• Similar conditions are met concerning the species group specific parameters of the regeneration processes. Knowing that pioneer seed germination requires a considerable irradiance or, respectively, the suitable micro-climatic conditions indicated by an increased irradiance, the level actually needed is calibrated by comparing the abundance of pioneer trees in the simulated climax state with respective data for primary forest at Deramakot. For non-pioneer species only a minimum light requirement is assumed.
• Some detailed data exist for single species concerning the actual or potential establishment rates of seedlings under the required conditions. These data reveal the large (and partly systematic) natural fluctuations of recruitment and the uncertainty that therefore is to be expected to accompany any field data. Here, the respective parameter values for the single species groups can only be estimated from available data and again are calibrated using observed numbers of established seedlings in primary forest.
• For pioneers the author use the same relationship, but increase mortality rates by a factor of 8 to reflect much shorter lifetime of 30-40 years for the typical pioneers at Deramakot compared with several hundred years for non-pioneer species.
• In case of crowding, fixed mortality rates of roughly four times the average value for seedlings or larger trees respectively are applied.
• The probability of dying trees to tumble and damage a patch of forest is calibrated by adjusting the gap fraction of simulated stand area in climax state with typical data for primary forest with few natural disturbances as that at Deramakot.
• The gap formation by a falling tree is parameterized in analogy to investigations into the damages caused by tree harvesting.
3.4. Model validation
• The model in combination with the parameterization for Deramakot was extensively tested by comparison with empirical data.
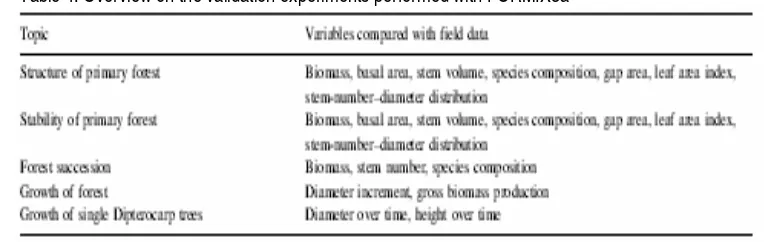
• Table 4 gives an overview of the tested variables. One part of these tests investigates the structure and the stability of primary forest. Further tests focus on the growth of the forest trees. In one test forest succession was analyzed using field data from different disturbed forest stands.
3.5. Logging scenarios
• For the simulation of logging operations, assumptions about logging damage have to be made first. Widely varying figures are cited on the damage caused by building logging roads, skidding paths, and felling lanes.
• The extent to which a forest is impacted by logging operations primarily depends on the intensity of felling and the methods used. When only one or two trees are extracted per hectare and the work is done as carefully as possible (e.g. by skyline yarding), only a small fraction of the forest is impacted. Intensive logging and careless felling (e.g. with tractors) can impact a large area of the forest.
• In the following the author investigates two different logging methods: conventional logging with high damage, and reduced impact logging with low damage. The damage percentages were estimated based on the range of literature values (s.a.).
• Table 5 shows the values used in the simulations.
Table 5. Assumptions on the fraction of damaged trees in the residual stand after logging as used in the simulation for two different logging methods a
• The damages depend on the size of the damaged trees, but are independent of the logging intensity as a matter of simplification.
• In the next step, the authors have to define which trees can be logged. All trees above 60 cm diameter belonging to the species groups dominated by Dipterocarps (1 & 2) are harvested.
• Dipterocarp trees with a diameter below 60 cm might also be of commercial interest but they are not logged. Thus, the simulated logging scenarios represent a selective logging system as used in Malaysia e.g. (Whitmore, 1990).
• The number of felled trees in one logging operation is limited to between 5 to 30 trees.
• The upper limit can be defined to exclude logging practices which modify the forest structure too strongly. If the number of harvestable trees is too low (<5 trees), no trees are felled as these kinds of logging operations cause costs that are too high and not economically feasible.
• Logging scenarios are defined by the combination of a certain logging method with various assumed logging cycles.
• The currently practiced logging system in Malaysia envisages cycles between 20 and 30 years using the `Malaysian Selective Management System' (Whitmore, 1984; Whitmore, 1990; Aiken and Leigh, 1993).
IV. Results and Discussion
4.1. Result
4.1. 1. Results for selected logging scenarios
• In the following the authors discuss the simulation results obtained for different logging scenarios. At the beginning of the simulation we assume an undisturbed forest.
• Fig. 1 (Appendix 2), shows the results of the simulation of conventional logging with a cutting cycle of 20 years.
• Fig. 2 (appendix 3), visualizes the simulated forest immediately before and after the first logging operation (at time 0).
• Each logging operation can be recognized in Fig. 1a (appendix 2), due to the sudden decrease of total standing volume. This decrease is composed of the harvested stem volume and the lost volume due to damages. The cutting cycle of 20 years is so short that 20 years after the first logging operations there are not enough harvestable trees in the forest to allow a new logging operation. Thus, the next logging is carried out later, at Year 40.
• The same situation occurs at the Years 80, 100, 120, 160, 200, 220, 300, 320 and 380. The high variation of yield per operation is strong evidence that the forest is over-exploited (Fig. 1d, appendix 2). After each logging operation the forest re growth is constituted largely by increased growth of Macaranga species (group 3, open circles in Fig. 1c) compared to the composition in primary forest (state at time 0 in Fig. 1c, appendix 2). But also the species composition of the Dipterocarp species (group 1 & 2) shifts to smaller and more light-demanding Dipterocarps (group 2, Fig. 1c, appendix 2).
• Looking at the trees with a diameter above 60 cm (harvestable trees, Fig. 1b, appendix 2). During the whole simulation, the volume of these trees remains distinctly below the value for unlogged-forests (value at the beginning of the simulation, forest state at time 0 in Fig. 1, Appendix 2).
• The scenario for a conventional logging at a cycle of 60 years shows the same trend (Fig. 3 Appendix 4). Here the large Dipterocarp trees have more time to recover, but still they do not reach their pre-harvest volume until the next logging operation (Fig. 3a, Appendix 4).
• The growth of Macaranga after logging is not as high as for the shorter logging cycles but still considerably increased. The logged volumes per cut are higher than for the short cycle and fluctuate between 100 m3/ha and 250 m3/ha (Fig. 3d, Appendix 4). Figs. 4 and
5 (Appendix 5,6), shows the results obtained for low impact logging. The scenario with a logging cycle of 20 years again displays strong fluctuations in the logged volume per cut including cycles without any logging (Fig. 4d, appendix 5).
• The harvestable volume remains very low during the whole simulation. In contrast to conventional logging, the growth of Macaranga is moderate (Fig. 4a and c, appendix 5). Nevertheless, species composition shifts to smaller Dipterocarp species (group 2).
unlogged forests before each logging event. Species composition remains rather stable. The logged volumes per cut still show some fluctuations.
• Comparing the four investigated scenarios with respect to the modification they cause in forest structure, the low impact logging with a logging cycle of 60 years produces the smallest modifications. The highest yields are obtained for the logging scenarios with a cycle of 60 years irrespective of the used logging method.
4.1.2. How sustainable are the different logging scenarios?
• One concern of sustainable forest management is the sustainability of timber yields. Therefore management strategies have to be assessed for the continuity and level of yields produced over a long time period. A second concern of sustainable forest management is the preservation of the forest ecology and its protective functions (such as protection of soil and water).
• In the following the authors want to analyze the simulation results for different logging scenarios in a more aggregated manner to assess certain criteria for sustainable forest management. Again, we investigate both logging methods (conventional and low impact logging), but enlarge the number of analyzed cutting cycles. We investigated logging cycles ranging from 20 to 100 years. As each simulation includes stochastic mortality events we repeat the simulation of each scenario five times and average the results.
• For the comparison of the different logging scenarios in relation to their sustainability, the authors use four indicators: total logged volume, logged volume per cut, species composition, and opening of the forest canopy. The first two indicators refer more to the economic interest of obtaining a continuous good harvest from the forest over a long period. Both indicators are relevant for management decisions. The other two indicators are concerned with the ecological state of the forest. The degree of the opening of the stand is used as indicator for the risk of erosion.
• For a comprehensive assessment of the sustainability of logging scenarios, further indicators would have to be considered such as the compaction of the soil and changes in the nutrient balance. Such effects are currently not incorporated in the model. Nevertheless, the four indicators used give first indications of the sustainability of the different logging scenarios.
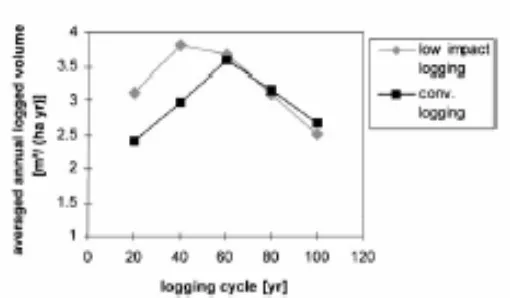
• Fig. 6, shows the total logged volume per year and hectare obtained by simulating different logging cycles over 400 years. With conventional logging, a cutting cycle of 60 years shows the highest logged volumes with 3.5 m3/(ha year) (1400 m3/ha in 400 years).
The cycles of 40 and 80 years produce an intermediate wood output. A cutting cycle of 20 years has the lowest wood output (2.4 m3/ha (year)). This indicates that short cycles
Fig. 6. Results for the simulation of different logging scenarios. Average annual logged volume obtained in 400 years for different cutting cycles and logging methods. Total logged volume is defined as the accumulated logged volume harvested in 400 years and the harvestable volume at the end of this period. To calculate merchantable wood volume we have to multiply the total logged volume by 0.4 (Table 6). Each value is an average of five simulations.
• This logged volume is higher than for conventional logging due to the reduced damage of the reduced impact logging. The highest logged volumes will be obtained for a logging cycle around 50 years. These cycles produce a wood harvest of nearly 3.75 m3/(ha year).
For longer cycles (60 years) the yields are nearly identical for both logging methods.
• To calculate the merchantable yields from the simulated logged volumes, the total logged volume must be multiplied by 0.4. This estimated reduction factor reflects (a) that only 80% Dipterocarp species (group 1 & 2) are merchantable, (b) felling and skidding during harvest, and (c) that the upper parts of the stems belonging to the crown are left behind in the forest (logged volume is stem volume to top of tree, including bark).
• The reduction factor is assumed to be constant over time as a matter of simplification. As shown in the following, logging causes a shift in the mean species group composition.
• This shift might also influence the fraction of merchantable tree species in species group 1 and 2, an effect which is neglected here.
• Table 6 summarizes the respective results of merchantable yields for the different logging scenarios shown in Fig. 6.
Table 6. Estimated average annual merchantable yields obtained in 400 years for the different logging cenarios based on a reduction factor of 0.4 and the simulation results displayed in Fig. 6
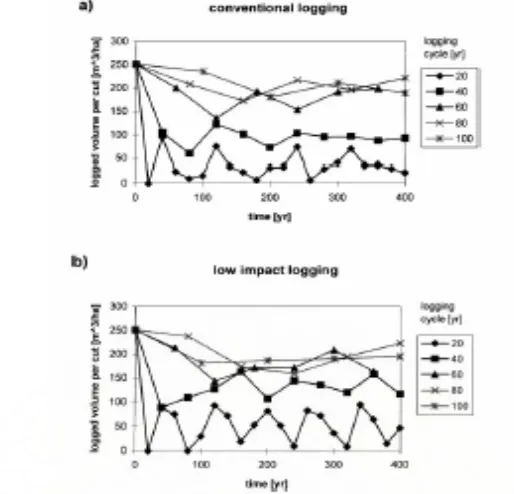
• Fig. 7 shows logged volume for each cut, which gives information about the yield continuity. The cycle of 20 years produces the highest fluctuations. For both logging methods, the predefined cycle was often not applicable as the actual standing number of harvestable trees in the forest was often too low (below the minimum of 5 trees). This situation occurs more often in case of conventional logging, but it also occurs for low impact logging.
the forest has enough time to regenerate to a similar structure before each new logging operation. Thus the logged volumes are stable.
Fig. 7. Simulation results for different logging scenarios. Logged volume obtained per cut over time for different cutting cycles and logging methods. The average annual logged volume over a period of 400 years are shown in Fig. 6.
• The fluctuations of logged volume per cut for logging cycles between 40 and 60 years lead to the conclusion that the forest has a different structure before every logging and is not fully regenerated.
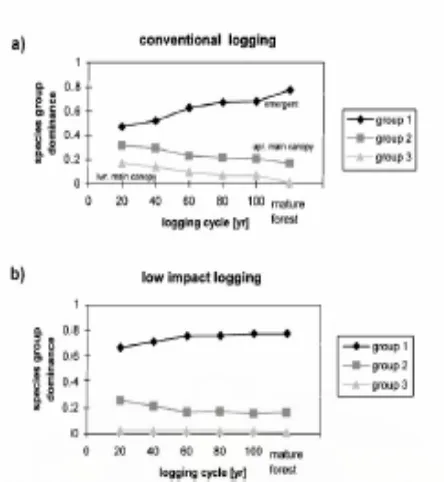
• From the changes in species composition the authors obtain more details of the impact of logging scenarios on the ecology of the forest.
• Fig. 8 shows the development of most important tree species groups (groups 1, 2, 3). There is a clear trend. Very short logging cycles and conventional logging methods promote the growth of Macaranga and other pioneers (group 3). Accordingly, the volume of Dipterocarp species (group 1 & 2) is reduced. This is the reason for the lower yields of these logging scenarios.
• Conventional logging always changes the species composition in a forest compared to the structure of a mature forest. Low impact logging combined with cycles of 60 or more years provide a mean species composition which is nearly the same as in a mature forest. Nevertheless, small changes in species group composition might be an indicator for considerable changes in single-species composition. It is also possible to get some hints about the erosion risk connected with the different logging scenarios.
Fig. 8. Results for the simulation of different logging scenarios. Mean species group proportions for different utting cycles, logging methods and a mature forest. The proportions are calculated as the share of the species groups in the stem volume of the whole forest. Each value represents a mean value over 400 years for five simulation runs.
• Fig. 9 shows the opening index for different logging methods and cutting cycles. Logging scenarios with short cycles increase the gap fraction, and thus raise the risk that erosion damages the soil. The erosion risk is much higher for conventional logging methods, though the impact of logging operations on soil is not included in the model.
[image:15.595.188.410.86.327.2]• Logging scenarios with long cycles show a lower opening index (0.55), but still a higher value than for an undisturbed forest (about 0.3). If we would include soil compaction caused by heavy machines into the model, the difference of the erosion risk between conventional logging and low impact logging would increase.
[image:15.595.189.418.510.660.2]4.2. Discussion
• The authors have demonstrated how the FORMIX3 model can be used to estimate and assess the long- term effects of different logging strategies. Neither the single logging operation nor the re growth of the forest until the next harvest were the focus of this study, but rather long-term impact of repeated logging operations.
• According the author: “four indicators concerning yield and impact on forest structure, we conclude that for the investigated primary forest stand, cutting cycles of 100 years in combination with careful logging methods have the weakest impact on the forest. The so called reduced impact logging methods have a large impact on the stand if applied with short cutting cycles (<40 years). Logging cycles of 60 years may be a useful compromise between economic and ecological interests according to our simulation. This cycle produces higher total logged volumes than short or long cycles and maintains low impacts on species composition if applied with reduced impact logging methods. The erosion risk could be minimized only for logging cycles of 100 years”.
• The analysis of logging impacts on forest structure in simulation gives some insights into the ecological consequences of timber extraction. The indicators of ecological forest state used in this study record only part of the logging impacts. Nevertheless they clearly show that from an ecological point of view rather long cycles would be desirable in combination with reduced impact logging methods.
• The logging investigations should be completed be some financial reasoning. An financial analysis should at least include an annual discount rate for the harvested stem volume and harvesting costs.
• Supposing a discount rate of 3% per year and harvesting costs equivalent to 20% of the merchantable yields (Table 6) the authors can calculate the `financial returns' in 400 years (Table 7).
Table 7. Financial returns obtained in 400 years for the different logging scenarios based on a discount rate 3%/yr) and harvesting costs (20% of merchantable yield).The returns are indicated in m3 wood volume as equivalent for the cash valuea
• The results show rather small differences between low impact and conventional logging methods. Logging cycles between 20 and 60 years have nearly the same returns. Longer cycles have lower returns, e.g. logging in a 100 year cycle leads to a reduction of 10% compared to the cycles between 20 and 60 years. These results suggest that logging cycles between 20 and 60 years should be chosen from the economic point of view.
• The logged volumes calculated with the help of the model are based on certain assumptions. The model assumes (a) annual recruitment of new seedlings for every species group and (b) that the nutrient losses of the forest ecosystem due to logging are negligible or compensated by nutrient inputs from air and rain.
• Such modified logging strategies can easily be included in the model and investigated by simulation. The detailed investigation of such modified logging strategies may help to find more optimal strategies than those discussed in this study.
• The calculated yields lie between 0.5 and 1.7 m3/ha which reflects different growth
characteristics of the different forest types, but most of these studies investigated only one logging method and one cutting cycle.
• This study shows that the yield obtained for short cycles is much lower than for longer cycles.
• A simulation period of 100 years or less does not seem to be sufficient as our and other studies show. Review of the simulation studies on impacts of logging shows clearly that the current focus is too much on yields. Other indicators have to be added to get more insight into the complex impacts of timber harvesting on tropical rain forests. This study has made first steps in this direction.
V. Conclusion
Based on the study, the authors concluded as follows:
• Rain forest models are useful tools to analyze and to compare long-term impacts of different logging strategies. Simulation studies should not only focus on timber yield but also on the structure of the remaining forest. Logging cycle and method has a strong influence on yield and structure of the remaining forest.
• Low impact logging is an important method to reduce changes in forest structure but their impact depends strongly on the logging cycle with which low impact logging will be applied.
• The simulation results suggest that for Dipterocarp forest in North-Borneo a logging cycle of 60 in combination with low impact logging methods would be a useful compromise between economic and ecological interests.
VI. General Comments on the Paper
6.1.
Strengths
• On the whole, this paper was good, because of giving information to us about the model impact logging in the tropical forest.
• The reader can easy to understand that this paper related with silviculture, because this paper using the Formix3 model, which includes tree growth, mortality, regeneration and competition. This method was applied in various cases was linked with silviculture, especially to investigate the long-term impact of the forest management.
• Using the selection method in this paper is very appropriate, because if we look on the site, in the location are poor in nutrients and easy eroded, especially when the protective plant cover is removed.
• This paper used a simulation model, so this study more effective because no need go to the field to all the measurement. By simulation logging scenarios with model, the impact of logging strategies can be analyzed and assessed for their sustainability. The linkages with the field of silviculture that need the long time to research, so this model was very helpful.
• Forest growth models normally focus on the tress in the forest. These models allow analysis of how the future forest structure will be modified by management, but they tell us little about other aspects of the ecosystem.
• This paper had been answering all the following questions investigated (on the objective this paper).
6.2. Weakness /Limitations
• The model gave the guide for us to take the decision in the forest management, although the decision not the end decision, at least this paper gave information and was useful as suggest for decision maker.
• The simulation results just suggestion that for Dipterocarp forest in North-Borneo a logging cycle of 60 in combination with low impact logging methods would be a useful compromise between economic and ecological interests, but not explain about the value both economically and ecologically.
• The authors recommended that for conservation of species composition and minimizing erosion risk, logging cycle of 80 or 100 years in combination with low impact methods. It would be better if the authors not only recommended for conservation but also for economic, because the objective on sylvicultural system was how to make balancing between economy and ecology.
6.3. Suggestion
REFERENCES
Aiken, S.R., Leigh, C.H., 1993. Vanishing Rainforests: the Ecological Transition in Malaysia. Clarendon Press, Oxford.
Bossel, H., Krieger, H., 1991. Simulation model of natural tropical forest dynamics. Ecol. Model. 59, 37-71.
Fulton, M.R., 1991. A computationally efficient forest succession model. Design and initial tests. For. Ecol. Manage. 42, 23-34.
Fulton, M.R., 1993. Rapid simulations of vegetation stand dynamics with mixed life-forms. In: Solomon, A.M., Shugart, H.H. (Eds.), Vegetation Dynamics and Global Change. Chapman & Hall, New York, pp. 251-271.
Huth, A., Ditzer, T., Bossel, H., 1997. Rain forest growth model FORMIX3: a tool for forest management planning towards sustainability. Model development and case study for Deramakot Forest Reserve in Sabah, Malaysia. TO» B Publication. Deutsche Gesellschaft fu r Technische Zusammenarbeit (GTZ) GmbH, Eschborn, 78 pp.
Huth, A., Ditzer, T., Bossel, H., 1998. The rain forest growth model FORMIX3 – Model description and analysis of forest growth and logging scenarios for the Deramakot forest reserve (Malaysia). Go»ttinger Beitra»ge zur Land- und Forstwirtschaft in den Tropen und Subtropen 124 (ISBN 3-88452-385-6). Erich Goltze, Gottingen, 182 pp.
Huth, A., Hahn-Schilling, B., Bossel, H., 1994. Untersuchung der Auswirkungen von verschiedenen Nutzungsstrategien auf das Wachstum von Moorregenwald - Simulationen mit FORMIX. Z. Naturschu. Okol. 3, 217-225.
Kira, T., Yoda, K., 1989. Vertical stratification in microclimate. In: Lieth, H., Werger, M.J.A. (Eds.), Tropical Rain Forest Ecosystems. Elsevier, Amsterdam, pp. 55-71.
Smith, D. M., B.C. Larson., M.J. Kelty., P.M.S. Ashton. 1997. The Practice of Silviculture: Applied Forest Ecology. 8th Edition. John Wiley & Sons, Inc.