Materials Science and Engineering A 497 (2008) 260–269
Contents lists available atScienceDirect
Materials Science and Engineering A
j o u r n a l h o m e p a g e : w w w . e l s e v i e r . c o m / l o c a t e / m s e a
Microstructure formation in Waspaloy multilayer builds following
direct metal deposition with laser and wire
N.I.S. Hussein
∗, J. Segal, D.G. McCartney, I.R. Pashby
School of Mechanical, Materials and Manufacturing Engineering, University of Nottingham, University Park, Nottingham NG7 2RD, UK
a r t i c l e
i n f o
Article history:
Received 27 October 2007
Received in revised form 12 May 2008 Accepted 7 July 2008
Keywords:
Solidification Microstructure Nickel-based superalloy Laser direct metal deposition Waspaloy
a b s t r a c t
In the manufacture of parts by direct metal deposition it is common to inject powder into a molten pool formed by laser heating. However, a wire feedstock offers potential advantages and was employed in the present study of multilayer deposition of Waspaloy in the form of walls approximately 6 mm thick using a high power diode laser. The macro- and microstructural evolution was investigated and the deposits were characterized by optical microscopy, scanning electron microscopy (SEM), differential scanning calorimetry (DSC) and microhardness testing. A columnar-dendritic solidification structure forms with the dendrites growing approximately in the plane of the wall and at an angle of around 30◦to the build direction. Layer bands were observed, corresponding to the depth of remelting in each successive pass and are due to localized dendrite arm coarsening. The microhardness of multilayer walls decreases from bot-tom to top, i.e. along the build direction and also depends on the number of layers in the wall. Although the Ni3(Al,Ti) precipitate phase (␥′) could not be detected by SEM, DSC thermograms of samples from different positions in the multilayer deposits exhibit different characteristics which are ascribed to vari-ations in␥′precipitation. The DSC data are used to interpret the microhardness variations in terms of the complex thermal histories affecting␥′formation in the alloy.
© 2008 Elsevier B.V. All rights reserved.
1. Introduction
The production of high-grade alloy components by direct metal deposition shows considerable promise for industrial application in the manufacture of aeroengine components. It can be used to produce, for example, prototypes, small batches of parts and in precision repair or feature addition. A number of laser-based direct metal deposition techniques variously termed laser-engineered net shaping, directed light fabrication, laser additive manufacturing and epitaxial laser metal forming[1–11]have been reported in the literature in recent years. This work has covered a number of mate-rials including titanium-based alloys[4–6]and nickel-based alloys
[8–11]. A common theme amongst such processes is the deposition of an alloy feedstock, normally in powder form, by melting it with a high-powered laser beam. Normally, the powder is blown, or oth-erwise fed, into the defocused beam so that it is melted and fused with a thin layer of the substrate. The result is a fully dense solidified layer. A three dimensional part is built up, layer-by-layer, by travers-ing the laser beam and/or the part in a controlled fashion. Direct metal deposition (DMD) using wire as a feedstock material rather
∗ Corresponding author. Fax: +44 1159513749.
E-mail address:[email protected](N.I.S. Hussein).
than powder was first proposed by Schneebeli et al.[12]. More recently this approach has been extended by the current authors using a high power diode laser as the heat source[13]. For certain types of alloys, e.g. Ti-6Al-4 V and wrought Ni- or Fe-based super-alloys, wire has advantages over powder as a feedstock for DMD in applications such as component repair and feature addition. This is due to its lower cost and lower oxide content. Because aero-engine components need to be manufactured with a high degree of integrity and reproducibility, fundamental research is required on wire-based DMD to more fully understand the resultant structure-property relationships. Therefore, the purpose of the present paper is to report the results of a study into wire-based layer-by-layer deposition of Waspaloy using a high-powered diode laser as the heat source.
Waspaloy is an established, wrought, nickel-based superalloy which is widely used in the manufacture of compressor discs and combustor cans for aeroengine gas turbines. It has the nominal composition Ni-19.5%Cr-13.5%Co-4.3%Mo-1.3%Al-3.0%Ti-0.1%C (in wt.%)[14]. It exhibits good high temperature mechanical prop-erties, i.e. strength, creep and fatigue resistance, combined with good oxidation and corrosion resistance. The service temperature is typically up to 650◦C for critical rotating parts and closer to 850◦C for less demanding static applications[14–16]. Waspaloy can be age-hardened by a standard heat treatment. It derives its
N.I.S. Hussein et al. / Materials Science and Engineering A 497 (2008) 260–269
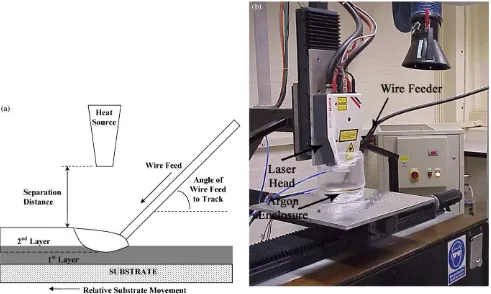
Fig. 1.(a) Schematic illustration of the DMD process (b) Photograph of the arrangement for deposition experiments used in the present study.
good mechanical properties from a microstructure comprising a fcc, solid-solution,␥-phase matrix and the␥′ precipitate phase
(ordered Ni3(Al,Ti)). The ␥′ volume fraction is estimated to be
approximately 30% [15]. In wrought Waspaloy, a small volume fraction of carbide phases, principally M23C6, is present as glob-ular grain boundary particles to provide additional grain boundary strengthening [16,17]. Although Waspaloy is a well-established wrought material, it has characteristics that make it difficult to suc-cessfully fusion weld[18]. For example, it can be susceptible to weld and heat affected zone cracking, microfissuring and porosity for-mation[18,19]. Therefore, given the similarities between DMD and conventional fusion welding, there are significant challenges to be overcome in order to manufacture high integrity parts free from such defects.
One aim of the work reported here was to establish whether Waspaloy could be deposited directly, layer-by-layer, using a wire feedstock to give a pore and crack free structure. A second aim was to identify the macro- and microstructural evolution during deposition by producing builds, in the form of walls approximately 6 mm thick and 100 mm long, with different numbers of layers i.e. different heights. The multilayer deposits were then characterized by optical microscopy, scanning electron microscopy, differential scanning calorimetry and microhardness testing.
2. Experimental
2.1. Deposition procedures and materials
DMD was performed with a 2 kW Rofin diode laser providing approximately equal amounts of 808 and 940 nm radiation. The beam was focussed to give a rectangular profile approximately 6 mm×2 mm with a nominally Gaussian distribution in the short axis direction and top hat distribution in the long axis direction.
The beam was focussed approximately at the deposition point for the feedstock wire which was “front fed” into the beam at an angle of approximately 45◦, as shown schematically inFig. 1(a). The DMD process was performed under a controlled atmosphere by surrounding the workpiece and laser head with a flexible trans-parent enclosure which was evacuated and then back-filled with high purity argon gas. The experimental arrangement is shown in Fig. 1(b). Waspaloy walls were deposited onto 10 mm thick Waspaloy base plate using commercially available 1.2 mm diam-eter welding wire as feedstock. The base plate was obtained from commercially available hot worked and solution treated Waspaloy billet. The chemical compositions of wire and base plate are given inTable 1. Wall deposits, approximately 6 mm wide by 100 mm long, were produced by making successive laser tracks one on top of the other, with the traverse direction of the substrate perpendic-ular to the long axis of the laser beam. The number of successive deposits was varied between 1 and 9 so that the microstructural evolution could be examined in detail. The process parameters used for deposition are shown inTable 2and each deposited layer had a thickness of∼1.5 mm under these conditions. The process param-eters employed were selected following preliminary trials so that they gave low porosity, well fused layers. In order to achieve good bonding with the substrate it was necessary to perform one autoge-nous pass over the substrate prior to building the wall. Additionally, in a small number of samples, the laser was switched off during deposition of the final layer and simultaneously a flow of argon
Table 1
Chemical compositions of the Waspaloy wire and base plate (in wt.%)
Material Element (wt.%)
Ni Cr Co Mo Ti Al Fe C
262 N.I.S. Hussein et al. / Materials Science and Engineering A 497 (2008) 260–269 Table 2
Conditions for DMD using a RofinDL025 diode laser heat source Parameter
Laser power (kW) Traverse speed (m/s) Wire feed rate (m/s)/(kg/h) Separation distance (mm) Wire Angle (◦) Interpass delay time (s)
Values 2 0.0017 0.025/0.83 7 45 30
was introduced into the enclosure. The aim of this was procedure was to rapidly chill the sample and so preserve the shape of the melt pool during deposition.
2.2. Microstructural characterisation
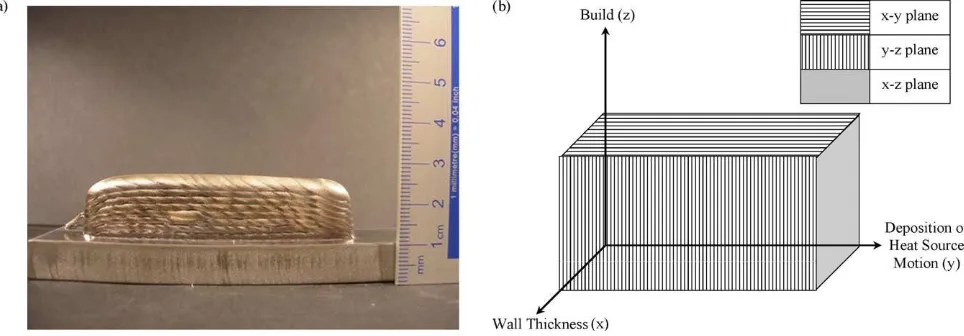
A photograph of a 9-layer build in the form of a wall is shown inFig. 2(a). In order to study the microstructural features within the build, samples were cut so that planes of different orientation could be examined.Fig. 2(b) shows how these planes are defined in relation to the build direction and direction of heat source (laser) movement during deposition. Samples for metallographic exam-ination were cut, using electro discharge machining, ground and polished using standard procedures. They were then etched using either Kalling’s reagent (2 g CuCl2, 40 ml HCl and 40–80 ml ethanol) or 10% orthophosphoric acid in water. The orthophosphoric acid was used to reveal the␥′ and carbide precipitates and is an
elec-trolytic etch (typically 3 V for 2 s).
The etched samples were examined using optical and scanning electron microscopy. For the latter, a FEI XL30 field emission gun scanning electron microscope (FEG-SEM) operated in high vac-uum mode and using secondary electrons to form the image was employed. Qualitative energy disperse X-ray (EDX) analysis was utilized to aid phase identification and examine compositional vari-ations.
X-ray diffraction (XRD) analysis with monochromatic Cu K␣
(= 0.15406 nm) radiation was employed to aid in the identification phases present in the Waspaloy walls. XRD scans were performed on a Bruker/Siemens D500 diffractometer operated at 40 kV with a step size of 0.01◦and a dwell time of 6 s per step in the 2range 25–105◦.
The microhardness variations along the build direction of deposits with 1, 3, 5, 7 and 9 layers were determined from samples sectioned on they-zplane (Fig. 2(b)). Tests were performed using a LECO M400 Vickers microhardness instrument with a load of 500 gf (i.e. 5 N) applied for 15 s; typically indentations were spaced 150m apart. Secondary dendrite arm spacings (SDAS) were also
measured at selected locations within deposits on they-zplane. A
linear intercept method was employed and involved taking a total length of test line and dividing by the total number of secondary dendrite arm intercepts on this line. A mean SDAS value at vari-ous distances from the base of a wall was determined from 10 such measurements.
2.3. Differential scanning calorimetry (DSC)
DSC was performed on samples taken from multi-layer builds and also, for reference purposes, on wrought Waspaloy. The wrought material was cut from the base plate and heat treated in a laboratory tube furnace under argon to provide material in two conditions for DSC namely solution treated and quenched (STQ), and solution treated and aged (STA). The STQ material was held at 1080◦C for 4 h and quenched in oil. The STA material had the fol-lowing heat treatment: 1080◦C for 4 h followed by air cooling with a double ageing treatment of 845◦C for 24 h followed by air cool-ing and 760◦C for 16 h followed by air cooling[20]. Disc-shaped samples, 4 mm in diameter by approximately 0.45 mm thick, were sliced from rods which had been machined from the STA and STQ wrought Waspaloy and also various locations in the multi-layer builds. The sample weight was typically 60 mg. The DSC measure-ments were carried out using a differential-temperature type DSC (TA Instruments model SDT Q600). All runs were performed at a heating rate of 20 K/min in the temperature range 20–1200◦C under an argon gas atmosphere (flow rate 20 ml min−1) using recrystallized alumina sample pans. The temperature scale was cal-ibrated using the melting point (onset) of pure nickel (1453◦C) and pure aluminium (660.4◦C). All DSC traces were corrected by subtracting the baseline obtained from a DSC run with empty pans.
3. Results
3.1. Layer formation and dendrite structure
In order to understand the macro- and microstructural devel-opment, walls comprising 1, 3, 5, 7 and 9 layers, respectively, were built. The typical structural development which resulted is shown
N.I.S. Hussein et al. / Materials Science and Engineering A 497 (2008) 260–269
264 N.I.S. Hussein et al. / Materials Science and Engineering A 497 (2008) 260–269
Fig. 4.Etched optical micrographs of the upper most part of L5 shown inFig. 3. (a) section of they-zplane showing abrupt change of dendrite growth direction; (b) section of thex-zplane showing growth direction nearly perpendicular to this plane at the top surface.
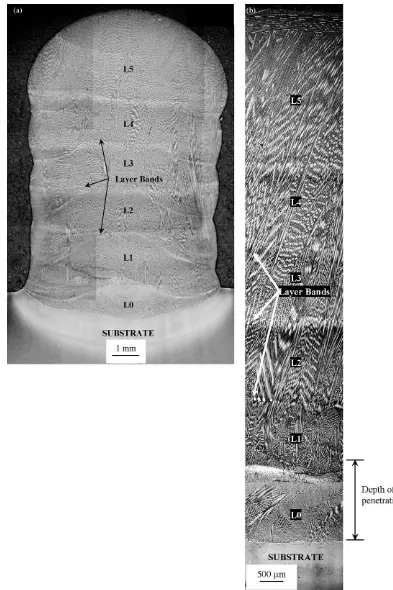
in the optical micrographs ofFig. 3which were obtained from a 5-layer build.Fig. 3(a) shows thex-zplane following electrolytic etching in 10% orthophosphoric acid whilst a section of the y–z plane of the build in shown inFig. 3(b) (SeeFig. 2for a definition of the orientations). In Fig. 3the layer indicated as L0 corresponds to an autogenous run which was required to pre-heat the base plate and ensure that the first added layer (L1) was crack free. Layer bands are marked on the figure and these are approximately equally spaced with a separation of about 1.5 mm. This distance corresponds to the height increment with each layer added. The average width of the wall was∼6.5 mm. Layer 5 (L5) was the last layer added to give a total build height of∼10 mm. Layer 5 is seen to be thicker than the other layers since it comprises both newly added material and remelted layer 4 material. It is also in the as-deposited condition, whereas the previous layers (L0 to L4) experienced heat-ing and coolheat-ing thermal cycles followheat-ing subsequent deposition passes.
It is evident from Fig. 3(b) which shows the y-z section that layers 1–5 solidified with a well defined columnar-dendritic struc-ture and that the columnar dendrites (and therefore grains) grew across multiple deposited layers. The dendrites are also seen to be tilted at about 30◦to thez-axis toward the direction of movement
Fig. 5.Higher magnification OM image of a layer band fromFig. 3. Layer of coarsened dendrite trunks is visible and dendrites are seen to be epitaxial across layers.
of the laser heat source. However, the structure that formed in the autogenous L0 layer was very different in that the dendrites appear to have deviated more towards the direction of movement of the heat source; presumably in an attempt to grow along the maxi-mum thermal gradient of the moving melt pool, as is well known for traditional bead on plate weld structures[19,21].
A further feature to note is that in the uppermost region (top 500m) of the L5 layer (last to be deposited) the dendrite growth
direction changed abruptly from being at about 30◦to thez-axis to being almost 90◦ to this axis and almost parallel to the y-axis direction. This is shown in more detail inFig. 4(a) and (b) for the y–z and x–z sections of the build, respectively. It should be noted that this was not a columnar-to-equiaxed transition but in fact one in which the columnar growth direction changed abruptly.
The layer banding phenomenon is shown in more detail inFig. 5
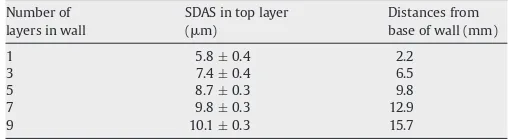
which shows a section from they-zplane and illustrates a band between two layers in a 5-layer build. The main feature to note is that the dendrite trunks are seen to be coarser at the location of the band and this is the reason for the etching contrast. This would suggest that the band marks the limit of partial re-melting as layer (n+ 1) is deposited onto layer n. This figure also illustrates that epitaxial growth occurred from these partially remelted den-drites during the deposition process, which led to the formation of the essentially columnar grained structure of almost the entire wall. The secondary dendrite arm spacing (SDAS) was measured in the final layer deposited for the 1, 3, 5, 7 and 9 layer builds and the results are given inTable 3. Clearly, the SDAS increased with the height of the build showing that the local solidification time also
Table 3
SDAS measurements obtained from the uppermost (top) layer of multilayer builds with corresponding distances from the base of the wall (i.e. height above the base plate), the error corresponds to the standard error in the mean for 1 standard deviation
Number of layers in wall
SDAS in top layer (m)
Distances from base of wall (mm)
1 5.8±0.4 2.2
3 7.4±0.4 6.5
5 8.7±0.3 9.8
7 9.8±0.3 12.9
N.I.S. Hussein et al. / Materials Science and Engineering A 497 (2008) 260–269
Fig. 6.Secondary electron image of dendrites from thex-yplane of a 5 layer build
showing dendrite trunks with a cruciform shape and light contrast interdendritic MC-type carbide phase.
increased somewhat with increasing distance from the substrate, which acts as a heat sink. The increased solidification times arise from a lower average cooling rate with distance from the substrate. This is because the average thermal gradient in the build
direc-tion (z-axis direction) decreases as the distance from the base plate
increases.
A cross-section of the dendrite microstructure from the x-y
plane is shown inFig. 6which is a secondary electron image of
a sample which was etched in orthophosphoric acid. EDX analysis across the dendrites showed that Ti and Mo segregated positively to interdendritic regions whereas the concentration of Cr was highest at the dendrite core. The light contrast globular or “Chinese-script” phase seen inFig. 6was found, by EDX analysis, to be rich in Ti and Mo. This suggests that these features were most probably MC-type carbide (M = Ti, Mo) as opposed to the M23C6carbide which is most commonly found in wrought Waspaloy[17], as the latter are known to be Cr-rich. X-ray diffraction patterns obtained from as-solidified walls confirmed the presence of a cubic carbide phase with a lat-tice parameter close to that of TiC (a0= 0.4330 nm) whereas there was no X-ray diffraction evidence for the presence of either M6C or M23C6carbide phases.
Fig. 7.Optical micrograph of the leading edge of the weld pool in they-zplane following quenching during deposition. The heat source was moving from right to left and only the leading part of the quenched melt pool is shown. Layer (n + 1) corresponds to the one which was being deposited at the time of quenching. The boundary between unmelted layer n and the quenched melt pool is shown by the dotted line. The approximate position of inter layer banding is shown by dashed lines.
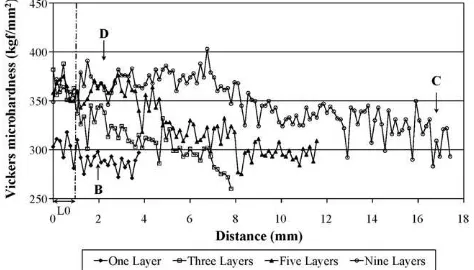
Fig. 8.Plot of Vickers microhardness versus distance from the base of the wall in multilayer builds, with 1, 3, 5 and 9 layers, respectively. Locations of DSC samples are shown as B, C and D.
3.2. Quenched melt pool structure
Fig. 7is a low magnification optical micrograph image of the leading edge of the weld pool in they-zplane. The laser heat source was moving from right to left as indicated on the figure. The pool was advancing across layernand depositing layer (n+ 1) behind it at the time of quenching. The dotted line outlines the bound-ary between the quenched melt pool and layern. The approximate position of layer bands is indicated onFig. 7by dashed lines. It is clear from the contrast provided by layer bands that layer n was melted to around half its original depth during deposition of layer (n+ 1) (The original depth of layer n is defined as the distance from the top surface to the first layer band and is around 3.5 mm). The base of the melt pool is clearly delineated by the dotted line and shows that partial remelting of layer n took place. This also con-firms that the banding of the microstructure was indeed caused by partial melting of columnar dendrites and the resultant coarsening of the primary dendrite trunks at the limit of re-melting. The pri-mary dendrite arms in layer n are seen to be inclined at an angle of∼30◦to the vertical and epitaxial growth is evident at the base of the quenched region. The overall length of the melt pool in the y-direction (only the leading part is shown inFig. 7) was found to be approximately 10 mm i.e. significantly larger than the wall width which was∼6.5 mm.
3.3. Deposit microhardness and′formation
Vickers microhardness measurements were made along the length of 1, 3, 5 and 9 layer builds and the results are plotted in
266 N.I.S. Hussein et al. / Materials Science and Engineering A 497 (2008) 260–269
Fig. 9. Secondary electron image of an etched sample of wrought Waspaloy base plate which was solution treated and aged as described in the text showing a fine uniform␥′distribution along with coarser grain boundary carbide.
was around 370 kgf/mm2. Moreover, at a particular layer, n, the maximum hardness was reached after approximately layer (n+ 5) had been put down. For reference, the hardness of the STA mate-rial was measured and found to be 419±8 kgf/mm2. The changes in hardness along the length of the deposit are presumably related to the effect of multiple heating and cooling cycles on the microstruc-ture, the solute distribution and the␥′ precipitation. Therefore,
XRD, FEG-SEM and DSC were all employed to characterize the build along its length and relate microstructural changes to these hard-ness variations.
Careful examination of XRD patterns obtained from represen-tative deposit sections revealed weak superlattice reflections from the␥′phase thus confirming its presence. Using the FEG-SEM,
rep-resentative samples were examined which were taken from along the lengths of walls comprising 1, 3, 5 and 9 layers. These ranged from the top, as-deposited, layer to the bottom layer which had experienced a number of thermal cycles. In all the cases ␥′ was
on such a fine scale as to be below the limit of resolution of the FEG-SEM, which is around 50 nm. This contrasted with the wrought material that had been solution treated and aged (with a hardness of 419 kgf/mm2) where a uniform dispersion of␥′precipitates could
be readily identified in the FEG-SEM, as shown inFig. 9, with a size of around 100 nm.
Therefore, to obtain further evidence about differences in
␥′ precipitation within multi-layer builds differential scanning
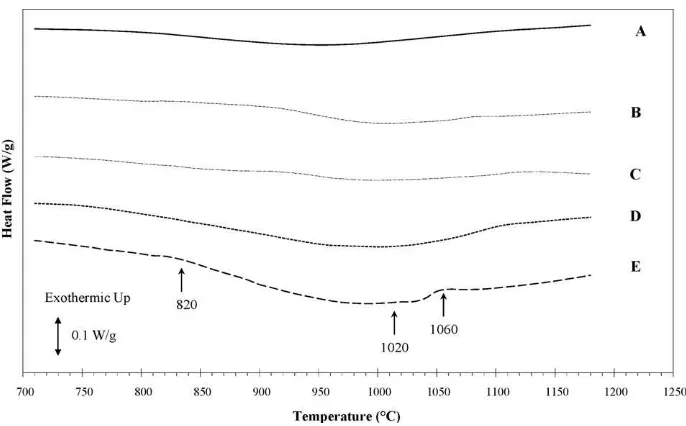
calorimetry (DSC) was employed. The thermograms shown in
Fig. 10were obtained from selected locations in multi-layer walls and compared with those of the wrought material given STQ and STA treatments in a laboratory furnace. The trace labelled B was from the 1-layer build, C from the as-deposited (top) layer of a 9-layer build and D from the bottom 9-layer of a 9-9-layer build. Traces labelled A and E were from the STQ and STA samples, respectively. Thermogram E shows a clear endothermic peak that begins around 820◦C and terminates at approximately 1060◦C. This strong peak is ascribed to␥′dissolution in the fully heat treated sample. In
com-parison, thermogram A shows a very shallow endothermic peak over approximately the same temperature interval which is con-sistent with␥′formation having been virtually suppressed by the
rapid oil quench following solution treatment at 1080◦C.
Turning now to thermogram B, a single endothermic effect is also observable which is seen to be broad and relatively shal-low (similar to that of trace A) covering a temperature range 820–1100◦C. This endothermic behaviour is also ascribed to the dissolution of␥′. In this sample it was presumably due to the small
amount of␥′ that formed during solid state cooling in the
as-deposited layer of the one layer sample. Due to its proximity to the base plate, this layer would have solidified and also cooled in the solid-state at a fast rate.
In comparison, trace C (which corresponds to the as-deposited layer at the top of a 9 layer wall), shows a similar endother-mic peak to B. This peak is also ascribed to the dissolution of
␥′. This layer would have cooled more slowly that a one-layer
deposit but the magnitude of the peak suggests that the amount of␥′formed was similar to that of sample B. Finally, if trace D is
considered, which is from the first layer of a nine layer build, a relatively strong endothermic peak is evident. The peak size sug-gests a larger volume fraction of␥′ than was present in samples
from positions B or C but somewhat less than in the STA sample (trace E). Because of its location, sample D would have experi-enced a number of thermal cycles due to successive deposition passes.
N.I.S. Hussein et al. / Materials Science and Engineering A 497 (2008) 260–269
4. Discussion
4.1. Solidification microstructure
For the conditions reported in this study, it is evident that the depth of remelted and added material were both around 1.5 mm resulting in a melt pool depth of around 3 mm during processing. This is seen inFig. 7, which shows the quenched melt pool shape. The layer bands, evident in both thex-zandy-zplanes, are evidently due to a localized coarsening of the dendrite arms which occurs when as-solidified material (with a dendritic structure) is reheated into the semi-solid temperature range during deposition of the sub-sequent layer (seeFig. 5). These layer bands thus act as a marker for the extent of partial remelting during deposition of each layer. Their shape in both thex-zandy-zplanes gives a good indication of the isotherm marking the limit of such remelting. The temperature of this isotherm is likely to be close to the onset of melting tem-perature of Waspaloy which has been reported by Murata et al. to be approximately 1290◦C from their differential thermal analysis experiments[22].
Considering Fig. 3(a) it is clear therefore that the non-equilibrium solidus was not parallel to thex-yplane but had a peak in the centre of the wall with a minimum towards each of the edges. This was particularly marked in the first 3 layers, but the isotherm shape in the centre of the wall appears to flatten out as more layers were deposited. A flat isotherm in the centre of the wall indicates that heat flow was predominantly 1-dimensional as heat from the laser flowed by conduction down the wall into the base plate, which acted as the heat sink. However, heat was also radi-ated into sides of the molten layer by the laser source giving the slightly convex melt pool shape that is observed. Additionally, the melt pool shape is further distorted during deposition of layers 1 and 2 by the heat conduction being three-dimensional into the base plate whereas when more layers have been built it is approximately to being 1-dimensional along thez-axis.
The remelting of the previous layer which occurs during DMD is responsible for epitaxial solidification on previously solidified material and gives rise to the elongated columnar-dendritic struc-ture observed along the length of the build (except for the top 500m or so of the last layer to solidify where the columnar growth
direction changes abruptly). The primary dendrite arms are clearly oriented with a1 0 0growth direction which is largely confined to the y-zplane but is tilted at an angle of ∼30◦ to thez-axis towards the direction of movement of the heat source. This direc-tion appears to become firmly established after only two or three layers were deposited on top of the autogenous layer, labelled L0, in
Fig. 3(a) and (b). To understand this development it is necessary to consider how solidified melt pool structures are generally believed to develop[19,21]. It is generally argued that dendrites with their easy growth direction (1 0 0in the case of face centred cubic) clos-est to the heat flow direction (i.e. normal to the melt pool boundary) come to dominate the structure by a process of competitive growth
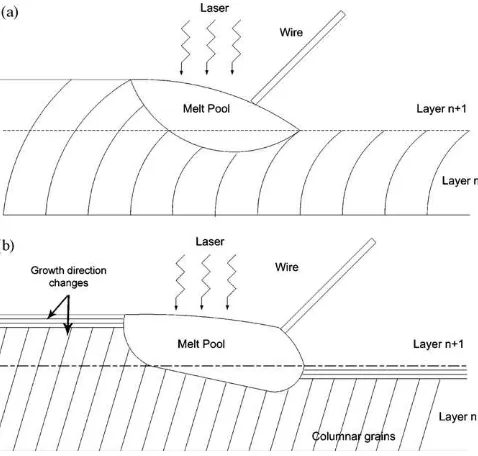
[19,21]. However, the shape of the melt pool affects significantly how the grain structure evolves. The pool shape is governed by heat flow and especially the traverse speed of the beam. Qualitatively, different shapes at low and high traverse speeds would be expected to give rise to different final grain orientations as shown schemat-ically inFig. 11(a) and (b), respectively. At low traverse speed, the dendrite orientation can change continuously giving rise to the well know observation in welds that the macroscopic grain structure bends to follow the heat flow lines[21]. At higher traverse speed, the melt pool within the remelted layer is expected to become more tear drop in shape[21]. This requires the dendrite growth direction at the rear of the melt pool to change abruptly. It would therefore lead to the appearance of columnar grains with a different growth
Fig. 11.Schematic representation of the melt pool shape expected at (a) low and (b) high beam traverse speed showing the expected grain structure development in multilayer build. In (a) the columnar grains change direction continuously whereas in (b) the melt pool shape causes an abrupt change in orientation at the rear of the pool.
orientation; as seen in the present experiments. Hence, a tear drop shape melt pool (as opposed to a more elliptical shape pool) is a possible explanation for the change in orientation shown inFig. 4
where columnar dendrites growing parallel to the beam traverse direction are present in the top 500m or so of a deposited layer.
On this basis, the angle of tilt of the primary dendrite arms of about 30◦to thez-axis must therefore reflect the fact that the melt pool interface is inclined at approximately this angle to thex-yplane, at least along the centre of the build where edge effects are less significant.
Although it appears that the remelted depth during layer depo-sition does not change significantly as layers are added to the wall, the cooling rate during solidification does appear to change as indi-cated by the changes in SDAS reported inTable 3. The SDAS at the top of the 9-layer deposit was 10.1m as compared with 5.8m
in the 1-layer deposit; i.e. about 1.75 times larger. It is generally recognised that the SDAS (s) is related to a ripening process during solidification and thus depends on the time spent in the semi-solid state (usually termed the local solidification time,ts) through the well known equation[23]that
s=Kt0.33
s , (1)
whereKis a constant for a particular alloy. In the case of directional solidification, the local solidification time,tsis given by
ts= T ′
˙
T , (2)
268 N.I.S. Hussein et al. / Materials Science and Engineering A 497 (2008) 260–269
To estimate the cooling rate during solidification in the present DMD process, data were taken from SDAS - cooling rate measure-ments reported by McLean[24]and Bhambri et al.[25]. McLean’s data provide measurements covering the range 0.1–20 K/s in the alloys MarM 246 and IN738LC. The data from Bhambri cover the range 0.02–50 K/s in the alloy IN713C with one datum point at 5×10⁵K/s. The compositions of these alloys are similar to Was-paloy with respect to Mo and (Ti + Al) but are lower in Cr and Co
[14]. Using the cooling rate versus SDAS data from these superal-loys, and applying them to the SDAS values inTable 3, it is estimated that in the present DMD process the cooling rate during solidifica-tion of the 1-layer deposit was∼90 K/s but that this had decreased to∼25 K/s for the final layer of a 9-layer build. During deposition heat is removed from a newly deposited layer by: (i) conduction through the solid wall onto which it is deposited and (ii) convection and radiation to the surrounding atmosphere. Therefore, different cooling rates at the top and bottom of a build can probably be attributed to the fact that the top layer in the 9-layer build was at least 16 mm from the base plate, which acted as the heat sink, and so the decreased temperature gradient through the solid would have markedly reduced the rate of heat extraction along thez-axis of the wall.
If we assume that the heat flow in a 1-layer build can be approx-imated by Rosenthal’s three-dimensional, thick-plate analytical solution[19,26]then the cooling rate on the top surface of the first layer, along the centreline of the deposit, can be estimated from the following equation
dT dt =2kV
(T−T0)2
Q , (3)
where k is the conductivity of the Waspaloy,Q is the absorbed power,Tis the temperature at which the cooling rate is calculated andT0is the initial temperature of the substrate andVis the tra-verse speed of the heat source. For the first layer,T0is estimated to be 300◦C,Tis taken to be the mid-point of the non-equilibrium freezing range (1305◦C)[22],kis 11 Wm−1K−1,Qis estimated to be 80% of the incident beam energy and the traverse speed was 1.7×10⁻³m/s. Using these values the cooling rate is estimated to be 75 K/s, which is in reasonable agreement with the value calcu-lated from SDAS measurements for this location. The “thick plate”, three-dimensional heat flow assumption is invalid once the height of the wall exceeds a few mm and so it is not appropriate to use this equation for estimating the cooling rate in the top layer of a 9-layer build.
4.2. ′formation and microhardness variation
By measuring the microhardness changes along the length of multilayer deposits comprising different numbers of layers and by employing DSC analysis it can be inferred that differ-ences exist in the ␥′ precipitation along the length of these
deposits. Considering, first, the 1-layer deposit (equivalent to a fusion zone of a conventional weld) the material had a low hard-ness of approximately 275 kgf/mm2. This is very much less than the hardness of the STA wrought Waspaloy which had a hard-ness of 419±8 kgf/mm2. This low hardness is presumably due to the fact that very little ␥′ formed at this location which was in
direct contact with the base plate, i.e. a large heat sink, and thus had been subjected to a high cooling rate. This hardness value agrees with the observations of Sekhar and Reed[27]and Li et al.[28]who reported that the fusion zones of laser and electron beam welded Waspaloy sheet had hardness values in the range 260–280 kgf/mm2. As was the case in the present study, Sekhar and Reed[27]were also unable to find evidence for␥′formation in
the fusion zone using a FEG-SEM and were only able to infer
evi-dence for its early stage formation by using transmission electron microscopy.
In the present work, DSC analysis was employed to investigate whether there was indirect evidence for␥′ formation. Although,
there appear to be no other reports in the literature on the DSC anal-ysis of precipitation in Waspaloy, the marked endothermic peak seen in curve E (STA wrought sample shown to have␥′present by
SEM analysis,Fig. 9) in comparison with the relatively weak peak seen in curve A (STQ sample) confirms that the technique is suffi-ciently sensitive enough to detect␥′dissolution during heating in a
DSC. Therefore, the shallow endothermic peak in curve B ofFig. 10
would seem to strongly suggest that very little␥′formed in the
1-layer deposit which had a microhardness of only 280 kgf/mm2. With regard to the 9-layer deposit, the final layer had a signifi-cantly higher hardness,∼325 kgf/mm2, than that of the 1- layer deposit. The DSC scan of the sample from this location (thermo-gram C) shows a somewhat larger endothermic peak suggesting that more␥′formed at this location. The reason for this is that the
cooling rate of the final layer deposited in the 9-layer build was sig-nificantly lower than that of the 1-layer deposit. This would have allowed more time for nucleation and growth of␥′ and hence a
higher volume fraction and higher hardness. Finally, material at the base of the 9-layer deposit had a hardness approximately equal to 375 kgf/mm2. The DSC thermogram from the sample at this loca-tion, trace D, reveals an endothermic peak larger than that for B or C, suggesting significantly more␥′formation. However, the
endother-mic peak in D is smaller than in the STA sample (E) suggesting that the amount of␥′at location D is less than the 0.25–0.30 volume
frac-tion expected in fully aged material[15,29]. Broadly, the reasons for this can be set out as follows. The base of the 9-layer deposit experiences a number of thermal cycles due to the deposition of subsequent layers; giving rise, effectively, to a number of post-weld heat treatment cycles. Such cycles are expected to increase the size of␥′that nucleated on the deposition thermal cycle and
produce additional secondary␥′on subsequent thermal cycles.
Fur-thermore, the␥′precipitate size appears to be less than 50 nm as it
could not be imaged by FEG – SEM. This is consistent with the TEM observations of Jawwad et al.[29,30]who observed␥′diameters
of 20–40 nm in Waspaloy that had been electron beam welded and given a short post weld heat treatment.
5. Conclusions
It was found possible to deposit pore and crack free Waspaloy by the direct metal deposition process using wire as a feedstock material and a high-powered diode laser as the heat source. Walls can be built which in the present study were up to 19 mm high, 6 mm thick and 100 mm in length. A columnar-dendritic solidifi-cation structure forms with the dendrites growing approximately in the plane of the wall and at an angle of around 30◦to the build direction. The dendrites grow epitaxially across multiple deposited layers and the orientation is accounted for in terms of the likely melt pool shape. The deposit also exhibits layer bands correspond-ing to the depth of remeltcorrespond-ing in each successive pass and are due to localized dendrite arm coarsening. The secondary dendrite arm spacing increases significantly from the bottom to the top of a build and this reflects the changing cooling rate during. The microhard-ness of multilayer walls decreases from bottom to top, i.e. along the build direction and the magnitude of this variation depends on the number of layers deposited in the wall. These differences are believed to be related to the effect of multiple heating and cool-ing cycles on the microstructure, the solute distribution and the␥′
precipitation. The␥′precipitates could not be detected by FEG
sub-N.I.S. Hussein et al. / Materials Science and Engineering A 497 (2008) 260–269
50 nm size. However, the endothermic peaks seen in DSC traces are interpreted as providing evidence for differences in␥′
precipi-tation between samples from different positions in the multilayer deposits.
Acknowledgements
N. Hussein is grateful to the Ministry of Higher Education of Malaysia and Universiti Teknikal Malaysia Melaka for providing support for Ph.D. study at the University of Nottingham.
References
[1] D.M. Keicher, J.M. Smugeresky, JOM 49 (5) (1997) 51–57.
[2] W. Hofmeister, M.L. Griffith, M. Ensz, J.M. Smugeresky, JOM 53 (9) (2001) 30–34. [3] G.K. Lewis, E. Schlienger, Mat. Design 21 (2000) 417–423.
[4] S.M. Kelly, S.L. Kampe, Met. Mat. Trans. A 35A (2004) 1861–1867. [5] S.M. Kelly, S.L. Kampe, Met. Mat. Trans. A 35A (2004) 1869–1879. [6] P.A. Kobryn, E.H. Moore, S.L. Semiatin, Scripta Mat. 43 (2000) 299–305. [7] J. Beuth, N. Klingbeil, JOM 53 (9) (2001) 36–39.
[8] A.J. Pinkerton, M. Karadge, W.U.H. Syed, L. Li, J. Laser App. 18 (3) (2006) 216–226. [9] M. Gaumann, S. Henry, F. Cleton, J.D. Wagniere, W. Kurz, Mat. Sci. Eng. A A271
(1999) 232–241.
[10] M. Gaumann, C. Bezencon, P. Canalis, W. Kurz, Acta Mat. 49 (2001) 1051–1062. [11] K.A. Mumtaz, P. Erasenthiran, N. Hopkinson, J. Mat. Proc. Tech. 195 (2008) 77–87. [12] F. Schneebeli, O. Braun, B. Tanner, R. Dekumbis, US Patent 5,233,150 (1993).
[13] N.I.S. Hussein, D.G. McCartney, I.R. Pashby, J.I. Segal, Proceedings of 26th Inter-national Congress on Applications of Lasers & Electro-Optics (ICALEO), Laser Institute of America (LIA), Florida, 2007.
[14] M.J. Donachie, Superalloys Source Book, ASM International, Ohio, 1984. [15] K.M. Chang, X. Liu, Mat. Sci. Eng. A A308 (2001) 1–8.
[16] M. Durand-Charre, The Microstructure of Superalloys, Gordon and Breach, Ams-terdam, 1997.
[17] R.V. Miner, J. Gayda, R.D. Maier, Met. Trans. A 13A (1982) 1755–1765. [18] M.B. Henderson, D. Arrell, R. Larsson, M. Heobel, G. Marchant, Sci. Tech. Welding
Joining 9 (1) (2004) 13–21.
[19] S. Kou, Welding Metallurgy, second ed., Wiley Interscience, New Jersey, 2003. [20] ASM Handbook – Heat treating, 10th ed., ASM International, Ohio, 1991. [21] K.E. Easterling, Introduction to the Physical Metallurgy of Welding,
Butter-worths, London, 1983.
[22] Y. Murata, M. Morinaga, N. Yukawa, H. Ogawa, M. Kato, The First Pacific Rim International Conference on Advanced Materials and Processing (PRICM-1), TMS, Warrendale, PA, 1993, 307–316.
[23] W. Kurz, D.J. Fisher, Fundamentals of Solidification, fourth ed., Trans Tech Pub-lications, Zurich, 2002.
[24] M. McLean, Directionally Solidified Materials for High Temperature Service, The Metals Society, London, 1983.
[25] A.K. Bhambri, T.Z. Kattamis, J.E. Morral, Met. Trans. B 6B (1975) 523–537. [26] D. Rosenthal, Trans. ASME 68 (1946) 849–865.
[27] N.C. Sekhar, R.C. Reed, Sci. Tech. Welding and Joining 7 (2002) 77–87. [28] Z. Li, S.L. Gobbi, F. Bonollo, A. Tiziani, G. Fotana, Sci. Tech. Welding J. 3 (1998)
1–7.
[29] A.K.A. Jawwad, M. Strangwood, C.L. Davis, Metall. Mat. Trans. A 34A (2003) 1637–1645.