JSPS DGHE
Core University Program in Applied Biosciences
PROCEEDINGS OF THE 3rd SEMINAR
TOWARD HARMONIZATION BETWEEN
DEVELOPMENT AND ENVIRONMENTAL
CONSERVATION IN BIOLOGICAL PRODUCTION
December,
3"'
-
5" ,2004
Serang, Banten (INDONESIA)
Organized Jointly by
Bogor Agricultural University
The University of Tokyo
Government of Banten Province
0 1 -9
Water level in Rawa Danau Swamp in Cidanau Watershed, at
present and in the past
Sho ~hiozawa", Norio ~ a j i t a " , Masaya ISHIKAWA'~, Akira ~ o t o * ~ , Yohei Satoe3, Erizal Rangkayo
Bass*',
Budi lndra Setiawan"*1: Graduate School of Agricultural and Life Sciences, The University of Tokyo
*2: Faculty of Agriculture, Utsunomiya University
*3: Tokyo Agricultural University
*4: Faculty of Agricultural Technology, Bogor Agricultural University
*5: Faculty of Agriculture, Yamagata
Abstract
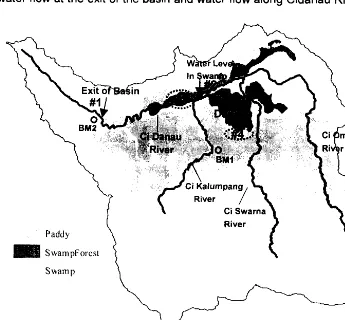
Cidanau River flows from Rawa Danau swamp, collecting water in Cidanau watershed, and
out from the watershed at a waterfall, Cirug Betung. At the exit from the watershed, excavation of a
channel, completed in 1940s, has lowered water level upstream. We investigated water levels and
their fluctuations in the swamp by conducting a land survey and leveling, and by installing water level
sensors. Water flow models that control the water levels in the swamp and at the exit are also
considered and applied. Based on the observations and the hydraulic models, present water level
change, water level difference between at present and in the past, the effects of water storage in the
swamp on both draught and flood discharges are calculated and discussed.
1 . Introduction
Rawa Danau is a large tropical fresh water swamp, which is precious in Indonesia. The
swamp with the surrounding area has been appointed as a natural reserve because of its
precious ecosystem including distinct fauna and flora. It exists in the bottom of Cidanau
River Basin, a large caldera. Cidanau River flows from the swamp to the exit of caldera,
where a waterfall exists, named Cirug Betung. Natural and Social issues about Cidanau
River Basin, including human activities that might have affected the environment of Rawa
Danau have been reported and discussed in previous studies (Budi and Sato, 1999; Goto
et. al, 2002). According to the report (Goto et. al, 2002), an artificial drainage channel had
been excavated at the exit of Cidanau River from the caldera, in order to lower water level
inside the river basin and to create paddy fields. It is said that the excavation work, which
was commenced by the Dutch Colonial government and completed by the Japanese Army
in 1940s, made the height of the waterfall 24 m, which used to be 30m.
Although the excavation of the flow path at the exit of the basin must have lowered the
and present Rawa Danau swamp, it is not known how much the water level in the swamp lowered. It is even not known about how much the water level changes over a year at present and how much water surface area is in the swamp. The water level change due discharge change determines the natural water storage capacity of the swamp, together with the water surface area.
The questions we had for this study were:
(1) How much does the annual water level change in the swamp?
(2) How much was the water level higher in the past before the drainage channel was excavated at the exit of the basin?
(3) What is the hydraulic mechanism that determines the water level and its chaqge in the swamp at present, and what was in the past?
(4) Is the water storage capacity of Rawa Danau significant, as water resource and flood control?
In this study, firstly, we conducted the ground-leveling survey, in order to compare ground levels and water levels among the excavated exit channel, old riverbed at the exit, Rawa Danau swamp, and the outer edge of the swamp forest. Secondly, we tried to monitor water level fluctuations in the swamp and at the exit, by installirrg water level sensors. Thirdly, we analyzed water flow at the exit of the basin and water flow along Cidanau River in order to
Paddy
Swam1
Swam1 Forest
[image:3.603.104.449.411.731.2]\
know the hydraulic mechanism that determines water level variation with discharge in Ram Danau. Finally, by using the hydraulic model, we calculated annual water level
variation that really occurs at present and that occurred in the past. Water storage
capacities of the swamp in the dry season and at flood events are also discussed briefly.
2. Leveling of land
Surveying and leveling was conducted by using a super theodolite (Nikon, NST-20ST).
This device automatically calculates the level difference between the device and a mirror by
measuring the distance to the mirror with Laser and obtaining the angle between
automatically detected horizontal line and the straight line to the mirror. We got relative
elevations around Rawa Danau (point #2, #4 in Fig.1) with reference to BM1 (in Fig.l), and
around the exit of the basin (pint #1) with reference to BM2. Then, we measured level
difference between BM1 and BM2. However. we could not have known the definite altitudes
of the benchmark stones of both BM1 and BM2. Therefore, altitudes of all points in this
paper are expressed by assuming the altitude of BM1 as 98.22 m, a likely value.
Main results of the elevations are:
(1) Riverbed in the swamp (point #2) is about 2.0
-
2.2 m higher than the riverbed at the exit of the basin (point #A).The ground on the outer edge of the swamp forest (point #4) is only about 0.3 m higher
than the ground at point # I , indicating that the swamp and swamp forest are basically flat
3. Structure of exit of the basin and excavated conduit
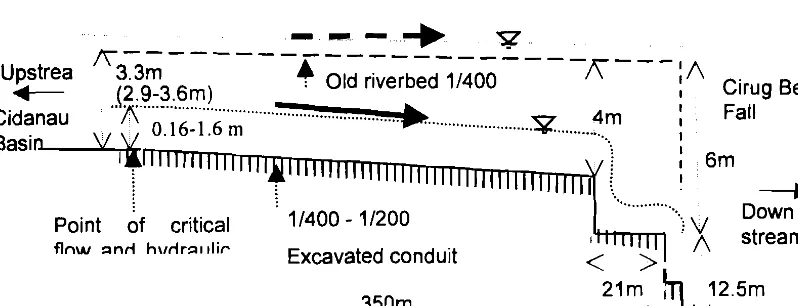
The exit of Cidanau River from the basin is a valley, and Cirug Betung Fall is 350 m apart
from the entrance of the valley. Between the entrance of the valley and the fall, the artificial
conduit of 13 m width was excavated along the old river whose width was 80-100 m. Plane
view and longitudinal section of excavated conduit at the exit from the basin are drawn in
figure 2 and 3 according to our land survey and leveling. While the riverbed of the
excavated conduit is about 4 m lower than the old riverbed at the end of the conduit, it is
about 3.3 m lower at the entrance of the conduit. The gradient of excavated conduit is
about 11300, and water flow there is sub critical near critical flow. The entrance of the
conduit is designed narrow (10 m width) such that critical flow and hydraulic jump are formed there.
f
Cida Basin
Old riverbed
- - - )
80 -100 mCritical flow
\
v
I A Fall
Exc
+
va ted
Fig.2 Plane view of the excavated conduit at exit of the basin
I
point of critical 11400
-
11200flnw and htrdral llir
Excavated conduit
...
::
v
Downh m - y
"' A stream/
I
Fig. 3 Longitudinal section of excavated conduit at the exit of the basin
I
4. Observation of water level change in Rawa Danau
In order to monitor water level changes, we installed water level sensors (Diver) in Rawa Danau, near the exit of the swamp (point #2), and at the exit of the basin, very
near but upstream of the point of critical water depth (point #1). However,
unfortunately, we lost four sensors repeatedly before data retrieval, and data we got in
the swamp was only about two months in rainy season shown in Fig.8. During this
period, water level in the swamp changed about 0.6 m.
5. Water flow at the exit of the basin (entrance of artificial conduit)
According to basic theory of hydraulics, specific energy of water (total head) with
reference to the height of riverbed is expressed by
where
v
is mean velocity of water over the cross-sectional area of flow, h is the heightof water surface from riverbed, and g is acceleration of gravity. For rectangle
[image:5.603.114.450.82.213.2] [image:5.603.93.492.268.421.2]Critical depth,
h,
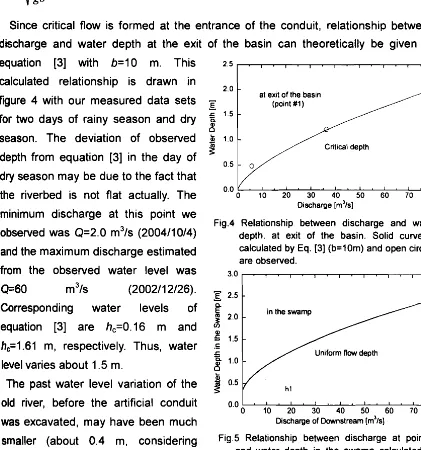
, is defined as the water depth of condition dx/dh=O, and is given bySince critical flow is formed at the entrance of the conduit, relationship between discharge and water depth at the exit of the basin can theoretically be given by
equation [3] with b=10 m. This 2.5
.
.
.
.
,.
,.
.
.
calculated relationship is drawn in
figure 4 with our measured data sets
for two days of rainy season and dry
season. The deviation of observed
depth from equation [3] in the day of
dry season may be due to the fact that
the riverbed is not flat actually. The minimum discharge at this point we
observed was Q=2.0 m31s (200411014)
and the maximum discharge estimated
from the observed water level was
Q=60 m 3 1 ~ (200211 2126).
Corresponding water levels of
equation [3] are h,=0.16 m and
h,=1.61 m, respectively. Thus, water
level varies about 1.5 m.
The past water level variation of the
Fig.4 Relationship between discharge and water depth. at exit of the basin. Solid curve is calculated by Eq. [3] (b=lOm) and open circles are observed.
I
old river, before the artificial conduit o . o I ~ t c l c f ~ l A 1 ~ l ~ l ~ ~
0 10 20 30 40 50 60 70 80
was excavated, may have been much Discharge of Downstream IS]
smaller (about 0.4 m, considering Fig.5 Relationship between discharge at point#3
and water depth in the swamp calculated by
rough river bed) because of the river Eq.[6] ( hl=0.3 m, b=20m, n=0.03, 1=111000)
width of 80-1 00 m.
6. Calculation o f water level along Cidanau River
In order to know the hydraulic mechanism that determines the water level and its
fluctuation in Rawa Danau Swamp, we analyzed water flow along Cidanau River,
[image:6.599.51.472.161.611.2]where v is the mean velocity of water over the cross-sectional area of flow, R is the
hydraulic mean depth (cross-sectional area divided by wetted perimeter) ,
n
is the coefficient of roughness, and I is the hydraulic head gradient. For rectangle cross-section ofwide width (b>>h),
R
is approximated byR=h.
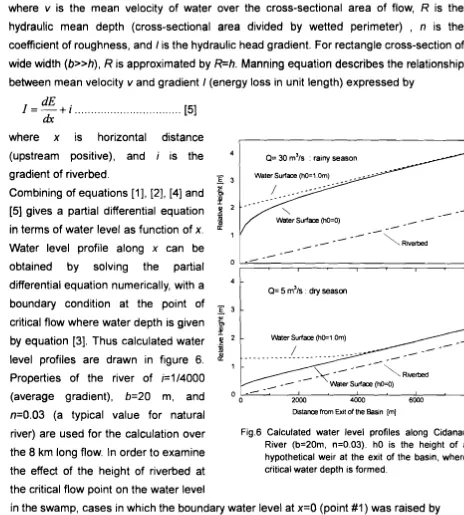
Manning equation describes the relatior~ship between mean velocity v and gradient I (energy loss in unit length) expressed bywhere x is horizontal distance
I
1
1
(upstream positive), and i is the Q= 30 m3/s : rainy season gradient of riverbed.
Combining of equations [ l ] , [2], [4] and
5
[5] gives a partial differential equation
--
---
Water Surface (hO=O)
--
in terms of water level as function of x.Water level profile along x can be
/
- -
obtained by solving the partial 0 I
--
I I I Idifferential equation numerically, with a
4 t
Q= 5 m3/s : dry season boundary condition at the point of-
,
critical flow where water depth is given
5
iby equation
[3].
Thus calculated water2
- W t e r Surface (h0=1 .Om)m
level profiles are drawn in figure 6.
1
Properties of the river of i=1/4000
W t e r Surface (hO=O) (average gradient), b=20 m, and o
--
a I I I0 2000 4000 6000 8000
n=0.03 (a typical value for natural Distance from Exit of h e Basin [mi
river) are used for the calculation over Fig.6 Calculated water level profiles along Cidanau River (b=20m, n=0.03). hO is the height of a
the 8 km long flow. In order to examine hypothetical weir at the exit of the basin, where
the effect of the height of riverbed at critical water depth is formed.
the critical flow point on the water level
1
in the swamp, cases in which the boundary water level at x=O (point #A) was raised by
1
1 m with hypothetical weir are also calculated and drawn in Fig.6.
I
The water level becomes parallel to the riverbed near the swamp even in case of 1 m rise
1
ofh
at x=O. The 1 m water level rise at the exit of the basin has no effect on the waterlevel in the swamp, indicating that there is no hydraulic connection between water level in
the swamp and water level at the exit of basin. In the past, there exited a large lake
between the swamp and the exit of basin, and the water level of the two points should have
been almost the same. At that time, water level in the swamp had been controlled by the
water level at the exit of the basin. However, since the water level at the exit had lowered by excavation of the conduit, water level difference (and riverbed level difference) of about 2 m
[image:7.598.39.503.72.587.2]present. The present narrow river flow path of about 20 m wide and 8 km long between two
points had been formed by means of scouring of the past lake bottom by the water flow that
had become fast with the water head difference of 2 m.
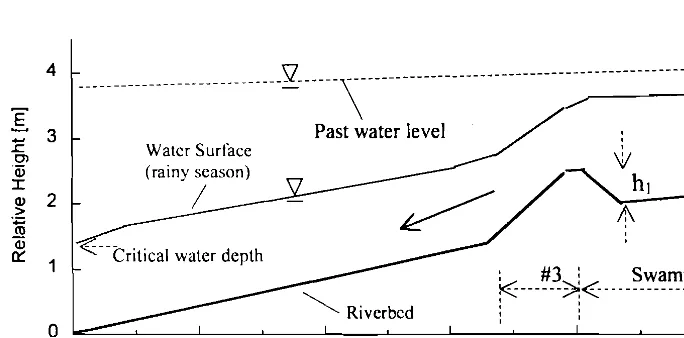
7.
Water flow that controls water level in the swampWater level of the swamp at present is considered to be mainly controlled by water flow at around the end of the swamp (position #3 in Fig.1). The velocity of the flow there is remarkably fast compared with upper part (in the swamp) and lower part, indicating that the riverbed gradient is steep there as illustrated in figure 7. The position #3 is at and
downstream of the confluence of Cikalumpang River to Cidanau River. Therefore discharge at position #3 (downstream of the confluence) and discharge in the swamp (upstream of
the confluence, position #2) are different. However, it can be assumed that the water level changes at the two points are the same.
We assume a uniform flow there, for which hydraulic gradient I is uniform (equal to
riverbed gradient) along the flow and is constant regardless of discharge. The uniform flow
tends to be attained within a short distance for places of such steep riverbed gradient.
Based on Manning equation of [4] and using equation [2], the water depth of the uniform
flow is derived as function of discharge Q as follows:
3 3 3
In equation [6], the value of n 3 b - 3 ~ - l o is regarded to be a constant ( I is only one unknown
property), and we can determine it by using observed data sets of h and Q.
\
Past water level
Watcr Surface eason)
0 2000 4000 6000 8000 10000
[image:8.598.80.422.480.649.2]D~stance from Exit of the Basin [m]
Fig. 7 Schematic illustration of riverbed and water level profiles along Cidanau River.
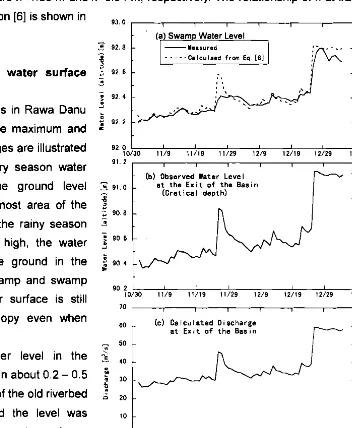
We could obtain water level data at both point #I, and #2 in a rainy season, which is
shown in figure 8-a and 8-b. Discharge at #1 was calculated by equation [3] (figure 8-c) and
the discharge at #3 (Q in equation [6]) was estimated to be 314 of discharge at #1 for the
determined the constant (1=111000, with b=20 m and n=0.03). Figure 7-a compares such
calculated h and observed h at #2 (a constant riverbed height is assumed). A good
agreement between them implies that even for a flood event (2002/12/29), the width of
the main flow pass at position #3 is constant, and therefore water level fluctuation in the
swamp is described by equation [6].
Whereas the observed h at point #2 was limited to a rainy season, in which h varies by 0.6 m, the maximum and the minimum h at position #3 that correspond to the maximum and
the minimum Q (45 and 2.0 m3/s, respectively) can be calculated as h=1.35 m and h=0.24 m, respectively. Thus, h at #2 and #3 varies by 1.3 m. Since actuary measured h at #2 for Q
at #3 of 2.0 m3/s was about h=0.54
m,
instead of h=0.24 m, a riverbed difference between#2 and #3 is estimated to be hl=0.3 m. Therefore, the maximum and the minimum h in the
swamp (position #2) are h=1.85 m and h=0.54 m, respectively. The relationship of h at #2
[image:9.598.162.514.288.716.2]and Q at #3 by equation [6] is shown in figure 5.
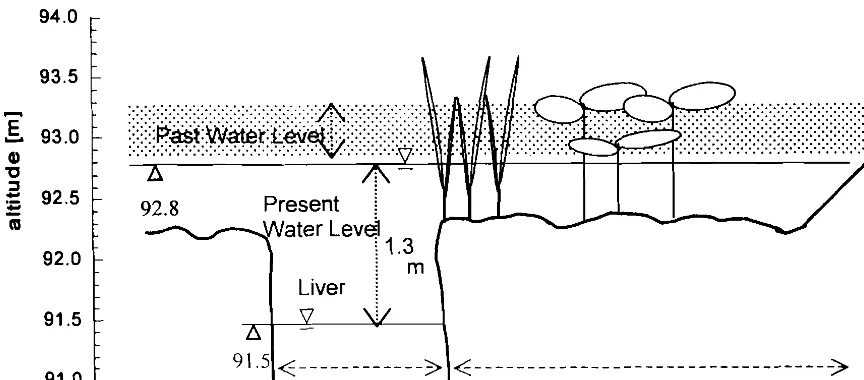
8. Water level and water surface area in Rawa Danau
Water surface levels in Rawa Danu
that correspond to the maximum and
the minimum discharges are illustrated
in figure 9. In the dry season water
surface is under the ground level
(within river) in the most area of the
swamp. However in the rainy season when water level is high, the water
surface is above the ground in the most area of the swamp and swamp
forest, but the water surface is still
under the plant canopy even when
flood events occur.
In the past, water level in the
swamp may have been about 0.2
-
0.5m above the altitude of the old riverbed
at the point #1, and the level was
higher than the present maximum
water level but close to it. The past
water level change due to discharge
change was much smaller than
-
(a Swam Water Level Z 9 2 . 8Calculaed t 'from Eq. [ e l y l-
aS
; 92. 8
- 8 5
- (b) Observed Water Level - 1
-
Z, 91.0 - a t t h e E x i t o f t h e Basin
-
a ( C r e t i c a l depth) - 10
C
; 9 0 8 -
-
m
-
- 1-
:
9 0 6 - .a
1 - 1
%
9 0 4 -= -
1
60
1
(c) Ca lcu l a t e d D i scharge
a t E x i t o f t h e Basin
v
0 1 I I I I I I I
10/30 11/9 11/19 11/29 12/9 12/19 12/29 1/8 Date (2002)
present fluctuation because old river at point #I was much wider than the present conduit.
Excavation of the conduit at point #I may have lowered water level in the swamp by about
1m on average, and made the change of water level in a year larger. The lowering of the
water level may have decomposed peat on ground surface a thickness of up to about 1 m
in swamp forest, and the edge of the swamp forest (for example at point #4) receded by
100
-
200 m.Although the lowering of the water level at the exit of the basin was 2
-
3 m, that Inthe swamp was limited to 1 m because riverbed at posit~on
#3
is high and this portion keeps the water level of upstream high There must be hard ground at position #3 that prevents scouring of the riverbed.9. Effects of water storage in Rawa Danau
In dry season, the swamp has almost no effect to increase the draught water flow rate
because water surface exists only within the narrow river of 10
-
20 m width and waterstorage change there is negligible. However, In rainy season, water surface spreads over a
t large area in the swamp and water storage change due to discharge change becomes
large. Rawa Danau Swamp has significant effect to reduce flood peek discharge by storing water. For example, in the flood event on 2002112129, water level in the swamp increased
by 0.29 m in a day, and the est~mated flow rate from the swamp was 44 m3/s. If water
surface spread over all the swamp area of 18 km2, the increased volume stored in the
swamp was 5.2*106 m3 in a day, which is equivalent to a flow rate of 60 m3/s. Water storage
in
the swamp reduced the flood discharge from 104 m3/s to 44 m3/s in this example.i 94.0
E
-
(D
'
'
"" 92.0 9 y E ~ ~ ~ e v ! , . L L [image:10.601.52.484.463.653.2]Liver
10. Conclusion
Water level of Rawa Danau Swamp now varies about 1.3 m depend on discharge. It used be about 1 m higher, controlled by, and almost the same as, the water level at the exit of the watershed. Since the past flow at this exit was wide and water level varies in a small range, water level fluctuation in swamp was also small, in addition to its higher water level than present. After the artificial cannel was dug, hydraulic connection between the water level at the exit and water level at the swamp had disappeared. Now, water revel at the Swamp is governed by water flow around the end of the swamp, where riverbed gradient is steep. This part of the river keeps water level of the swamp 2 m higher than water level at the exit of the watershed.
Although the swamp has almost no effect to increase the draught flow rate because water surface exists only within the narrow river in a dry season, the swamp has significant effect to reduce flood peek flow rate by storing large volume of water because water surface spreads over the swamp when a flood occurs.
Excavation of the drainage channel produced a large paddy area. However, it may have brought a significant effect on the swamp environment by lowering water level and increased its fluctuation Some thickness up to 1 m of peat may have decomposed in the swamp forest. Another important effect on the swamp environment that the development of the watershed has brought is the fertile water quality. Water quality problem is discussed in a separate paper.
References
Budi I. S. and S. Yohei, 1999. Studies on Environmental Chaqges and Sustainable Dvelopment of Cidanau Watershed. Proc. of International Workshop on Susutainable Resource Management of Cidanau Watershed Vol.1, RUBRD-UTIIPB, Bogor, Indonesia, pp.l.1-1,lO.
Goto A., K. Yoshida, T. Shimizu and Y. Purwanto, 2001. Investigation on Hydrologic Water Balance for Integrated Watershed Management Planning in Cidanau River Basin, West Java, Proceedings of the 1 st Seminar, Toward Harmonization between Development and Environmental Conservation in Biological Production, February 21-23, 2001, The
University of Tokyo, pp 187-1 94