1
SAE2009 Conference on Small Area Estimation June 29 - July 01, 2009, Elche, Spain
Hierarchical Bayes Estimation Using Time Series
and Cross-sectional Data:
A Case of Per-capita Expenditure in Indonesia
Kusman Sadik and Khairil Anwar Notodiputro
Department of Statistics, Bogor Agricultural University / IPB Jl. Raya Dramaga, Bogor, Indonesia 16680
Abstract
In Indonesia, there is a growing demand for reliable small area statistics in order to assess or to put into policies and programs. Sample survey data provide effective reliable estimators of totals and means for large area and domains. But it is recognized that the usual direct survey estimator performing statistics for a small area, have unacceptably large standard errors, due to the circumstance of small sample size in the area. The primary source of data for this paper is the National Socio-economic Survey (Susenas), a survey which is conducted every year in Indonesia. However, the estimation of Susenas village per-capita expenditure is unreliable, due to the limited number of observations per village. Hence, it is important to improve the estimates. We proposed a hierarchical Bayes (HB) method using a time series generalization of a widely used cross-sectional model in small area estimation. Generalized variance function (GVF) is used to obtain the estimates of sampling variance.
Key words: Linear mixed model, Hierarchical Bayes, posterior predictive assessment, generalized variance function, block diagonal covariance, Kalman filter, state space model.
1. Introduction
The problem of small area estimation is how to produce reliable estimates of area (domain) characteristics, when the sample sizes within the areas are too small to warrant the use of traditional direct survey estimates. Sample survey data provide effective reliable estimators of totals and means for large areas and domains. But it is recognized that the usual direct survey estimators performing statistics for a small area, have unacceptably large standard errors, due to the circumstance of small sample size in the area. In fact, sample sizes in small areas are reduced, due to the circumstance that the overall sample size in a survey is usually determined to provide specific accuracy at a macro area level of aggregation, that is national territories, regions ad so on (Datta and Lahiri, 2000).
Demand for reliable small area statistics has steadily increased in recent years which prompted considerable research on efficient small area estimation. Direct small area estimators from survey data fail to borrow strength from related small areas since they are based solely on the sample data associated with the corresponding areas. As a result, they are likely to yield unacceptably large standard errors unless the sample size for the small area is reasonably large(Rao, 2003). Small area efficient statistics provide, in addition of this, excellent statistics for local estimation of population, farms, and other characteristics of interest in post-censual years.
2. Indirect Estimation in Small Area
A domain (area) is regarded as large (or major) if domain-specific sample is large enough to yield direct estimates of adequate precision. A domain is regarded as small if the domain-specific sample is not large enough to support direct estimates of adequate precision. Some other terms used to denote a domain with small sample size include local area, domain, small subgroup, sub-province, and minor domain. In some applications, many domains of interest (such as counties) may have zero sample size.
brought into the estimation process through a model (either implicit or explicit) that provides a link to related areas and/or time periods through the use of supplementary information related toy, such as recent census counts and current administrative records (Pfeffermann 2002; Rao 2003).
Methods of indirect estimation are based on explicit small area models that make specific allowance for between area variation. In particular, we introduce mixed models involving random area specific effects that account for between area variation beyond that explained by auxiliary variables included in the model. We assume thati =g(Yi) for some specifiedg(.) is related to area
specific auxiliary datazi= (z1i, …, zpi)Tthrough a linear model
i=ziT+bivi, i= 1, …, m
where thebiare known positive constants andis thepx1 vector of regression coefficients. Further,
the vi are area specific random effects assumed to be independent and identically distributed (iid)
with
Em(vi) = 0 andVm(vi) =v2(0), orviiid (0,v2)
3. General Linear Mixed Model
Datta and Lahiri (2000), and Rao(2003) considered a general linear mixed model (GLMM) which covers the univariate unit level model as special cases:
yP=XP+ZPv+eP
Hence v and eP are independent witheP N(0, 2P) and v N(0, 2D()), where P is a known positive definite matrix and D() is a positive definite matrix which is structurally known except for some parameters typically involving ratios of variance components of the form i2/2.
Further, XP and ZP are known design matrices and yP is the N x 1 vector of populationy-values. The GLMM form :
where the asterisk (*) denotes non-sampled units. The vector of small area totals (Yi) is of the form
Ay+Cy* withA= mi Tn
We are interested in estimating a linear combination, = 1T + mTv, of the regression parametersand the realization of v, for specified vectors,land m, of constants. For known, the BLUP (best linear unbiased prediction) estimator ofis given by (Rao, 2003)
H
~ = t(,y) =1T~
+mT~v =1T~ +mTGZTV-1(y-X~)
Model of indirect estimation, ˆi ziT+ bivi + ei, i= 1, …, m, is a special case of GLMM with block diagonal covariance structure. Making the above substitutions in the general form for the BLUP estimator ofi, we get the BLUP estimator ofias:
4. Hierarchical Bayes for State Space Models
Many sample surveys are repeated in time with partial replacement of the sample elements. For such repeated surveys considerable gain in efficiency can be achieved by borrowing strength across both small areas and time. Their model consist of a sampling error model
ˆit it+eit, t= 1, …,T;i= 1, …,m it=zitTit
where the coefficientsit= (it0,it1, …, itp)Tare allowed to vary cross-sectionally and over time,
and the sampling errors eitfor each area iare assumed to be serially uncorrelated with mean 0 and
3
It is a special case of the general state-space model which may be expressed in the form yt = Ztt+t; E(t) = 0, E(ttT) =t
t = Htt-1+At; E(t) = 0, E(ttT) =
wheret andt are uncorrelated contemporaneously and over time. The first equation is known as
the measurement equation, and the the second equation is known as the transition equation. This model is a special case of the general linear mixed model but the state-space form permits updating of the estimates over time, using the Kalman filter equations, and smoothing past estimates as new data becomes available, using an appropriate smoothing algoritm.
The vectort is known as thestate vector. Let αt-1
~ be the BLUP estimator of
t-1based on all
observed up to time (t-1), so that α~t|t-1= Hαt-1
is the covariance matrix of the prediction errors at time (t-1). At time t, the predictor of t and its
covariance matrix are updated using the new data (yt,Zt). We have
yt-Ztαt|t-1
Based on the research conducted by Datta, Lahiri, and Maiti (2002), the model can be written as a hierarchical Bayes approach. Let ˆit be the estimator ofitfor the areai-th andt-th year (i= 1,
2, …, m; t = 1, 2, …, T). We shall consider the following hierarchical longitudinal model to improve on the estimate ˆiTofiT.
2, …,m) are known fixedT x Tpositive definite matrices.
5. Case Study
Model of small area estimation can be applied to estimate average of households expenditure per month for the villages in Bogor county, East Java, Indonesia. Data that be used in this case study are data of Susenas (National Economic and Social Survey, BPS) 2001 to 2005.
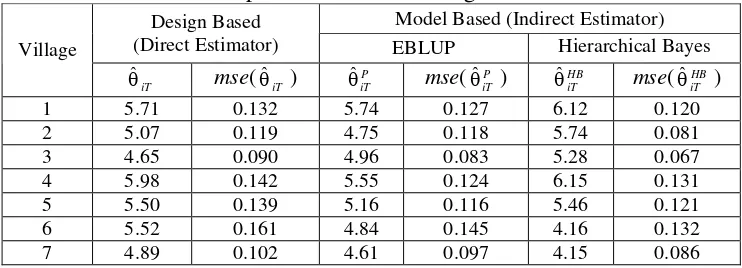
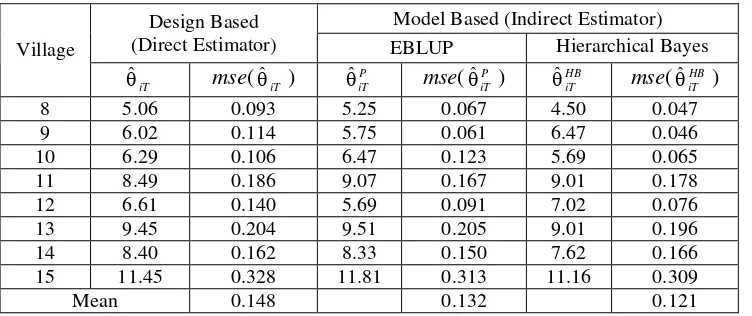
Table 1. Design based and model based estimates of households expenditure per-month for the villages
Model Based (Indirect Estimator) Design Based
(Direct Estimator) EBLUP Hierarchical Bayes
Village
1 5.71 0.132 5.74 0.127 6.12 0.120
2 5.07 0.119 4.75 0.118 5.74 0.081
3 4.65 0.090 4.96 0.083 5.28 0.067
4 5.98 0.142 5.55 0.124 6.15 0.131
5 5.50 0.139 5.16 0.116 5.46 0.121
6 5.52 0.161 4.84 0.145 4.16 0.132
Model Based (Indirect Estimator) Design Based
(Direct Estimator) EBLUP Hierarchical Bayes
Village
iT
ˆ mse(ˆiT ) P
iT
ˆ mse( P
iT
ˆ ) HB
iT
ˆ mse( HB
iT
ˆ )
8 5.06 0.093 5.25 0.067 4.50 0.047
9 6.02 0.114 5.75 0.061 6.47 0.046
10 6.29 0.106 6.47 0.123 5.69 0.065
11 8.49 0.186 9.07 0.167 9.01 0.178
12 6.61 0.140 5.69 0.091 7.02 0.076
13 9.45 0.204 9.51 0.205 9.01 0.196
14 8.40 0.162 8.33 0.150 7.62 0.166
15 11.45 0.328 11.81 0.313 11.16 0.309
Mean 0.148 0.132 0.121
Table 1 reports the design based and model based estimates. The design based estimates, ˆiT , is direct estimator based on design sampling (data of Susenas 2005, one year). The EBLUP estimates, P
iT
ˆ , use small are model with area effects (data of Susenas 2005, one year). Whereas, Hierarchical Bayes estimates, HB
iT
ˆ , use small are model with area and time effects (data of Susenas 2001 to 2005, five years). Estimated of mean square error denoted by mse(ˆiT ), mse( P
iT
ˆ ), and
mse( HB iT
ˆ ). It is clear from Table 1 that estimated mean square error of model based is less than design based. The estimated mean square error of Hierarchical Bayes (time series data) is less than EBLUP (cross-sectional data).
6. Conclusion
Small area estimation can be used to increase the effective sample size and thus decrease the standard error. For such repeated surveys considerable gain in efficiency can be achieved by borrowing strength across both small area and time. Availability of good auxiliary data and determination of suitable linking models are crucial to the formation of indirect estimators.
7. Reference
Datta, G.S., and Lahiri, P. (2000). A Unified Measure of Uncertainty of Estimated Best Linear Unbiased Predictors (BLUP) in Small Area Estimation Problems,Statistica Sinica, 10, 613-627.
Datta, G.S., Lahiri, P., and Maiti, T. (2002). Empirical Bayes Estimation of Median Income of Four-person Families by State Using Time Series and Cross-sectional Data.
Journal of Statistical Planning and Inference,102, 83-97.
Pfeffermann, D. (2002). Small Area Estimation – New Developments and Directions.
International Statistical Review,70, 125-143.
Pfeffermann, D. and Tiller, R. (2006). State Space Modelling with Correlated Measurements with Aplication to Small Area Estimation Under Benchmark Constraints. S3RI Methodology Working Paper M03/11, University of Southampton. Available from: http://www.s3ri.soton.ac.uk/publications.
Rao, J.N.K. (2003). Small Area Estimation. John Wiley & Sons, Inc. New Jersey.
Rao, J.N.K., dan Yu, M. (1994). Small Area Estimation by Combining Time Series and Cross-Sectional Data. Proceedings of the Section on Survey Research Method. American Statistical Association.
Swenson, B., dan Wretman., J.H. (1992). The Weighted Regression Technique for Estimating the Variance of Generalized Regression Estimator.Biometrika,76, 527-537.

