DEVELOPMENT OF WATER STRESS TREATMENT SYSTEM
FOR LONG-TERM HIGH BRIX TOMATO PRODUCTION
IN HYDROPONIC CULTURE
DRUPADI CIPTANINGTYAS
GRADUATE SCHOOL
BOGOR AGRICULTURAL UNIVERSITY BOGOR
STATEMENT LETTER OF THESIS AND SOURCE OF
INFORMATION AND DEVOLUTION OF COPYRIGHT
Hereby I genuinely stated that the master thesis entitled Development of Water Stress Treatment System for Long-term High Brix Tomato Production in Hydroponic Culture is an authentic work of mine supervised by supervisory committee and never being presented in any forms and universities. All the information taken and quoted from published or unpublished works of other writers had been mentioned in the texts and attached in the references at the end of the master thesis.
I hereby assign the copyright of my papers to the Bogor Agricultural University.
RINGKASAN
DRUPADI CIPTANINGTYAS. Membangun Sistem Water Stress Treatment untuk Produksi Jangka Panjang Tomat Berkadar Gula Tinggi secara Hidroponik. Dibawah bimbingan HERRY SUHARDIYANTO dan NORIKO TAKAHASHI.
Permintaan tomat berkadar gula tinggi yang lebih dikenal sebagai fruit tomato semakin meningkat sekarang ini. Banyak penelitian mengungkapkan bahwa aplikasi water stress treatment dapat digunakan untuk memproduksi tomat berkadar gula tinggi, namun penelitian-penelitian tersebut dilakukan hanya dalam waktu singkat dengan kadar air media tanam sekitar 50%-80% (Nuruddin et al. 2003; Patane and Consentino, 2010). Telah banyak penelitan mengenai pengaruh water stress treatment terhadap pertumbuhan tanaman, namun penelitian mengenai cara mengoperasikan water stress treatment untuk meningkatkan kualitas buah tomat belum begitu banyak dilakukan. Menjaga agar tanaman tomat tetap sehat dalam kondisi water stress tidaklah mudah. Penelitian ini memperkenalkan visual monitoring system sebagai pengontrol kondisi severe water stress. Tujuan dari penelitian ini adalah membangun sebuah sistem water stress treatment untuk produksi jangka panjang tomat berkadar gula tinggi secara hidroponik dan melakukan evaluasi sistem water stress treatment yang dilakukan jangka panjang dalam kondisi severe water stress disertai perubahan musim terhadap kualitas dan kuantitas buah tomat. Selain itu, pengaruh water stress terhadap pertumbuhan tanaman juga diteliti. Semua data dari penelitian ini dapat digunakan untuk basis data dalam pembangunan sebuah sistem water stress yang lebih baik lagi.
Tanaman tomat (Solanum lycoperscium L., Momotaro Sakura) ditanam secara hidroponik diatas rockwool slabs didalam sebuah rumah tanaman di Fakultas Pertanian, Universitas Ehime. Luasan daun tanaman tomat dimonitor oleh sebuah kamera digital yang mengambil gambar setiap 15 menit. Kadar air rockwool slabs diukur dengan Water Content Meter satu kali sehari pada siang hari. Terdapat dua perlakuan dalam penelitian ini yaitu, water stress treatment dan kontrol. Kadar air media tanam dijaga sekitar 20%-30% untuk water stress treatment dan 60%-70% untuk kontrol. Pemberian irrigasi dilakukan berdasarkan proyeksi luasan daun dan kadar air media tanam. Ketika proyeksi luasan daun kurang dari 95% dari proyeksi luasan daun maksimum yang diukur setelah irigasi terakhir dan kadar air media tanam kurang dari 20%, larutan nutrisi akan dialirkan ke tanaman hingga kadar air kembali 20%. Untuk pengukuran pertumbuhan tanaman, diameter dan perpanjangan batang diukur satu kali dalam satu minggu dengan menggunakan jangka sorong dan meteran. Diameter buah, tingkat kemanisan dan tingkat keasaman diukur dengan menggunakan ISEKI Grading Machine. Kalibrasi untuk tingkat kemanisan buah tomat dilakukan secara destruktif dengan menggunakan Refractometer, sedangkan tingkat keasaman buah tomat dikalibrasi dengan menggunakan KUBOTA Fruits Selector Machine.
berkisar 11% yang mana lebih rendah dari yang diharapkan. Disisi lain, ketika radiasi matahari rendah dan kelembaban relatif tinggi, kadar air media tanam berkisar 40% yang mana lebih tinggi dari harapan. Radiasi matahari yang rendah dan kelembaban relatif yang tinggi dapat berkontibusi untuk menjaga kadar air media tanam dalam kondisi cukup tinggi. Diameter batang berkisar 4.4 mm-7.78 mm untuk water stress dan 8.45 mm-11.68 mm untuk kontrol. Perpanjangan batang berkisar 0.08 m week-1-0.18 m week-1 untuk water stress dan 0.17 m week -1
-0.25 m week-1 untuk kontrol. Baik diameter batang maupun perpanjang batang tanaman tomat pada perlakuan water stress selalu lebih kecil dan lebih lambat dari tanaman kontrol. Hasil ini meyatakan bahwa perlakuan water stress dapat mempengaruhi pertumbuhan tanaman.
Pengukuran parameter kuantitas menunjukkan, perbedaan jumlah buah yang dipanen antara perlakuan water stress dan kontrol tidaklah terlalu besar. Rata-rata jumlah buah yang dipanen untuk perlakuan water stress adalah 41.8±18.8 fruit week-1 sedangkan untuk kontrol adalah 50.1±19.4 fruit week-1. Diameter buah berkisar 634.3 mm-755.2 mm untuk water stress dan 731.9 mm-822.8 mm untuk kontrol. Meskipun rata-rata jumlah buah yang dipanen untuk kedua perlakuan tidak berbeda nyata (t-test dengan level 5%), hasil panen dari perlakuan water stress lebih rendah dibandingkan dengan kontol. Perlakuan water stress akan menghasilkan buah dengan kadar padatan terlarut yang tinggi dan ini akan terjadi seiring dengan penurunan massa buah. Hal ini dapat disebabkan oleh keterbatasan karakteristik physiologi, seperti efisiensi fotosintesis, hubungan sink-source, dan kehilangan dalam proses respirasi (Davies and Hubson 1981). Hasil ini menyatakan bahwa penurunan hasil panen pada perlakuan water stress disebabkan oleh penurunan ukuran buah.
Pengukuran parameter kualitas menunjukkan, tingkat kemanisan buah tomat dibawah perlakuan water stress selalu lebih tinggi dibandingkan dengan kontrol. Perbedaan tingkat kemanisan antara perlakuan water stress dan kontrol berkisar antara 0.2% hingga 2.5%. Patane dan Consentino (2010) melaporkan perbedaan tingkat kemanisan antara perlakuan water stress dan kontrol berkisar antara 0.55% hingga 1.4% dalam eksperimen jangka pendek. Penelitian mereka dilakukan dengan kadar air media tanam dijaga sekitar 50%. Kondisi severewater stress dalam penelitian ini, dengan kadar air media tanam berkisar 20%-30%, akan menghasilkan tomat dengan tingkat kemanisan yang lebih tinggi dibandingkan dengan moderate water stress. Tingkat keasaman buah tomat yang dihasilkan dari perlakuan water stress juga selalu lebih tinggi dari kontrol. Perbedaan tingkat keasaman antara perlakuan water stress dan kontrol berkisar antara 0.07% hingga 0.1%. Perbedaan tingkat keasaman antara kedua perlakuan dalam eksperimen jangka pendek berkisar 0.05% hingga 0.06% (Patane dan Consentino, 2010). Hasil ini menunjukkan bahwa perlakuan water stress dapat menghasilkan tomat dengan tingkat kemanisan dan tingkat keasaman yang lebih tinggi.
SUMMARY
DRUPADI CIPTANINGTYAS. Development of Water Stress Treatment System for Long-term High Brix Tomato Production in Hydroponic Culture. Supervised by HERRY SUHARDIYANTO and NORIKO TAKAHASHI.
Nowadays, the demand of high brix tomato as known as fruit tomato is increased. Many studies found that water stress treatment can be used for the production of high brix tomato, however, these are obtained for short-term experiment in water content around 50%-80% (Nuruddin et al. 2003; Patane and Consentino, 2010). The effect of water stress treatment on plant growth is well known, but how to operate the water stress treatment to increase the quality of tomato fruits is not known very well. It is not easy to grow health plant in water stress condition. This research introduces visual monitoring system to control severe water stress condition. The objectives of the present study are to develop a water stress treatment system for long-term high brix tomato production in hydroponic culture and evaluate the performance of water stress treatment system in long-term severe water condition with seasonal change on the quantity and quality of tomato fruits. Furthermore, the effect of water stress on plants growth was examined. All data that from this research could be used for database of development of water stress treatment system on tomato plants.
Tomato (Solanum lycoperscium L., Momotaro Sakura) plants were grown hydroponically on rock wool slabs in a greenhouse in Faculty of Agriculture, Ehime University. Water stress treatment was applied at 14 weeks after transplanting. Leaf area was monitored by digital camera that pictures were captured every 15 minutes. The water content of the slabs was measured by Water Content Meter once a day at noon. There are two treatments in this research, water stress treatment and control. The water content of slab was maintained around 20%-30% for water stress treatment and 60%-70% for control, which was controlled base on the projected leaf area and water content of slabs. When the projected leaf area was decreased fewer or less than 95% of the maximum projected leaf area which was measured after the last irrigation and the water content of the slab was fewer than 20%, the nutrient solution was supplied to the plant until recovering to 20%. For the growth rate measurement, stem diameter and elongation were measured once a week by caliper and measuring tape, respectively. Fruit diameter, sweetness, and sourness were measured by ISEKI grading machine. The calibrations for sweetness were conducted by destructive method with Refractometer, while the sourness was calibrated by KUBOTA Fruits Selector machine.
m week-1 for water stress and 0.17 m week-1-0.25 m week-1 for control. Both of stem diameter and elongation rate of water stress treatment were smaller than those of controls. These results suggest that water stress treatment might inhibit the plant growth.
For the yield, the differences in harvested fruit number between water stress and control were small. Average harvested fruit number for water stress and control was 41.8±18.8 fruit week-1 and 50.1±19.4 fruit week-1, respectively. Fruit diameter was about 634.3 mm-755.2 mm for water stress and 731.9 mm-822.8 mm for control. Although the averages of harvested fruit number for two treatments have no significant differences (t-test with 5% level), the yield of water stress was lower than that of control. Water stress treatment will produce high soluble solid fruits, and this will be happened along with decreasing of fruits load. This might be caused by the limitation of physiologist characteristic, such as photosynthesis efficiency, sink-source relationship, and respiratory losses (Davies and Hubson 1981). These results suggest that the decreased yield of water stress was resulted from the decreased fruit size.
For the plant quality, sweetness of fruits in water stress treatment was always higher than that in control. Difference in sweetness between water stress and control was from 0.2% to 2.5%. Patane and Consentino (2010) reported that a difference in sweetness between water stress and control was from 0.55% to 1.4% with short-term experiment. In their report, the water content in water stress was maintaining 50%. The severe water stress in this study, 20%-30% water content, would produce higher sweetness tomato compared with moderate water stress. Sourness of water stress treatment was also higher than that of control. Difference in sourness between water stress treatment and control was from 0.07% to 0.1%. The difference in sourness between two treatments in short-term experiment was from 0.05% to 0.06%, described by Patane and Consentino (2010). The result showed that water stress treatment can produce high sweetness and sourness tomato.
© Copyright owned by IPB, 2014
All rights reserved
Quoting in part or in whole of this paper without including or citing sources are prohibited. Quotation is only for educational, research, scientific writing, reports writing, criticism writing, or review a matter purposes, and the citations are not detrimental to the interests of IPB.
Thesis
Submitted in Partial Fulfillment of the requirements For Magister Sains Degree
In Study Program of Food and Agricultural Machinery Engineering
DRUPADI CIPTANINGTYAS
GRADUATE SCHOOL
BOGOR AGRICULTURAL UNIVERSITY BOGOR
2014
DEVELOPMENT OF WATER STRESS TREATMENT SYSTEM
FOR LONG-TERM HIGH BRIX TOMATO PRODUCTION
Thesis Title : Development of Water Stress Treatment System for Long-term High Brix Tomato Production in Hydroponic Culture
Name : Drupadi Ciptaningtyas Student ID : F151110071
Approved by Supervisory Committee
Prof Dr Ir Herry Suhardiyanto, M Sc Chairman
Noriko Takahashi, Ph D Member
Acknowledged by
Head of Study Program of Food and Agricultural Machinery Engineering
Dr Ir Y Aris Purwanto, M Sc
Dean of Graduate School
Dr Ir Dahrul Syah, M Sc Agr
Date of final examination: 20 March 2014
PREFERENCE
First and foremost, Praise to my Lord Allah SWT for giving me strength to accomplish my research and master thesis. All Your blessing motivated my self to achieve my master degree. This master thesis which is entitled “Development of Water Stress Treatment System for Long-term High Brix Tomato Production in Hydroponic Culture”, was based on research conducted from August 2011 to March 2012.
The writer would like to thank to Prof Herry Suhardiyanto and Noriko Takahashi Ph D as the supervisory committee for their enormous help throughout the completion of my thesis. The writer also would like to thank to Prof Hiroshige Nishina and Kotaro Takayama Ph D, for their inspiring advice, warm support and encouragement, and also the flexibility they gave me in conducting my research. Dad, Mom, and Brother, I thank you for all your love, support, and pray.
It is truly hoped that this master thesis will give a worthy addition to the existing knowledge on greenhouse technology area and the readers will get useful informations.
Bogor, March 2014
TABLE OF CONTENTS
TABLE OF CONTENT v
LIST OF TABLES vii
LIST OF FIGURES vii
APPENDIXES viii
1 INTRODUCTION 1
Research Background 1
Problem Formulation 2
Objectives of Research 3
Research Output and Benefit 3
Data Acquisitions
4
2 LITERATURE RIVIEW 5
Water Scarcity 5
Visual Monitoring System 6
Water Stress Treatment
7
3 MATERIALS AND METHODS 11
Time and Place of the Research 11
Materials 11
Equipment 12
Plant Materials and Growth Conditions 12
Hydroponic 12
Visual Monitoring System 13
Plant Growth Rate Measurement 14
Fruit Characteristic Measurement 15
Statistical Analysis 15
Research Flow Diagram
15
4 RESULT AND DISCUSSION 16
Environmental Condition 19
Sweetness 19
Sourness 22
Harvested Fruit Number 24
Fruit Diameter 25
Yield 26
Stem Diameter 28
Stem Elongation Rate
29
5 CONCLUSION AND RECOMMENDATION 30
Conclusion 32
Recommendation 32
REFERENCES 33
APPENDIX 38
LIST OF TABLES
1 Several studies about the effect of water stress treatment on tomato crops 9 2 Several studies about effect of seasonal changes on tomato crops 10
3 The doses requirement of tomato’s crop nutrient 13
LIST OF FIGURES
1 A Schematic of discriminant analysis for determination of threshold value (k) that divides the diphasic histogram into two groups (Class 1 and Class
2) 7
2 Subtropical intelligent greenhouse with the type of venlo house (1300 m2),
in Faculty of Agriculture, Ehime University 11
3 Four tomato crops planted to each rockwool cube on a rockwool slab 12 4 Schematic diagram of the water stress treatment system that controlled by
digital camera that taken pictures every 15 minutes and by measured
water content of growth medium every day 14
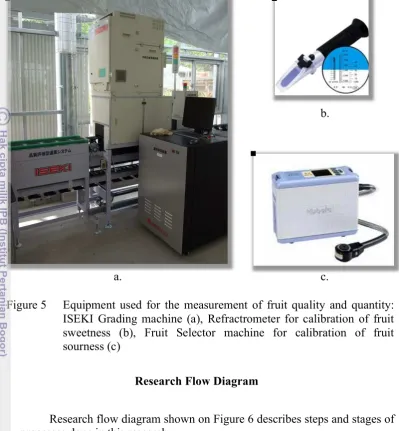
5 Equipments used for the measurement of fruit quality and quantity:
ISEKI Grading machine (a), Refractrometer for calibration of fruit sweetness (b), Fruit Selector machine for calibration of fruit sourness (c) 16
6 Research flow diagram 18
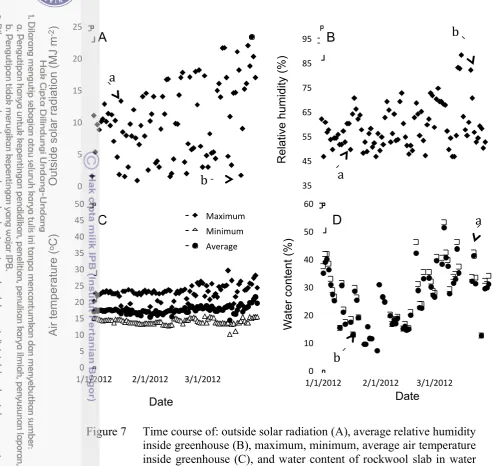
7 Time course of: outside solar radiation (A), average relative humidity inside greenhouse (B), maximum, minimum, average air temperature inside greenhouse (C), and water content of rockwool slab in water stress
treatment (D). 20
8 The ratio differences of projected leaf area with different water content (March 25, 2012). The percentage of projected plant area were measured by compared the pixel number of plant area at that time with
the pixel number of plant area from the picture that took after last
irrigation 21
9 Variation of fruit sweetness during research period due to: water stress
treatment (A), and seasonal change (B). 23
10 Variation of fruit sourness during research period due to: water stress
treatment (A), and seasonal change (B). 24
11 Variation of harvested fruit number during research period due to:
water stress treatment (A), and seasonal change (B). 25 12 Variation of fruit diameter during research period due to: water stress
treatment (A), and seasonal change (B). 27
13 Variation of yield during research period due to: water stress treatment
(A), and seasonal change (B). 28
14 Variation of stem diameter of tomato plants during the research period due to; water stress treatment (A), seasonal change (B). 29 15 Stem elongation rates of tomato plants during the research period due to;
APPENDIXES
1 Timeline 38
2 The effect of water stress treatment on fruit sweetness 40 3 The effect of water stress treatment on fruit sourness 41 4 The effect of water stress treatment on fruit diameter 42
5 The effect of water stress treatment on yield 43
6 The effect of water stress treatment on stem diameter 44 7 The effect of water stress treatment on stem elongation rate 45 8 The effect of seasonal change on fruit sweetness 46
9 The effect of seasonal change on fruit sourness 47
10 The effect of seasonal change on fruit diameter 48
11 The effect of seasonal change on yield 49
12 The effect of seasonal change on stem diameter 50
13 The effect of seasonal change on stem elongation rate 51
1
INTRODUCTION
Research Background
Water is one of the most important factor in agriculture. Eventhough water in horticulture is not a limited factor, in fact a water scarcity period will have to be faced in the near future. Irrigated agriculture is a major consumer of water and accounts for two thirds of the total fresh water assigned to human uses (Fereres and Evans 2006). Water management practice can help ensure the survival and sustainability of agricultural and economic activities related to water (Postel 2000). Maximising water productivity may be more profitable to the farmer than maximizing crop yield (Pereira et al. 2002).
Deficit irrigation is a way to face this problem. Investigations over last two decades showed that deficit irrigation methods can aid in coping with situation where water supply is restricted (FAO 2002). Deficit irrigation could be a management system to make the agricultural irrigation more effective. For plant that cultivated on soil, deficit irrigation could be minimize leaching of nutrient and pesticide into ground water while for plant that cultivated on another growth medium, deficit irrigation could be minimize the requirement of electricity energy for irrigation system include the recycle nutrient system.
Tomato is one of the most widely grown vegetables in the world because of special nutritive value of its fruit (reach source of minerals, vitamins, organic acids, essentia amino acid, antioxidants, etc). Therefore, any factor influencing tomato yield has been attracted considerable interest (Jones and Benton 2008; Jonson et al. 1992; Grange and Andrews 1994). Tomato is one of the world’s most important irrigated vegetable crops (Gallardo et al. 2006) especially in greenhouse. Nowadays consumer desire in taste for tomato is changing. They require higher quality of tomato fruits from several aspects, especially sweetness of tomato fruits. Tomato has high sweetness is known as fruit tomato. The prices of fruit tomato generally higher than common tomato fruit, about ¥10,000/kg.
From several studies, it is known that water stress treatment of tomato crop could used to produce fruit tomato. Water stress is the aplication of deficit irrigation. The application of deficit irrigation on tomato crops not only increase water use effeciency but also produce higher quality of tomato. Water stress treatment on tomato crops not only increase the sweetness of tomato fruit, but also produce tomato fruit with higher total solid and lower water content (Patane and Cosentino 2010) and it really profitable for concentrated juice or tomato paste industry, because they don’t required a lot of time and energy to evaporation, so it improve processing efficiency (Johnstone et al. 2005).
Patane and Consentino (2010), and Patane (2011) conduct a partial water stress treatment on several stage of tomato crop growth (i.e., flowering, fruit set, etc).
Many approaches to detect water stress were reported complicated and expensive, for example Gallardo et al. (2006) who control the water stress by using stem diameter variation measured with linear variable transducer sensors. Savic et al. (2008) used different volume irrigation to the plants. Pulupol et al. (1996) measure leaf water potential to control the water stress treatment condition. Nurruddin et al. (2003) control the water stress treatment by monitoring the moisture soil status and calculating amount of water added to each plant after flowering stage. Patane et al. (2011) and Favati et al. (2009) reported to keep the stress condition depend on evapotranspiration that was calculated from soil water balance. Those methods are not efficient enough to apply in commercial greenhouse system.
Due to the requirement of better system to detect water stress treatment for supporting longer treatment and also produce higher sweetness of tomato fruit as mentioned above, this research is conducted. This research is aimed to obtain a better water stress detection system so that the water stress treatment could be longer, and assess the effect of severe water stress treatment on quality of tomato.
Problem Formulation
Although only eleven percent of total land accounted for arable land, Japan is one of the most advanced agriculture in the world. Greenhouse area in Japan is accounted 49,049 hectare in 2011 (Kacira 2011), although this number is decreasing annually and cover only one percent from total arable land. With that decreasing trend, Japan still became the fourth largest greenhouse production area in the world, next to China, Korea, and Spain. Moreover, Japan is one country that develops tomato production greenhouse intensively, with production reached 690,700 tons in 2010 (Otsuka 2011).
Most of tomato fruit in Japan produced in commercial greenhouse, which mean the aim of the greenhouse, is to get the highest benefit with an effective and efficient manner. To support the longer production time, tomato crops are planting in high technology greenhouse that usually has 10 months of harvesting time. It is longer than traditional greenhouse that usually has 3 months of harvesting time. So that the control of water stress treatment should be able to do in the long run.
The application of water stress treatment in a commercial greenhouse should be controlled by a system that has low maintenance and can easily used by the growers. Due to the requirement of better system to detect water stress treatment, new control system should be build. A water stress detection technique sustainable for use in a commercial greenhouse should satisfy the following requirements:
1. The water stress index must be stable
2. The measurement should be performed by using inexpensive materials 3. The water stress detection must done automatically
4. Water stress should be detected as early as possible
(Nishina et al. 2004; Nishina et al. 2005; Takayama and Nishina 2007). This system was already developed but never been applied directly in a commercial greenhouse. To support the digital monitoring system, growth medium also measured to validate the condition of tomato crops.
Since the sweetness of tomato that produced from moderate water stress treatment was still too close to the level of sweetness that allowed by the industry (4.6°Brix), it is necessary to increase the sweetness to higher level. Most tomato production in Indonesia conducted by open-field cultivation, without the application of hydroponics, so that the quality and quantity of tomato in Indonesia quite low. The average of sugar content in tomato fruit from Indonesia is 3.5oBrix (Lokasari 2011). From Suhardiyanto (2009) the application of greenhouse and hydroponic would increase the quality and quantity of tomato (per square meter). Furthermore the water use efficiency can be improved. Severe water stress with lower water content in growth medium, e.g. 20%-30%, may be able to be used for producing higher sugar content tomato, but it might be decreased the production yield and growth rate of tomato crops. So it is necessary to find a relationship between long-term water stress treatments and the quality and quantity of tomato. Japan has fall, winter, spring, and summer seasons, which means the weather or climate is changing significantly. Environmental condition inside the greenhouse also changes due to the season. Toor et al. (2006) observed the effect of solar radiation and air temperature on tomato crops for 8 months in subtropical region and found that higher solar radiation and air temperature increased the fruit sweetness. Gallardo et al. (2006) observed the effect of solar radiation and air temperature on tomato crop for 7 months in subtropical region and found that higher solar radiation decreased the tomato crop growth rate. Since the production time of tomato reaching almost one year, water stress treatment may vary with season. The effect of seasonal change on the fruit quantity, fruit quality, and tomato plant growth rate under water stress treatment was not studied well. Therefore, research on long-term water stress treatment is necessary for high brix tomato production in intelligent greenhouse.
Objectives of Research
The objectives of the present study are to develop a water stress treatment system for long-term high brix tomato production in hydroponic culture and evaluate the performance of water stress treatment system in long-term severe water condition with seasonal change on the quantity and quality of tomato fruits. Furthermore, the effect of water stress on plants growth was examined. All data that from this research could be used for database of development of water stress treatment system on tomato plants.
Research Output and Benefit
treatment to tomato crops the water use efficiency for most irrigated vegetable crops would be gain, which mean water use efficiency of the world would also significantly gain.
This research was conducted in Japan, where implementation of greenhouse building for growing plants is developing rapidly. The ratio of vegetables and fruits grown in greenhouse is in increasing trend annually. Accordingly, this research could be implemented in another greenhouse. Digital monitoring system is really necessary for the application of water stress treatment in commercial greenhouse, because it is neither too expensive nor too complicated to be handled by the growers. Digital monitoring system is also flexible to apply in many greenhouses in the world, including in a traditional greenhouse in Indonesia. Even though the production time of traditional greenhouse is not as long as high technology greenhouse, the digital monitoring system is still the cheapest and the most simple water stress controlling system compare with another controlling system. So it really fits the condition of a developing country like Indonesia to produce higher quality of tomato.
Tomato fruit from Indonesia usually lost by imported tomato from another country either in quality or price. To improve the quality and quantity of Indonesia’s tomato, application of technology such as the application of greenhouse and hydroponic is required. Indonesia is a blessed country with high annual solar radiation and stable temperature. Related to several studies, high solar radiation is support the production of sugar content in tomato fruit. Therefore Indonesia has the opportunity to become producer of high brix tomato in the world. The application of water stress treatment for tomato crop that controlled by digital monitoring system in greenhouse by hydroponic cultivation would increase the quality and quantity of tomato fruit in Indonesia. So that tomato fruit from Indonesia could be the winner in its own country moreover it could be exported to another countries to increase foreign exchange of Indonesia.
Data Acquisitions
1. Environmental parameters measured were solar radiation outside greenhouse, average relative humidity inside greenhouse, air temperature (oC) inside greenhouse (maximum, minimum, and average), and water content of growth medium (%).
2. Plant growth rate parameters measured were stem diameter (mm) and stem elongation rate (m week-1).
3. Tomato fruit quality parameters measured was fruit sweetness (oBrix) and fruit sourness (%).
2
LITERATURE REVIEW
Water Scarcity
Related to Musiake et al. (2002), it is anticipated that the world’s water resources will be under more pressure in the first half of this century than any time during the recorded history. The estimation of the current level of water stress is important for reliable projections of the severity of the water crisis in the future. However, most of the previous global analyses on water scarcity have been carried out on a country basis or a river basin basis. Considering the importance of global water scarcity, future projections should be valuated by multiple procedures/models/methods in various organizations, since the reliability of the estimates will be supported if similar results are obtained from different scientific approaches, information, and data processing.
For the global estimation of the water supply, observed runoff or simulated runoff is generally used. Shiklomanov (2000a; 2000b) estimated the water availability for 26 regions of the world based on observed river discharge at 2500 stations. Takahashi et al. (2000) estimated the monthly water balance in 0.5o by 0.5o longitude/latitude grid boxes using a bucket model (Manabe 1969) with potential evapotranspiration by the Penman method using current and future climate projections (temperature, wind speed, and precipitation) simulated by GCMs (General Circulation Models) of the Canadian Climate Centre, Max Planck Institute, and Center for Climate System Research (CCSR), University of Tokyo. Vorosmarty et al. (2000) adopted a similar approach, but their water supply estimates were linearly adjusted to observation where discharge information was available.
A growing scarcity of water relative to human demand occurs in many parts of the world, but appropriate water management practices can help ensure the survival and sustainability of agricultural and economic activities related to water (Postel 2000). The sustainable use of water in agriculture has become a priority and the adoption of irrigation strategies which may allow saving irrigation water and maintaining satisfactory yield, thus improving water use efficiency, may contribute to the preservation of this even more restricted resource (Parry et al. 2005; Topcu et al. 2007). Water deficits and insufficient water are the main limiting factors affecting worldwide crop production. Deficit irrigation (DI) can reduce production cost, conserve water and minimize leaching of nutrients and pesticides into ground water. While this has primarily been a concern in field crops, the disposal of nutrient and pesticide-laden waters from large greenhouse complexes has come under scrutiny. Establishing DI as a management tool for tomatoes could be a very effective in situations where water is scare and also reducing effluent contamination. This is especially important since tomato is a popular greenhouse-grown vegetable, grown extensively through the world (Nurruddin et al. 2003).
The goal of DI is to increase crop water use efficiency by reducing the amount of water applied with watering or by reducing the number of irrigation events (Kirda 2002). DI involves the use of appropriate irrigation schedules, which mostly derive from field trials (Oweis and Hachum 2001). In this case, the optimal irrigation schedules are often based on the concept of water productivity (Oweis and Zhang 1998). Water use efficiency can be improved by drip irrigation. It is significantly reducing runoff and crop evapotranspiration losses (Stanghellini et al. 2003; Jones and Benton 2008; Kirnak and Demitras 2006).
Visual Monitoring System
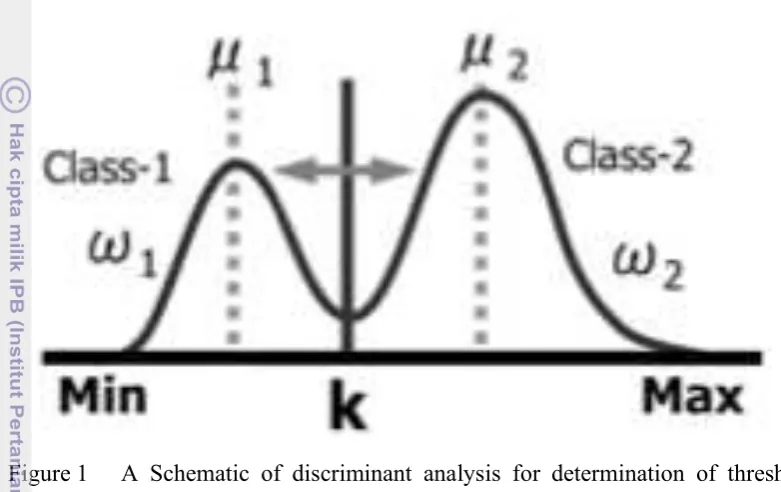
Figure 1 shows a schematic of the discriminant analysis for the determination of threshold value (k). The discriminant analysis automatically determines a threshold value (k), which divides a bimodal histogram into two groups (Classes 1 and 2, shown in Figure 1) with maximizing of the interclass variance [��! � ] of the two groups. The interclass variance is calculated with the
following equation:
��! � =�
!(�!−�!)!+�!(�!−�!)!
in which k is threshold value for dividing the bimodal histogram into two groups (Class 1 and Class 2) �!is an average of Class 1, �!is an average of Class 2, �!is an average of the whole histogram, �
!is the ratio of the frequency of Class 1 to the frequency of the whole histogram, and �
!is the ratio of the frequency of Class
2 to the frequency of the whole histogram (Torii 1996). The color (hue) histogram of a digital color image of a tomato plant with a blue background shows such a bimodal histogram, so we used the discriminant analysis method for automatic determination of the plant area with a digital color image (Nishina et al. 2007).
be determined automatically. Using the threshold value, the plant area represented in green was clearly extracted and the pixel number within the plant area could be used as a relative value of the projected plant area to diagnose the water stress in the tomato plant (Nishina et al. 2005).
Water Stress Treatment
There are several stress treatment usually apply to plant for some reason. Stress treatments for plant usually applied are drought stress, heat stress, cold stress, mineral stress, and Salinity stress. However, drought stress or water stress is the most famous one, because of the issue of water scarcity. The physiology of water stress resistance has been quite extensively in recent years. As will be seen, in some respects the physiology of drought resistance is open to controversy, while in other respects knowledge is just emerging and is far from being put to use in plant breeding. An understanding of the physiology of drought resistance requires some introductory notes on the physiological consequences of plant-water deficit, with emphasis on processes affecting plant production (Blum 1988). In general, reducing water supply by: (1) reducing irrigation frequency, or (2) increasing environmental demand, will reduce growth. An example is providing by Hanan and Jasper’s work on carnations (1967). Different irrigation regimes will influence branching, stem length, quality and yield. Water stress may have far-reaching effect, influencing keeping life and resistance to air pollution.
However, if a crop is planted single stem (chrysanthemums or snapdragons), yield is fixed. It can be desirable to reduce water application or decrease humidity in order to obtain a more compact flower head, or to reduce brittleness. The same Figure 1 A Schematic of discriminant analysis for determination of threshold
may be necessary with foliage, bedding, or potted plants where some judicious stress will improve ability to withstand transplanting shock, or the new environment provided by the consumer. The exact effect of stress will depend upon how large the stress is, how long stress is imposed, how the plant was treated previously (part history), species, and stage of growth. With continuously flowering plants, undue stress at any stage may several restrict stem length and branching. For single cropping, high stress at flower initiation may reduce flower number and size (Hanan et al. 1978).
The general effect on some physiological processes in herbaceous plants was provided by Boyer (1970a, b). Stresses of less than -4 bars were sufficient to reduce elongation, and beyond -8 bars, photosynthesis was decreased. These are not extreme when, as a general rule, a soil suction of -15 bars is often acceptable as the value where most field plants will permanently wilt. Internal water potentials approaching -15 bars have been measured by often, reduce photosynthesis to such an extent that solar energy cannot be efficiently utilized (Boyer 1970b).
If low stress is necessary for maximum growth, it does not follow that zero stress is best. Heydecker et al. (1970) showed that abnormal growth could result where there was no pressure gradient from the leaf to the air. Another problem at low stress conditions is increased damage from foliar disease such as Botrytis or mildew (Winspear et al. 1970). If there is no stress, it is highly unlikely that a plant is actively producing food. If there is sufficient energy (sunlight) to manufacture sugars, there will be sufficient energy to evaporate water and induce stress.
From Hanan et al. (1987), there are several ways to control water demand, or reduce the transpiration rate in greenhouse plants:
I. Reduce vapor pressure gradient between leaf and air 1. Increase relative humidity
a. Add water to air b. Reduce air temperature 2. Reduce leaf temperature
a. Syringe or mist with water b. Reduce light intensity by shading
II. Increase resistance to water vapor flow from leaf to air 1. Reduce stomata aperture by
a. Application of chemical to close stomata
b. Reduce stomata opening by increasing CO2 concentration 2. Increasing length of diffusion path-length from leaf to air by
reducing air velocity
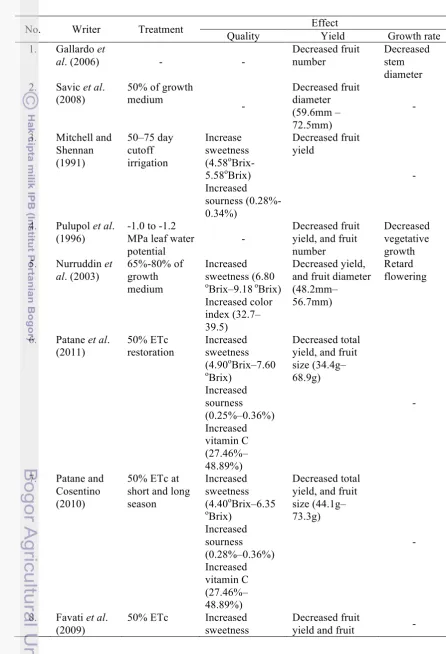
Table 1. Several studies about the effect of water stress treatment on tomato crops.
No. Writer Treatment Effect
Quality Yield Growth rate
1. Gallardo et
al. (2006) - -
Decreased fruit number
Decreased stem diameter 2. Savic et al.
(2008)
50% of growth medium - Decreased fruit diameter (59.6mm – 72.5mm) -
3. Mitchell and Shennan (1991) 50–75 day cutoff irrigation Increase sweetness (4.58o Brix-5.58oBrix) Increased sourness (0.28%-0.34%) Decreased fruit yield -
4. Pulupol et al. (1996)
-1.0 to -1.2 MPa leaf water potential
-
Decreased fruit yield, and fruit number
Decreased vegetative growth 5. Nurruddin et
al. (2003)
65%-80% of growth medium Increased sweetness (6.80 o
Brix–9.18 oBrix) Increased color index (32.7– 39.5)
Decreased yield, and fruit diameter (48.2mm–
56.7mm)
Retard flowering
6. Patane et al. (2011)
50% ETc restoration
Increased sweetness (4.90oBrix–7.60 o Brix) Increased sourness (0.25%–0.36%) Increased vitamin C (27.46%– 48.89%) Decreased total yield, and fruit size (34.4g– 68.9g)
-
7. Patane and Cosentino (2010)
50% ETc at short and long season
Increased sweetness (4.40oBrix–6.35 o Brix) Increased sourness (0.28%–0.36%) Increased vitamin C (27.46%– 48.89%) Decreased total yield, and fruit size (44.1g– 73.3g)
-
8. Favati et al. (2009)
50% ETc Increased
sweetness
Decreased fruit
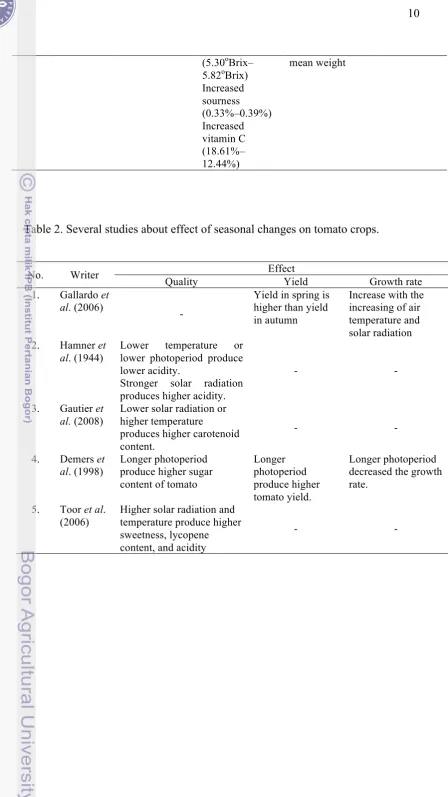
Table 2. Several studies about effect of seasonal changes on tomato crops.
No. Writer Effect
Quality Yield Growth rate
1. Gallardo et al. (2006)
-
Yield in spring is higher than yield in autumn
Increase with the increasing of air temperature and solar radiation 2. Hamner et
al. (1944)
Lower temperature or
lower photoperiod produce lower acidity.
Stronger solar radiation produces higher acidity.
- -
3. Gautier et al. (2008)
Lower solar radiation or higher temperature
produces higher carotenoid content.
- -
4. Demers et al. (1998)
Longer photoperiod produce higher sugar content of tomato
Longer photoperiod produce higher tomato yield.
Longer photoperiod decreased the growth rate.
5. Toor et al. (2006)
Higher solar radiation and temperature produce higher sweetness, lycopene content, and acidity
- -
3
MATERIALS AND METHODS
Time and Places of the Research
This research was conduted for seven months (August 2011 to March 2012). Tomato seeds were sown on August and transplanting to rockwool cube on September. The treatment of water stress is started on November and harvesting is started from January untill March. Comprehensive timeline is shows in Appendix 1.
The research was conducted in a high technology greenhouse (1300 m2) in Faculty of Agriculture, Ehime University, Japan (Figure 2). The greenhouse has full controlling system, like cooling and heating system to support the seasonal change, supplemental lighting, CO2 distribution system, etc. The measurements of some fruit characteristic was conducted in the Research Center of Departement of Bio-mechanical System, Faculty of Agriculture, Ehime University. This research introduces visual monitoring system to control severe water stress condition by using digital still camera.
Materials
The materials used for this research were 288 tomato crops (Solanum lycoperscium L) with variety of Momotaro sakura, 288 rockwool cubes (10 cm [W] x 10 cm [H] x 10 cm [D]), 72 rockwool slabs (30 cm [W] x 25 cm [W] x 91 cm [L]) (Grotop Expert, Grodan. Inc), and nutrient solution (A-type recipe of Otsuka House Solution, Otsuka Chemical co., Ltd).
Equipment
The equipment used for this research was divided in to some parts growth system, visual monitoring system, and measurements of plant growth rate and fruit characteristic. Environmental monitoring system (MC–5013, NEPON) that automatically measures solar radiation, air temperature, and relative humidity inside and outside the greenhouse, a drip irrigation system and nutrient tank were used for the growth system. Water content meter (Sensor 300 Baud, Grodan. Inc), digital camera (G700SE, Ricoh company, Ltd. Japan), Wi-Fi system, personal computer and commercial available software (X6, CorelDRAW, Corel Corporation, Canada) were used for visual monitoring system. Measuring tape, board marker, and Digital Caliper Ruler (BLD-100, Niigata Seiki co., Ltd) were used for plant growth rate measurement, furthermore grading machine (SSW-1APQ-6R, ISEKI & Co., Ltd), weight scale, refractometer, and fruits selector machine (K-BA100R, Kubota. Co) were used for fruit characteristic measurement and calibration.
Plant Materials and Growth Conditions
Tomato crops were grown hydroponically in an intelligent greenhouse. The greenhouse that used in this research is a subtropical greenhouse with the type of venlo house, which covered by glass but in the special condition like a very high temperature in summer, wall of the greenhouse covered by net. The greenhouse is passively ventilated. Climatic parameters were continuously monitored within the greenhouse. Solar radiation, air temperature and relative humidity were measured inside and outside the greenhouse with MC–5013, NEPON. These data recorded once a day.
There are two treatments that conducted in this research, water stress treatment and control. Water stress treatment was started on 17 November 2011 after the plants reach 1 month old. 36 rockwool slabs were used for each treatment. The irrigation for water stress treatment controlled by visual monitoring system based on projected leaf area and water content of rockwool slabs, on the other hand the irrigation of the control treatment is given for 3 minutes every 15 minutes. Water content for both treatments is measured once a day. Water content is maintained from 20% to 30% for water stress treatment and 60% to 70% for control.
Hydroponic
The seed were sown in spongy material on 29 August 2011 and transplanted on 12 September 2011 to rockwool cubes on the rockwool slabs. Four plants transplanted to each rockwool slabs (Figure 3). The plants watered daily with a nutrient solution, which distributed by drip irrigation system. Drip irrigation type placed on the surface of the rockwool with 1.5 m spacing between drip lines and 20 cm spacing between emitters within drip lines. The irrigation water had an electrical conductivity around 0.27 dS m-1 to 3.8 dS m-1. The dose for tomato’s crop nutrient is shows in Table 3. Nutrients for control treatment applied through the irrigation system, in accordance with local practice. There are four lines of tomato crops that used in this research. Two lines of water stress treatment and two lines of control treatment.
Table 3. The dose of tomato’s crop nutrient
No. Nutrient’s name Doses
1. Nitrate nitrogen 151 ppm
2. Ammonium nitrogen 14 ppm
3. Phosphor 39 ppm
4. Sulphur 48 ppm
5. Potassium 254 ppm
6. Calcium 110 ppm
7. Magnesium 24 ppm
8. Iron 0.84 ppm
9. Manganese 0.55 ppm
10. Zinc 0.10 ppm
11. Boton 0.22 ppm
12. Copper 0.05 ppm
13. Molybdenum 0.05 ppm
14. EC approximation 1.6 ppm
Visual Monitoring System
Figure 4 shows schematic diagram of the system that controlled the water stress treatment based on projected leaf area, named visual monitoring system. A digital camera captured a picture from 2m above the canopy of tomato plant’s growing tip every 15 minutes. According to Takayama and Nishina (2007), the best angle to detect water stress in tomato plant at an early stage was 90°. The captured image sent to a laptop computer in laboratory with Wi-Fi. Furthermore the captured images were processes by developed image processing software and CorelDRAW software to calculate the pixel number of leaf area.
Beside the projected leaf area, water content of the growth medium also becomes a parameter of the water stress condition. Water content of the rockwool slabs was measured once a day at noon. The water content of rockwool slabs maintained from 20% to 30% for the water stress treatment and 60% to 70% for the control. When the ratio of projected leaf area decrease to less than 95% of the maximum projected leaf area which was measured after the last irrigation and the water content of the slabs was fewer than 20% the nutrient solution was supplied to the plant until recovering to 20%. Grodan rockwool can hold 15 liters of water, the grower has tremendous flexibility with regard to watering and control over the air content of the root zone. However, the plant will not show sign of water stress until it is too late. Due to that characteristic of Grodan rockwool, 95% of pixel Figure 4 Schematic diagram of the water stress treatment system that controlled
number of projected leaf area is enough to show the condition of water stress treatment on tomato plant.
Plant Growth Rate Measurement
To find out the effect of long-term water stress treatment on plant growth rate, two parameters were measured they are stem diameter and stem elongation rate. The measurement started when the water stress treatment started. Stem diameter and stem elongation rate were continuously measured in 16 plants for water stress treatment and 6 plants for the control. Stem diameter and stem elongation were measured once a week. Stem diameter was measured at 15 cm from growing tip while stem elongation rate was measured at the distance between new growing tips and last week growing tip
Fruit Characteristic Measurement
To discover the effect of long-term water stress treatment on quantity and quality of tomato some parameters were measured. They are harvested fruit number, yield, and fruit diameter for the quantity of tomato and fruit sweetness and sourness for the quality of tomato. The sweetness was measured here is the total soluble solid, which is a refractometric index that indicates the proportion (%) of dissolved solid in a solution. It is sum of sugars (sucrose and hexoses; 65%), acid (citrate and malate; 13%) and other minor components (phenols, amino acids, soluble pectin, ascorbic acid, and minerals) in the tomato fruit pulp (Balibrea et al. 2006).
Harvested fruit number, fruit diameter, fruit sweetness and sourness were measured by using ISEKI grading machine (Figure 5 (a)). Unfortunately, ISEKI grading machine has no setting for variety of Momotaro sakura. So, it is necessary to calibrate the parameters of fruit quality. The calibration of fruit sweetness conducted by destructive method with Refractrometer (Figure 5 (b)). The equation calibration was obtained y=0.82x, with regression of 0.61. The calibration for sourness conducted by Fruit Selector machine (Figure 5 (c)). Five points on every tomato fruit were measured. The equation for calibration was obtain y=1.12x with regression of 0.68.
Statistical Analysis
Research Flow Diagram
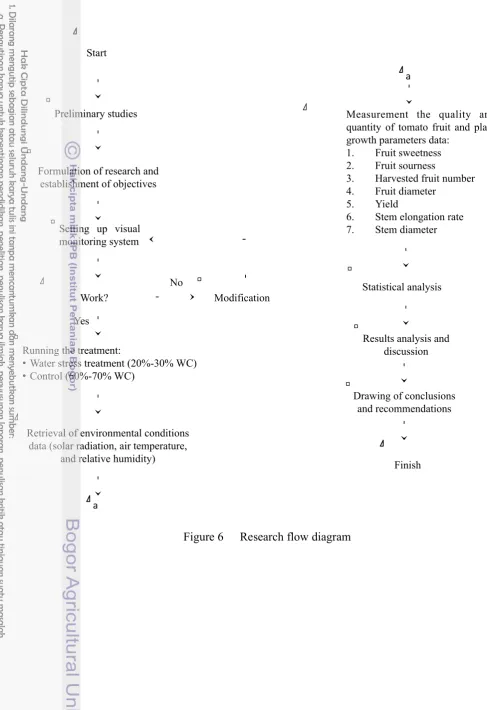
Research flow diagram shown on Figure 6 describes steps and stages of processes done in this research.
1. Preliminary studies
Observation to the research place and object was done at this stage of research. This was done to make a clear description and understanding of the research place and object, so that the objectives and methods established will fit. Observation of the greenhouse condition and plant condition were some of things done in this step. Literature study was also done to support research formulation and establishment of objectives and method.
2. Formulation of research and establishment of objectives
Problems found from the initial stage was explored and formulated, along with establishment of research objectives and method. Relationship between water stress treatment on tomato fruit quality, quantity, and plant growth rate to be observed was analyzed.
3. Setting up visual monitoring system
Visual monitoring system was applied in the intelligent greenhouse, to detect the water stress condition of tomato plant. If the system does not work well, it
a.
b.
[image:30.595.115.515.96.528.2]c.
is necessary to do some modification so the detection of water stress treatment can be done by visual monitoring system as early as possible. 4. Running the water stress treatment
When the system works well the water stress treatment can be started, beside calculating the pixel number every 15 minutes, water content of growth medium also should be measured once a day at noon to make sure the system run well and avoid dead plants.
5. Retrieval of environmental conditions data
Environmental conditions data in the greenhouse was obtained, as one main data needed in this research. Environmental conditions data retrieved were solar radiation, air temperature, and humidity.
6. Measurement the quality and quantity of tomato fruit
The quality and quantity of tomato fruit and plant growth rate parameters data, as one main data needed in this research was obtained. The quality of tomato fruit parameters data measured was fruit sweetness and sourness, while the quantity of tomato fruit parameters data measured were harvested fruit number, fruit diameter, and yield. The plant growth rate parameters data measured were stem elongation rate and stem diameter.
7. Statistical analysis
Statistical analysis done in this stage of research was correlation and significance test. Correlation test performed on destructive measurement and non-destructive measurement of sweetness and sourness of tomato fruit, to calibrate the ISEKI grading machine. Significance test was done on some parameters in particular conditions, to know whether there is significance difference between them. Significance test performed was t-test.
8. Results analysis and discussion
Results from measurement and calculation on this research were analyzed with comprehensive support from related literatures. Key points of this research were disclosed to give brief description of outputs and outcomes. 9. Drawing of conclusions and recommendations
Figure 6 Research flow diagram Yes
No
Results analysis and discussion
Retrieval of environmental conditions data (solar radiation, air temperature,
and relative humidity) Setting up visual monitoring system
Preliminary studies
Statistical analysis
Drawing of conclusions and recommendations
Running the treatment:
• Water stress treatment (20%-30% WC)
• Control (60%-70% WC)
Modification Work?
Start
Finish Formulation of research and
establishment of objectives
Measurement the quality and quantity of tomato fruit and plant growth parameters data:
1. Fruit sweetness
2. Fruit sourness
3. Harvested fruit number
4. Fruit diameter
5. Yield
6. Stem elongation rate
7. Stem diameter
a'
4
RESULT AND DISCUSSION
Environmental Condition
The production period of tomato plants occurs at the end of winter season until the beginning of summer season, so that the environmental condition become warmer day by day. There were large different in climatic conditions long with seasonal change. Even though the environment condition in greenhouse is under control, it still affected by the environmental condition outside greenhouse. Japan is a subtropical country, the angle of solar radiation substantially changes every season and it will affect air temperature. The seasonal change from winter to summer makes the angle of solar radiation increasingly greater. This condition made the lumen per square meter of solar radiation become higher, so the energy that absorbed by the earth also becomes higher. Air temperature was affected by solar radiation. It was also become higher when the research was conducted.
Environmental condition has some influences to the condition of the plant, for example transpiration and evaporation rate. Plant has higher transpiration and evaporation rate in the condition of higher solar radiation, lower relative humidity, and higher air temperature. In contrast, it has lower transpiration and evaporation rate in the condition of lower solar radiation, higher relative humidity, and lower air temperature.
Figures 7 show the environmental condition of production period of tomato plant both under water stress treatment and control treatment. Figure 7 A, B, and C show outside solar radiation, relative humidity, and air temperature become higher day by day because of the seasonal change from winter to summer. Average temperature outside greenhouse was unstable compare with average temperature inside greenhouse. Temperature inside greenhouse is quite stable because as describe in Bot (1993), that environmental condition in greenhouse is stagnant. Temperature in greenhouse will always higher than outside, Bot (1993) called it mechanism of radiation. The glass that covered greenhouse act as mouse trap, so the short wave solar radiation is trapped in greenhouse and make temperature in greenhouse higher than outside.
Figures 7 show the water content of growth medium with water stress treatment with some irregular situation. On several days, water content of growth medium is lower than 20%, while on other days it higher than 30%. It might be occurred because of the effect of environmental condition.
Even though sometimes water content of growth medium was lower than 20%, the projected leaf area of tomato plant never been less than 93%. The measurement of water content of growth medium was conducted once a day at noon, while the monitoring of projected leaf area was conducted every 15 minutes. So, the irregular conditions might occur because the measurement of growth medium conducted in the full withering condition, before the irrigation turn on.
[image:34.595.26.523.52.518.2]In addition, projected leaf area also becomes a parameter of water stress treatment system beside water content of growth medium. The condition of projected leaf area also influenced by environmental condition, because as mention above, environmental conditions influence the transpiration of the plant. The transpiration of the plant occurs on the leaf. Higher transpiration rate without enough supply of nutrient solution caused smaller projected leaf area. It makes a sign of water stress on tomato plant.
Figure 7 Time course of: outside solar radiation (A), average relative humidity inside greenhouse (B), maximum, minimum, average air temperature inside greenhouse (C), and water content of rockwool slab in water stress treatment (D).
0' 5' 10' 15' 20' 25' 30' 35' 40' 45' 50'
1/1/2012' 2/1/2012' 3/1/2012' Maximum' Minimum' Average'
C
Date
Air temperature (
oC) 0' 5' 10' 15' 20' 25'
Outside solar radiation (MJ m
-2)
a
b
A
35' 45' 55' 65' 75' 85' 95'B
Relative humidity (%)
b
a
W
ater content (%)
Date 0' 10' 20' 30' 40' 50' 60'
1/1/2012' 2/1/2012' 3/1/2012'
##
a
Figure 8 shows some pictures of tomato plant’s canopy that took in the sunny day on 25 March 2012 as an example of the change of projected leaf area along with the condition of water stress treatment of tomato plant. Those pictures already processed by developed image processing software and CorelDraw software to calculate the pixel number of leaf area, so that the pictures show the leaf area only while the other area show as white color. They show the changes in the projected plant area caused by the changes of water content of the growth medium.
The picture captured at 09:52 AM shows the maximum projected area (100%) after the last irrigation, furthermore in the next one hour at 10:52 AM the projected leaf area start to withered because of the decreasing of water content of growth medium. At 11:37 AM, the projected leaf area reached 93%, which mean it is less than 95%, so the irrigation system automatically turn on and nutrient solution irrigated the tomato plants until the growth medium reach the water content of 20%-30%. The result indicates projected leaf area doesn’t directly recover after the irrigation. It took around 1.5 hours after irrigation was started to full recover condition (01:08 PM).
09:52:38 am 10:52:48 am
Full unfurled Withered
11:37:54 am 01:08:14 pm
Irrigated Full recover
100% 95.23%
[image:35.595.92.515.216.796.2] [image:35.595.108.511.221.508.2]93.04% 100%
Sweetness
Tomato is one of the most popular vegetables worldwide. It has projected however, that consumption, and therefore profitability for producers, would track any increase in consumers satisfaction with the quality of tomato product. Two parameters that commonly used to establish consumers satisfaction are fruit sweetness and sourness.
Fruit sugar content is a complex, mutagenic trait that is highly affected by the environment (Hartl 2011). Tomato fruit sweetness is the outcome of fruit physiological metabolic and genetic processes that are under developmental control (Mounet et al. 2009). Sugar production begins with leaf photosynthesis, the product of which is trans located to developing fruits. The ability to attract photo assimilate to the fruit is defined as sink strength and it influences sugar distribution to fruit throughout the plant (Beckles 2012).
The result shows that fruits sweetness in water stress treatment was always higher than that in control (Figure 9 A). Similar effects of water stress on tomato fruit sweetness were reported that water stress treatment produced high brix tomatoes (Marouelli and Silvia, 2007; Favati et al. 2009; Patane and Cosentino, 2010; Patane et al. 2011). Favati et al. (2009) found that total amount of starch was converted to sugar in water stress treatment and increase total soluble solid (Marouelli et al. 2004; Patane and Cosentino, 2010). The increasing of soluble solid is because the increasing of phloem sat and the decreasing of its flux. (Ho et al. 1987). Mitchell and Shennan (1991) found that the increasing of soluble solid concentration related primarily to decreases in fruit water content and to slight increases in soluble sugar accumulation.
The difference in sweetness between water stress and control was from 0.2% to 2.5% in this study. Patane and Consentino (2010) reported that the difference in sweetness between water stress and control was from 0.55% to 1.4% with short-term experiment. Data of the effect of water stress treatment on fruit sweetness is shows in Appendix 2. In their report, the water content of growth media in water stress treatment was maintaining 50%. The severe water stress, 20% - 30% in this study, would produce higher sweetness tomato compared with moderate water stress.
The result of t-test between water stress treatment and control for fruit sweetness shows that significant different occur almost in every harvesting period, this result suggest that water stress treatment might inhibit sweetness of tomato fruit.
The pre-harvest environment, including solar radiation, temperature, day-length, can all influence fruit sugar level (Dorais et al. 2008). Solar radiation and temperature have a large influence on fruit sugar accumulation. Under normal growth conditions, however, it is difficult to attribute the effect of each individually. Higher temperatures (ranging from 26 to 30°C) leads to increase sweetness when change carbohydrate biosynthetic enzyme activity and increased transpiration (Gautier et al. 2008). Winsor (1976) explains that in higher solar radiation condition, photosynthesis rate will also getting higher. So that starch produced from this process will increase and make the sweetness increased. Depends on Demers et al. (1998), longer photoperiod will increase starch, glucose, and fructose. As known that in subtropical country, daytime of winter is shorter than daytime of spring.
[image:37.595.108.482.91.734.2]
Figure 9 Variation of fruit sweetness during research period due to: water stress treatment (A), and seasonal change (B).
Asterisk shows significant difference by t-test between control and water stress treatment (P<0.05)
January' Febuary' March' 4'
5' 6' 7' 8' 9'
6' 10' 20' 27' 3' 10' 17' 24' 27' 8' 16' 22' 30' Control' Water'stress'
4' 5' 6' 7' 8' 9'
January' Febuary' March'
*'
*'
*'
*'
*'
*'
*'
*'
*'
*'
Sweetness (
oBrix
)
Month'
Sweetness (
oBrix
)
A
B
Sourness
Fruit sourness influence the perception of sweetness, there is a useful indicator of tomato taste is the sweetness (TSS) to sourness (TA) ratio (Suarez et al. (2008)). There are two primary acids in tomato, citric and malic: citric acid is half as acidic as malic, and higher citric levels give glucose a higher apparent sweetness index than fructose. A minimum sweetness and sourness of 5% and a minimum sourness of 0.4% respectively (Sweetness:sourness of 12.5), is considered desirable to produce a good-tasting table tomato (Backles 2012).
Fruit sourness in water stress treatment was also higher than that in control (Figure 10 A). These results are consisted with the report in short time experiments described by Mitchell et al. (1991), Tuzel et al. (1994), Morouelli and Silva (2007), Favati et al. (2009), Patane and Cosentino (2010), and Patane et al. (2011). The difference in sourness between water stress treatment and control was from 0.07% to 0.1%. Data of the effect of water stress treatment on fruit sourness is shows in Appendix 3. Patane and Consentino (2010) reported that the difference in sourness between two treatments in short-term experiment was from 0.05% to 0.06% with water stress treatment that water content was maintained at 50%. These results suggest that severe water stress with 20% - 30% water content would increase the sourness compared with the moderate water stress.
Figure 10 Variation of fruit sourness during research period due to: water stress treatment (A), and seasonal change (B).
Asterisk shows significant difference by t-test between control and water stress treatment (P<0.05)
January' Febuary' March'
0.30' 0.40' 0.50' 0.60' 0.70' 0.80' 0.90' 1.00'
January' Febuary' March'
0.30' 0.40' 0.50' 0.60' 0.70' 0.80' 0.90' 1.00'
6' 10' 20' 27' 3' 10' 17' 24' 27' 8' 16' 22' 30'
[image:38.595.104.486.109.754.2] [image:38.595.114.430.370.728.2]Tomato fruit of water stress treatment has higher satisfaction of consumers than that of control. The range for sweetness was 5.224% - 7.568% for water stress treatment and 4.084% - 4.818% for control. While the range for sourness was 0.781% - 0.598% for water stress treatment and 0.612% - 0.490% for control (Appendix 14). Furthermore ratio sweetness: sourness was 8.360 – 10.063 for water stress treatment and 7.172 – 8.981 for control, respectively. As mentioned above, for high satisfaction of consumers, minimum sweetness is 5% while sourness is 0.4%.
The data show that tomato fruit, which produce from water stress treatment could full fill this requirement. This result showed that satisfaction of tomato fruit that produced from water stress treatment is higher than that of control for the consumers.
Fruit sourness with both treatments was stable, 0.60% in January and 0.64% in March (Figure 10 B). Data of the effect of seasonal change on fruit sourness is shows in Appendix 9. Davies and Hobson (1981) reported that fruit sourness does not increased along with the increasing of solar radiation. These results suggest that seasonal change will have little effect on sourness under water stress condition.
Harvested Fruit Number
Figure 11 Variation of harvested fruit number during research period due to: water stress treatment (A), and seasonal change (B).
Asterisk shows significant difference by t-test between control and water stress treatment (P<0.05)
January' Febuary' March'
0' 200' 400' 600' 800' 1000'
January' Febuary' March'
0' 100' 200' 300' 400' 500'
6' 10' 20' 27' 3' 10' 17' 24' 27' 8' 16' 22' 30'
[image:39.595.112.425.310.724.2]The harvesting was started from January to March in 2012. The differences of harvested fruit number between control and water stress treatment were small in each harvesting time (Figure 11 A). But total fruit number of 3 months was 1087 for water stress and 1953 for control. This suggests that water stress treatment for long-term inhibits fruit production.
Considering the water stress treatment with seasonal change, during January to February solar radiation and air temperature in greenhouse were stable, 1.18 MJ and 16.87°C in January and 1.13 MJ and 16.93°C in February. Little effect of solar radiation and air temperature in greenhouse on harvested fruit number was observed both of water stress and control from January to February. Figures 11 B show the effect of seasonal change on harvested fruit number during research period.