Effects of realimentation on small intestinal morphology and disaccharidase
activity in malnutrition Sprague-Dawley rats
Rustadi Sosrosumihardjo,* Agus Firmansyah, Asri Rasad, Daldiyono Harjodisastro,# Endi Ridwan,§ Septilia Inawati Wanandi, Dwirini Retno
Abstrak
Bayi dengan berat badan lahir rendah dan retardasi perkembangan intrauterin masih merupakan masalah, khususnya di Indonesia, karena menunjukkan angka kejadian yang tinggi dan perlu diturunkan. Malnutrisi pada anak kurang dari 1 tahun terbanyak pada bayi dengan berat badan lahir rendah. Pada penelitian menggunakan hewan coba, didapatkan mukosa usus halus hipotrofi dan normoplasi pada tikus malnutrisi. Keadaan itu memperlihatkan bahwa mukosa usus halus dapat mempertahankan jumlah selnya dalam menghadapi pembatasan nutrien, dan memberi petunjuk akan dapat berkembang bila mendapatkan masukan nutrien yang cukup. Apakah realimentasi dapat memulihkan mukosa yang hipotrofi normoplasi menjadi normotrofi normoplasi? Penelitian ini bertujuan untuk menjawab pertanyaan itu. Penelitian eksperimental dengan desain post test-control group dilakukan dengan menggunakan 40 ekor anak tikus jantan jenis Sprague-Dawley, yang diberikan makanan baku yang lazim digunakan untuk penelitian. Penelitian dibagi dalam tahap induksi malnutrisi pranatal dilanjutkan dengan tahap realimentasi. Didapatkan berat badan, tebal mukosa, tinggi vilus, kedalaman kripta, nisbah vilus/kripta, jumlah vilus, kandungan protein, dan nisbah protein/DNA mukosa usus halus tikus malnutrisi pranatal yang direalimentasi lebih tinggi dari tikus malnutrisi pranatal yang tidak direalimentasi, tetapi lebih rendah dari tikus kontrol. Aktivitas disakaridase mukosa usus halus tikus malnutrisi pranatal yang direalimentasi lebih tinggi dari tikus malnutrisi pranatal yang tidak direalimentasi, tetapi lebih rendah dari tikus kontrol. Disimpulkan bahwa malnutrisi pranatal tidak mengurangi populasi enterosit usus halus tikus. Realimentasi pada tikus malnutrisi pranatal dapat memperbaiki hipotrofi mukosa usus halus dan meningkatkan aktivitas disakaridase namun tidak mencapai nilai normal. Realimentasi pada tikus malnutrisi pranatal dapat memperbaiki maturitas mukosa usus halus tetapi tidak mencapai nilai normal. Informasi ini dapat bermanfaat dalam menetapkan kebijakan pengelolaan malnutrisi maternal. (Med J Indones 2006; 15:208-16)
Abstract
Low birth-weight infant and intrauterine growth retardation are still a health problem, especially in Indonesia due to high prevalence and need to be reduced. Malnutrition in infants are most common occur in low birth-weight infants. Malnutrition in rats resulted in hypotrophic and normoplastic mucosa of the small intestine. The finding was not only showed that small intestine was able to maintain its cell number in condition with restriction nutrient, however also suggested the posibility of epithelial regeneration if given adequate nutrient intake. Did realimentation recover the hypotrophic normoplastic mucosa to normotrophic normoplastic? The study aim to answer that question. Experimental animal study with post test-control group design was performed using 40 male litter of Sprague-Dawley rats, was fed standard chow. The study was divided into phases prenatally-induced malnutrition and continued with phase realimentation. The result of this study is the body weight, mucosal thickness, villus height, cryptus depth, ratio of villus/crypt, number of villi, protein content, and disaccharidases of rats realimentation group was higher than non-realimentation group, but lower than control group. Prenatally-induced malnutrition did not reduced the population of small intestinal enterocytes. Realimentation in rats in prenatally-Prenatally-induced malnutrition was able to improve the hypotrophy of small intestinal mucosa and to increase the disaccharidases activities but did not reach the normal values. Realimentation in rats in prenatally-induced malnutrition was able to improve the maturity of small intestine mucosa but did not reach the normal values. The information will be helpfull to decide the policy of maternal malnutrition. (Med J Indones 2006; 15:208-16)
Keywords: small intestinal morphology, disaccharidase activity, Sprague-Dawley rats, prenatally-induced malnutrition, realimentation.
Low birth weight-infant and intrauterine growth retardation are still a health problem, particularly in Indonesia. From WHO1 and Susenas data2 about low birth-weight infant and intrauterine growth retardation in Indonesia shows high prevalence and need to be reduced. Suharyono3 from his study, reported that malnutrition in child below 1 year of age most occurred in low birth-weight infant. Besides that, Suharyono3 also reported the most common causes of *
Department of Clinical Pathology, Faculty of Medicine University of Indonesia, Jakarta, Indonesia
Department of Child Health, Faculty of Medicine University of
Indonesia, Jakarta, Indonesia
Department of Biochemistry and Biomolecular, Faculty of Medicine University of Indonesia, Jakarta, Indonesia # Department of Internal Medicine, Faculty of Medicine
University of Indonesia, Jakarta, Indonesia §
failure to thrive in infants is gastrointestinal tract problems, especially maldigestion, malabsorbtion, and chronic diarrhea.
Study about morphology and small intestinal enzyme activity was not many developed. Firmansyah4 study used experimental animal which prenatally-induced malnutrition, found small intestinal morphology alterations, i.e. hypotrophy and normoplastic mucosa, also disaccharidases activity alterations such as lactase, maltase, and sucrase. The hypotrophy normoplastic reflected that small intestinal was able to maintain its number of cells in the face of nutrient restriction. This condition indicated that small intestinal can still become normotrophy and normoplasy if given adequate nutrient intake.
Based on this background, there is willingness to study realimination in malnutrition using experimental animal to study realimentation effects to histopathology and biochemistry of prenatally-induced malnutrition small intestinal mucosa rats after postweaning realimentation.
METHODS
This study was experimental, post test-control group design. It was performed in Centre for Research and
Experimental animal was fed standard laboratory diet in Centre for Research and Development Food and Nutrition, Bogor. The composition was appropriate to standard food produced by Purina (Purina Rat Chow, St Louis).
At prenatally-induced malnutrition induced phase was obtained rats that had small intestinal morphology and biochemistry alterations caused by malnutrition. Then continued with realimentation phase and be valued its effect to morphology and biochemistry recovery prenatally-induced malnutrition small intestinal rats.
Prenatally-induced malnutrition was done since gestation. Pregnant female rats were divided into healthy and malnutrition female rats. Healthy pregnant female rats
were given water and fed standard laboratory diet ad libitum (100%), otherwise malnutrition female rats were obtained from pregnant female rats which were given water ad libitum and were fed 50% total from healthy female rats (50% standard laboratory diet). Healthy female rats will delivery healthy litter and malnutrition female rats will delivery prenatal malnutrition litter. This continued for female rats at weaning period (3 weeks), and litter since born until 3 weeks postweaning4.
At realimentation phase, one malnutrition rats group was changed the standard laboratory diet from 50% to ad libitum (100%), one malnutrition rats group was still fed 50% standard laboratory diet, and one healthy rats group was fed ad libitum as control. Each rats level, small intestinal morphology and biochemistry were measured.
Conditions that would be valued in this study were body growth, small intestinal growth, small intestinal maturity mucosa based on histopathology and biochemistry, and small intestinal function based on activity of lactase, maltase, and sucrase. Parameters that measured were physical parameters (body weight, body length, chest circumstances), small intestinal parameters (small intestinal weight, small intestinal length, small intestinal diameter), mucosa weight, small intestinal mucosa histopathology (mucosa thickness, villus height, cryptus depth, number of villus), and small intestinal biochemistry (protein content, DNA content, ratio protein content/DNA content, and disaccharidases activity – lactase, maltase, sucrase).
RESULTS
Body Weight
Before realimentation, body weight of prenatally-induced malnutrition rats group were 67,1 ± 2,9 g (means ± standard deviation). This was significantly different (t test, p<0,05) compared to body weight of control rats group 97,4 ± 2,9 g. From this finding, body weight of 6 weeks old prenatally-induced malnutrition rats group reached 69% body weight of control rats.
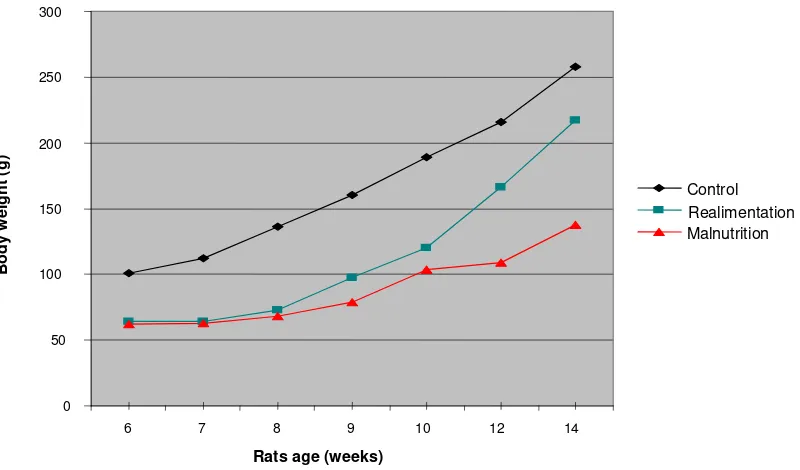
At realimentation phase, the increase of body weight rats were used as parameters for recovery of realimentation prenatally-induced malnutrition growth. Body weight of realimentation malnutrition rats from 6th week to 14th week, were lower than control, but higher than non realimentation rats. At the end of realimentation phase, body weight of realimentation malnutrition rats did not reach body weight of control rats (Figure 1).
At the end of realimentation phase, it was found the increase of realimentation prenatally-induced malnutrition body weight rats group from 10 weeks old to 12 weeks old, 45,6 5,0 g (means standard deviation). This
value was higher (t test significant, p<0,05) than the increase of control rats group body weight, 29,6 13,8 g. So was from 12 weeks old to 14 weeks old, the increase of realimentation prenatally-induced malnutrition body weight rats, 59,1 ± 10,6 g, were higher than the increase of control rats body weight, 41,9 ± 11,3 g. It means at last 4 weeks of realimentation phase, the increase of prenatally-induced malnutrition body weight rats were higher significantly than control (Figure 2).
Serum Albumin Level
Before realimentation, prenatally-induced malnutrition albumin level rats 4,07 ± 0,33 mg/dl (means ± standard deviation). This value was lower (t test significantly different, p<0,05) than control rats body weight group 4,47 ± 0,21 mg/dl.
After realimentation, realimentation prenatally-induced malnutrition albumin level rats 4,25 ± 0,23 mg/dl (means ± standard deviation). This was higher (t test significantly different, p<0,05) than non realimentation malnutrition body weight rats, 3,65 ± 0,25 mg/dl, and lower (t test significantly different, p<0,05) than control body weight rats group, 4,62 ± 0,34 mg/dl.
Figure 1. The Increase of Realimentation Prenatally-induced Malnutrition Body Weight Rats from 6 Weeks Old to 14 Weeks Old. Body weight were presented as means standard deviation
0 50 100 150 200 250 300
6 7 8 9 10 12 14
B
ody
we
ight (g)
Control
Malnutrition
Rats age (weeks)
Figure 2. The Increase of Prenatally-induced Malnutrition Body Weight Rats at Last 4 Weeks Realimentation Phase (10-14 Weeks Old). Body weight were presented as means ± standard deviation
Physical Parameters
Table 1 showed prenatally-induced malnutrition physical parameter rats before and after realimentation.
Physical parameters i.e. body weight, body length, ratio body weight/body length, chest circumstances of prenatally-induced malnutrition rats before realimentation were lower significantly than control.
After realimentation, all physical parameters of realimentation prenatally-induced malnutrition rats were significantly higher than non realimentation
prenatally-induced malnutrition rats, but lower significantly than control.
Small Intestinal Parameters
Small intestinal parameters of prenatally-induced malnutrition rats before and after realimentation (Table 2).
Small intestinal parameters i.e weight, length, diameter, and mucosa weight of prenatally-induced malnutrition small intestinal before realimentation were lower significantly than control.
Table 1. Physical Parameters* Prenatally-induced Malnutrition Rats before (6 Weeks Old) and after Realimentation (14 Weeks Old)
Parameters
Before realimentasi After realimentasi Control
(n=8)
Malnutrition (n=8)
Control (n=8)
Malnutrition (n=7)
Realimentation (n=8)
Body weight (g) 97.4 + 2.9 67.1 + 2.9a 257.6+ 1.1 137.4 + 7.6 217.4+ 4.0a,c Body length (cm) 15.2 + 0.3 13.3 + 0.2a 21.7 + 1.4 16.9 + 0.3 20.4 + 1.5a,c Body/length (g/cm) 6.4 + 0.2 5.1 + 0.2a 11.8 + 0.9 8.1 + 0.4 10.7 + 0.7a,c Chest circumstances (cm) 24.1 + 1.6 18.2 + 0.4a 31.3 + 0.6 20.1 + 1.4 22.3 + 0.7a,c
* Presented as means standard deviation
a
t test significantly different (p<0.05) from control.
c
t test significantly (p<0.05) from malnutrition.
0 50 100 150 200 250 300
10 12 14
Rats age (weeks)
Body
wei
gh
t (
g)
Control
Realimentation
Table 2. Small Intestinal Parameters* Prenatally-induced Malnutrition before (6 Weeks Old) and after Realimentation (14 Weeks Old)
Parameters
Before realimentation After realimentation Control
(n=8)
Malnutrition (n=8)
Control (n=8)
Malnutrition (n-7)
Realimentation (n=8)
Small intestinal weight (g)
5.2 + 0.7 3.4 + 0.2a 7.8 + 0.9 4.6 + 0.5 5.8 + 0.8a,c
Small intestinal length (cm)
110.2 + 3.7 94.2 + 3.5a 129.3 + 7.0 98.6 + 3.0 116.9 + 4.6a,c
Small intestinal diameter (mm)
2.5 + 0.2 1.8 + 0.1a 3.1 + 0.3 2.0 + 0.1 2.8 + 0.2a,c
Mucosa weight (mg) 1666.3 + 363.0 1252.5 + 209.5a 2552.1 + 397.7 1475.0 + 238.1 1839.5 + 322.5a,c
* Presented as means + standard deviation
a
t test significantly different (p<0.05) from control
c
t test significantly different (p<0.05) from malnutrition
All small intestinal parameters, after realimentation showed higher values significantly in realimentation prenatally-induced malnutrition rats than non realimentation prenatally-induced malnutrition rats, but lower significantly than control.
Small Intestinal Mucosa Parameters
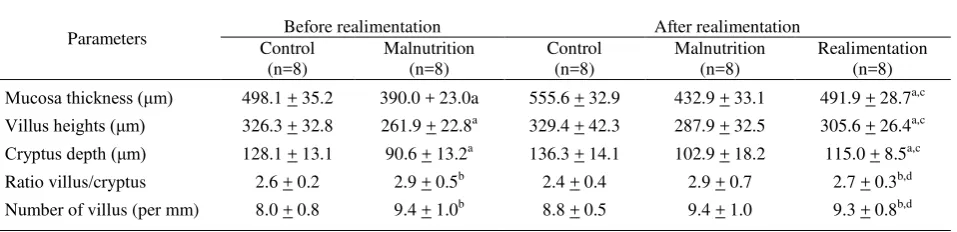
Small intestinal morphometric results i.e. mucosa thickness, villus heights, cryptus depth, ratio villus / cryptus and number of villus (Table 3).
Before realimentation mucosa thickness, villus heights, and cryptus depth of prenatally-induced malnutrition
rats were lower significantly than control, ratio villus/cryptus and number of villus prenatally-induced malnutrition rats were not different than control.
After realimentation, mucosa thickness, villus heights, and cryptus depth of realimentation prenatally-induced malnutrition were higher significantly than non realimentation prenatally-induced malnutrition rats, and were lower than control. Ratio villus/cryptus and number of villus realimentation prenatally-induced malnutrition rats were not different compared with non realimentation prenatal malnutrition rats and control.
Table 3. Small Intestinal Mucosa Parameters* Prenatally-induced Malnutrition Rats before (6 Weeks Old) and after Realimentation (14 Weeks Old)
Parameters Before realimentation After realimentation Control
(n=8)
Malnutrition (n=8)
Control (n=8)
Malnutrition (n=8)
Realimentation (n=8) Mucosa thickness (μm) 498.1 + 35.2 390.0 + 23.0a 555.6 + 32.9 432.9 + 33.1 491.9 + 28.7a,c Villus heights (μm) 326.3 + 32.8 261.9 + 22.8a 329.4 + 42.3 287.9 + 32.5 305.6 + 26.4a,c Cryptus depth (μm) 128.1 + 13.1 90.6 + 13.2a 136.3 + 14.1 102.9 + 18.2 115.0 + 8.5a,c Ratio villus/cryptus 2.6 + 0.2 2.9 + 0.5b 2.4 + 0.4 2.9 + 0.7 2.7 + 0.3b,d
Number of villus (per mm) 8.0 + 0.8 9.4 + 1.0b 8.8 + 0.5 9.4 + 1.0 9.3 + 0.8b,d
* Presented as means + standard
a
t test significantly different (p<0.05) from control
b t test not significantly different (p>0.05) from control c
t test significantly different (p<0.05) from malnutrition
d
Protein Content and Small Intestinal DNA
Protein content and small intestinal mucosa DNA prenatally-induced malnutrition before and after realimentation (Table 4).
Protein content of small intestinal mucosa prenatally-induced malnutrition before realimentation were lower than control rats, and small intestinal mucosa DNA content were not different. Ratio protein content/DNA content calculation resulted lower values in prenatally-induced malnutrition rats than control.
Protein mucosa content and ratio protein/DNA of small intestinal mucosa after realimentation showed higher values in realimentation prenatally-induced
malnutrition rats than non realimentation prenatally-induced malnutrition rats, but lower than control rats. DNA content did not show differences among three rats groups.
Small Intestinal Disaccharidases Activity
Lactase, maltase, and sucrase activity in prenatally-induced malnutrition before realimentation had lower values significantly than control (Table 5).
After realimentation, lactase, maltase and sucrase activity were higher significantly in realimentation prenatally-induced wmalnutrition rats than non realimentation rats, but lower than control.
Table 4. Protein Content* and Small Intestinal Mucosa DNA* Prenatally-induced Malnutrition Rats before (6 Weeks Old) and after Realimentation (14 Weeks Old)
Parameters
Before realimentation After realimentation
Control (n=8)
Malnutrition (n=8)
Control (n=8)
Malnutrition (n=7)
Realimentation (n=8)
Protein content (mg) 386.5 + 81.6 254.8 + 42.7a 704.7 + 122.6 333.8 + 49.8 443.0 + 74.4a,c DNA content (mg) 47.5 + 15.5 42.7 + 11.5b 50.4 + 15.7 45.4 + 15.5 44.0 + 11.1b,d
Ratio protein/ DNA 8.6 + 2.3 6.2 + 1.4a 15.4 + 6.1 8.0 + 2.5 10.4 + 1.7a,c
* Presented as means + standard
a
t test significantly different (p<0.05) from control
b t test not significantly different (p>0.05) from control c
t test significantly different (p<0.05) from malnutrition
d t test not significantly different (p>0.05) from malnutrition
Table 5. Small Intestinal Mucosa Disaccharidases Activity* Prenatally-induced Malnutrition Rats before (6 Weeks Old) and after Realimentation (14 Weeks Old)
Parameters
Before realimentation After realimentation
Control (n=8)
Malnutrition (n=8)
Control (n=8)
Malnutrition (n=7)
Realimentation (n=8)
Lactase** 30.9 + 3.7 23.4 + 3.5a 35.1 + 6.4 17.9 + 1.3 22.5 + 2.8a,c
Maltase** 627.7 + 58.0 552.9 + 64.8a 612.1 + 68.7 468.5 + 35.5 509.8 + 26.1a,c Sucrase** 53.2 + 5.3 48.8 + 2,2a 52.4 + 5.9 38.2 + 2.5 41.3 + 3.5a,c
* Presented as means + standard deviation. ** Activity in μmol/menit/g mukosa.
a
t test significantly different (p<0.05) from control.
DISCUSSION
Gastrointestinal tract are developing fast at intrauterine phase. Gastrointestinal development are incomplete when was born, function development of gastro-intestinal tract still continue postnatal especially at weaning period. Prenatal and weaning period are critical in gastrointestinal tract development. Stress that occur at those time will cause bad development for gastrointestinal tract. In other sides, gastrointestinal tract development is interaction of 4 factors, i.e genetic, biologic phase, endogen mechanism (hormonal), and environment effects. Genetics provides potency for development, but the full result still need optimal condition. Malnutrition that occur at intrauterine and weaning period, is important enviroment factor that inhibit gastrointestinal tract development.6
Low birth-weight infants prevalence rate according to survey in 1995 in Indonesia is around 14%.2 If low birth-weight infants prevalence rate more than 10%, that caused by the increase of low birth-weight infants that had intrauterine growth retardation. Total premature is almost unchanged (5-7%). It is thought that total intrauterine growth retardation infants around 7-9%.
Low birth-weight infants have higher morbidity and mortality rate than mature infants.7 Several studies about infants growth reported that premature infants growth was worse than mature infants.7,8 It was also reported that below 1 year of age, malnutrition was found most in low birth-weight infants and malnutrition caused small intestinal mucosa immunity development disorder.3,9 The most common causes of infants growth retardation are gastrointestinal problems, especially maldigestion, malabsorbsi, and chronic diarrhea.3,7
Malnutrition Induced of Sprague-Dawley Rats to Obtain Material in This Study
This study used experimental animal, Sprague-Dawley white rats which were prenatally-induced malnutrition, as study materials. Sprague-Dawley rats were chosen because many used in previous studies.10,11 Malnutrition model that being used was similar with malnutrition in Indonesia, i.e general nutrient deficiency. Malnutrition induced technique were divided into four kinds, i.e (a) uterine blood reduction;12 (b) low protein diet;13 (c) diet restriction; 10,11
and to expand litter at weaning period (expanded litter technique).14 In those malnutrition induced,
malnutrition rats body weight were around 40-70% from control rats body weight. The study mentioned comparison of malnutrition rats body weight between control to present malnutrition condition. Then in this study used rats with body weight equal or less 70% from control rats. Malnutrition induced resulted prenatally-induced malnutrition rats with body weight 69% from body weight control.
During this study, 1 rat died because of unknown reason, in non realimentation malnutrition group after 3 weeks realimentation. It did not influence the results because total rats in one group still 7 rats, more than minimal, 5 rats. All results of the group be calculated using 7 rats.
Prenatally-induced Malnutrition Body Weight Rats after Realimentation
Before realimentation, in prenatally malnutrition there was decreases of (a) serum albumin level, (b) physical parameters (body weight, body length, ratio weight / length, and chest circumstances), also (c) small intestinal parameters (weight, length, and diameter).
This study found that the increase of realimentation prenatally-induced malnutrition body weight rats did not reach control body weight rats. This data showed that at the end of realimentation phase, normal body weight could not be achieved. This was appropriate with the findings that (a) serum albumin level, (b) others physical parameters (body length, ratio weight/length, and chest circumstances), and (c) small intestinal parameters (weight, length, and diameter), did not reach normal values. When compared to non realimentation, clearly there was improvement, and from body weight that increase at last 4 weeks, possibly recovery will occur when realimentation phase is extended.
Histopathology, Protein Content and DNA Content of Prenatally-induced Malnutrition Small Intestinal Mucosa after Realimentation
mucosa DNA content that remain unchanged compared to control. This reflected small intestinal mucosa tissue rats that eventhough had hypotrophy, but was able to maintain its number of cells in the face of nutrient restriction at prenatal period. This results are similar to previous studies,4 that using same kind of rats and same malnutrition induced method, found hypotrophy and normoplastic in prenatally-induced small intestinal mucosa rats.
At the end of realimentation phase, there was improvement of realimentation prenatally-induced malnutrition small intestinal mucosa rats even though did not reach normotrophy.
Prenatally-induced Malnutrition Small Intestinal Mucosa Rats Disaccharidases Spesific Activity after Realimentation
Before realimentation, small intestinal mucosa spesific activity of lactase, maltase, and sucrase decreased in prenatally-induced malnutrition rats. Consistent with histopathology examination results, i.e. decreases of mucosa thickness, villus heights, and cryptus depth.
The decreases of lactase, maltase, and sucrase spesific activity in prenatally-induced malnutrition rats possibly because of villus peak formation with its brush border, where lactase, maltase and sucrase placed, incomplete caused by malnutrition. In realimentation villus heights increased. Consistent with increases of lactase, maltase, and sucrase specific activity.
After realimentation, lactase spesific activity increased, also others disaccharidases, maltase and sucrase, but did not reach control values.
Results of this study informed that realimentation was able to improve morphology and to increase dis-accharidases activity of prenatally-induced malnutrition small intestinal mucosa rats. Realimentation in pregnant and lactation woman is expected to prevent maternal malnutrition.
CONCLUSION
Prenatally-induced malnutrition did not reduced the population of small intestinal enterocytes. Realimentation in rats in prenatally-induced malnutrition was able to (1) increase body weight, but did not reach normal, (2) improve small intestinal mucosa hypotrophy, but
did not reach normotrophy, (3) increase disaccharidases activity, but did not reach normal.
Suggestions
Further research of realimentation in prenatally-induced malnutrition by extending realimentation phase. Prolonged realimentation is expected to improve small intestinal morphology and biochemistry small intestinal mucosa caused by malnutrition.
Acknowledgments
The authors are grateful to drh. Cornelis for her assistance in animal experiments method, dr. Vera Damayanti SpPA(K) for her assitance to read histo-pathology slides, and dr. Sofiudin SKM for his assitance to analyze statistics. To Drug and Food Administration Unit laboratory (Jakarta), Centre for Research and Development of Food and Nutrition (Bogor), Veterinary Research Unit laboratory (Bogor), Department of Clinical Pathology laboratory, Department of Bio-chemistry and Biomoleculer laboratory, and Department of Pathology Anatomy laboratory Faculty of Medicine University of Indonesia for their assistance in this study from the beginning to this study report, which is part of dissertation. To dr. Mohammad Sadikin DSc, Professor dr Soemilah Sastroamidjojo, SpGz, Dr Mien Karmini Mahmud, MS, APU, and Professor dr Mpu Kanoko Sastrosuwignyo, SpPA(K), PhD for reading and correcting the dissertation manuscript.
REFERENCES
1. de Onis M, Monteriro C, Akre J, Clugston G. The worldwide magnitude of protein-energy malnutrition: an overview from the WHO global data base on child growth 1998.(cited November 2004) Available at:
http://www.who.int/nut/documents/pem_bulletin/1995.htm.
2. SUSENAS 1995. Biro Pusat Statistik. Jakarta 1996. 3. Suharyono, Firmansyah A, Wilharta AS. Aspek
gastrointestinal pada tumbuh kembang anak. Dalam: Suharyono, penyunting. Esensial gastroenterologi anak. Jakarta: Balai Penerbit FKUI; 1995.p.97-107.
4. Firmansyah A. Pengaruh malnutrisi terhadap saluran cerna tikus putih: perhatian khusus pada perkembangan morfologis, biokimia, dan fisiologi terutama kolon (disertasi). Jakarta: Program Pascasarjana Universitas Indonesia; 1992.
5. Dahlqvist A. Method for assay of intestinal disaccharidases. Analyt Biochem 1964;7:18-25
7. Behrman RE, Shiono PH. Neonatal risk factors. In: Fanaroff AA, Martin RJ, eds. Neonatal-perinatal medicine: disease of the fetus and infant. 6th ed. St Louis: Mosby; 1997.p.3-12.
8. Kusharisupeni. Peran berat lahir dan masa gestasi terhadap pertumbuhan linier bayi di kecamatan Sliyeg dan kecamatan Gabuswetan, kabupaten Indramayu, Jawa Barat 1995-1997 (disertasi). Jakarta: Fakultas Kesehatan Masyarakat, Universitas Indonesia;1999.
9. Prindull G, Manzar A. The ontogeny of the gut mucosal immune system and the susceptibility to infection in infants of developing countries. Eur J Pediatr 1993;152:786-92.
10. Firmansyah A, Suwandito L, Penn D, Lebenthal E. Pre-and postnatal nutrient depriviation causes hypotrophic small intestinal and hypoplastic colonic mucosa. Am J Clin Nutr 1988;47: 779.
11. Young CM, Lee PC, Lebenthal E. Maternal dietary restriction during pregnancy and lactation: effect on digestive organ development in suckling rats. Am J Clin Nutr 1987;46:36-40.
12. Lebenthal E, Nitzan M, Chrzanowksi BL, Krantz B. The effect of reduced maternofetal blood flow on the development of fetal pancreatic acinar and enzymes. Pediat Res 1980;14:1356-9
13. Shrader RE, Ferlatte MI, Zeman FJS. Early postnatal development of the intestine in progeny of protein-deprived rats. BilNeonate 1977;31:181-98.