Vol. 41 (2000) 405–426
An experiment on sequential rent-seeking
Joachim Weimann
a,∗, Chun-Lei Yang
b, Carsten Vogt
aaFaculty of Economics and Management, Otto-von-Guericke Universität Magdeburg, 39016 Magdeburg, Germany
bSun Yat-Sen Institute for Social Sciences, Academia Sinica, Nankang, Taipei, Taiwan
Received 10 February 1997; received in revised form 12 November 1998; accepted 15 December 1998
Abstract
In an experiment on sequential rent seeking, we find that the theoretically predicted first-mover advantage does not exist empirically. Rather, a second-mover advantage can be observed. Though the subgame perfect equilibrium can not prevail in experiment, individual behavior is highly reasonable nevertheless, such that subjects appear to play a reduced form of the original game. We also observe that the efficient fair outcome can not be achieved because of the exploitation opportunity for the second mover. The observed behavior is quite different from that in ultimatum and trust game experiments. ©2000 Elsevier Science B.V. All rights reserved.
JEL classification: C91; C92; D72
Keywords: Rent-seeking; Experiment; Reciprocity; Fairness; Exploitation
1. Introduction
For a long time, rent seeking has been analyzed in the context of a game with simultaneous moves, based on the seminal work by Tullock (1980). As developed by Tullock, rent seeking involves sunk investments by independent interest groups in the pursuit of an exogenously given prize — the political rent. The winner takes the prize alone, but the question of who the winner will be is subject to political uncertainty. One problem with this model, however, is that no equilibrium in pure strategies exists for a large range of parameters. In this paper, we study rent seeking in a variation of Tullock’s simultaneous-move setup in which players
∗Corresponding author.
E-mail address: [email protected] (J. Weimann).
instead move sequentially, following the studies by Leininger (1993) and Leininger and Yang (1994).
Given this modification, the game has a unique subgame perfect equilibrium in which the first mover has a strategic advantage and receives the maximum payoff. Nonetheless, in an experimental environment, our subjects fail to find this outcome. Moreover, the second mover attains the highest reward. Thus, we have another example of the failure of equilibrium to predict or explain interactive behavior. More precisely, our subjects are well aware of the impact of the subgame perfect equilibrium. However, despite this the second movers instead attain negative payoffs themselves to fend off the first mover’s ‘equilibrium claim’. That they are quite successful doing so is facilitated by the nature of the contest: Moving last, the second mover has the power to impose high negative payoffs on their opponents.
The basic models and the theoretical predictions subject to our initial test are given in Section 2. Section 3 is devoted to the description of our experimental design. Results are presented in Section 4, where we find an overwhelmingly evident second-mover ad-vantage, contrary to the theoretical prediction. We also systematically characterize the off-equilibrium behavior in the data. Concluding remarks can be found in Section 5.
2. The theory of sequential rent-seeking
Tullock (1980) uses a lottery machine to model the rent-seeking contest as follows. Suppose we have two rent-seekers, X and Y, who invest x and y, respectively, to influence the award of a prize of value V. The expected payoffs for X and Y are, respectively,
F (x, y)= x
r
xr+yrV −x, G(x, y)=
yr
xr+yrV −y (1)
where r is a parameter measuring the contest ‘intensity.’ The non-existence of an equilibrium in pure strategies, the so-called Tullock swamp, occurs when r > 0. Elsewhere, Leininger and Yang (1994) show that this problem disappears in sequential games where players do not move simultaneously, independent of the game length. Here, we concentrate on the case with two steps, one move for each player, which is strategically representative for all finite-round cases.
Suppose X is the first mover, Y the second. Given X’s bid x, the first-order condition for the problem max G(x,y) gives us the solution y(x). For high values of x with x≥xp, the
second mover Y is left in a position in which every y(x) > 0 yields a negative payoff. Thus, we can easily conclude that there is only one subgame perfect equilibrium in this game:
Y, as the second mover, chooses y∗(x)=0 at x=x
p, and X preempts with xp. Hence, the
equilibrium outcome is (xp,0). There is an additional class of Nash equilibrium outcomes
(x,¯ 0)forx¯ ∈xp, V, called ‘shifted preemption,’ which can be sustained by the following
(0,d) is also sustainable as a Nash equilibrium outcome by Y ’s threatening to punish any positive bid. This outcome yields Y his maximum payoff.
The most striking feature of this two-stage game is the clear first-mover advantage that follows from the game theoretical prediction. The first mover is able to preempt; he can make a bid that leaves the second mover with at best a zero payoff. He is clearly the one to dictate in the game — and he should be able to derive a profit from this position. Remarkably, as our study will show, he fails to do so.
3. Experimental design1
The fully computerized experiment was run at the University of Magdeburg and involved a total of 30 students mainly majored in economics and management. Participants were divided into five groups of six players each. Each of these groups then played a two-stage sequential rent-seeking game 30 times.
At the beginning of every round, subjects were randomly put into pairs and given a role as either a first mover or a second mover. During the first 10 rounds, the computer program ensured that all players were in the first mover position as often as in the second mover position. For rounds 11–30, each player had a fixed role given to him in round 11. Players were informed accordingly. The fixed-role phase is designed so as to make sure that subjects’ decisions will not be complicated by the thought of taking the opposite role later in the experiment.
Each pair then played the sequential Tullock-lottery game in which the payoffs were defined by payoff function (1). The sensitivity parameter r was set at 8 to make the game sufficiently competitive, and the value of the rent was 100 lab-dollars (LD). In each of the total 30 rounds each player had a credit of 200 LD, the upper bound of any bid, which they could use to buy ‘lottery tickets’ x and y, respectively. This credit had no effect on the payoff, which was only determined by the number of lottery tickets purchased (think of it as the amount of resources invested in the rent-seeking competition).
Because the payoffs are difficult to calculate for r=8, subjects were provided with two kinds of aid. First, a printed payoff-matrix in A3 size was handed out2 and, second, the computer program offered the opportunity to simulate the payoff outcomes with all feasible combinations of bids. Therefore, before deciding on the next bid, players could check the consequences of their actions.
In order to avoid unnecessary framing effects, no ‘story’ was told. Subjects were simply informed of the payoff function (1) and the rules of the game. Instructions were given verbally and in printed form (see Appendix A). It is important to note that the lottery was not actually carried out. To eliminate the influence of different attitudes towards risk, the expected values as defined by (1) were taken as the lab-dollar payoff. At the end of
1A first series of fully computerized experiments was run at the University of Bochum with a total of 60 students of economics and business. We treat these experiments as a pilot project and will not report the results here, although they are quite in line with our findings in the main experiment. Full data set and analysis of the pilot study is available on request.
the experiment this payoff was converted into DM at the rate of 60 LD=1 DM and the resulting amount of money was paid in cash. During the experiment, no communication between players was allowed, each subject obtained only their own history of moves from the computer, and there was no way to observe the behavior of other subjects. In addition, there was a fixed payment of 10 DM. The subjects were not told of the exact amount before the experiments ended.
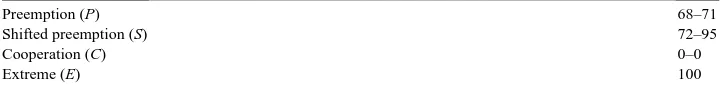
Looking at the payoff-matrix (see Table 1), it is easy to find the optimal bid for the first mover X in the two-stage game. If X makes a preemptive bid of say 70, Y has no chance of getting a payoff higher than 0. Thus, her best answer to the preemptive bid 70 is to play 0. The precise first-mover bid in subgame perfect equilibrium is, in fact, slightly more than 68.
4. Results
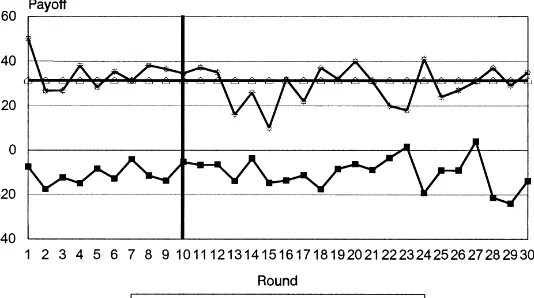
Could first movers realize their theoretically predicted advantage in our experiment? As Fig. 1 shows, the answer from the aggregate data is clearly no.
In fact, the roles even seemed to be reversed, as the second-mover’s average payoff is roughly that of the equilibrium first-mover one while the first mover’s is even below the equilibrium second-mover payoff. Apparently, keeping the players’ positions fixed did not have any significant effect on aggregate payoffs. Note that the second-mover advantage was also present in the pilot project in Bochum to about the same extent. Thus, this evidence can hardly be dismissed as some design-specific anomaly. To understand the reasons why the subgame perfect outcome fails to prevail, let us now turn to the data on the individual behavior of the subjects that reveals highly reasonable patterns.
First of all, the strategic implication of preemption and shifted preemption has been well recognized. The first mover’s bid is either between 68 and 100 LD, or around 1 LD. For the former, the main motivation is to preempt as theoretically predicted. Yet, it is sometimes
Table 2
aimed to punish the second movers as a group for previous non-cooperative actions. In contrast, the small bid is meant to solicit a cooperative response from the second mover.
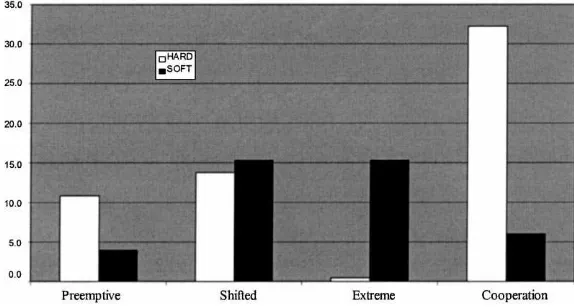
From the data, almost all second-mover actions can be characterized as either Hard or Soft in the following sense. Facing a preemptive attempt, Soft means bidding 0, which is also subgame perfect. Accordingly, Hard means punishment, which yields both players negative payoffs. It is intriguing, though, that the punishment is mostly carried out in an ‘optimal’ fashion, i.e. by roughly bidding the locally best response y(x). Facing a small bid, Hard means approximately playing the best reply, hence exploiting the first mover’s willingness to cooperate,3 while Soft means bidding y=x, thus sharing the rent. For further data
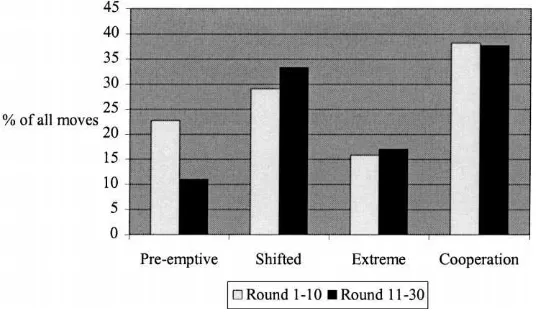
analysis, the first mover’s observed actions are divided into the following classes (Table 2). The boundary between classes P and S reflects the fact that the bid 70 is the prominent number next to the subgame perfect equilibrium. From 72 upwards, the bids reflect the first mover’s recognition of possible Hard responses from the second mover, either meant to be punishment or just a result of trembling-hand mistakes. In our study, the action E deserves some special attention. With the second mover’s rational answer being zero, this is the only Nash equilibrium in the game that gives both players the same payoff, though in a very inefficient way. Fig. 2 shows that the only conspicuous difference between the two phases of the experiment is a reduction of P that is accompanied with an increase of S, indicating some learning about the second mover’s actions.
For the second mover action, two observations stand out: First, the action E is almost never punished, and second, C is rarely honored with the exception of one subject (player 7–6) who is accountable for 14 of a total of 21 cooperative responses in rounds 11–30. Since ‘unreasonable’ actions left out in our above discussion are few, only six ‘anomaly’ cases that make up 2 percent of the total 300 cases for the fixed-role part, Fig. 3 offers a fairly complete description of the aggregate second-mover behavior. We observe the tendency that the punishment frequency declines with the height of the (shifted) preemptive bid. From Fig. 3, there also seems to be an increase in punishment frequencies and in cooperative responses. But a chi-square test shows that these differences are statistically not significant. All in all, as Figs. 2, 3 show, the observed behavior does not vary much over time in aggregate terms. Only the tendency to substitute P with S is present.
One very surprising finding evident from the data is that the subjects played the game as if it was in a reduced form, which, by using the typical outcomes (70, 90), (80, 100) and (100, 130) in case of punishment, takes the following form (Table 3).
Given the complexity of the original rent-seeking game as compared to similar sequential games in the experiment literature, this is quite a striking feature indeed. From the viewpoint
Fig. 2. First mover behavior.
Fig. 3. Second mover behavior.
Table 3
Reduced form of the sequential rent-seeking game Second mover
Hard Soft
First mover Preemptive −58;−2 30; 0
Shifted preemption −66;−14 20; 0
Extreme −89;−41 0; 0
Fig. 4. Aggregate outcome frequencies.
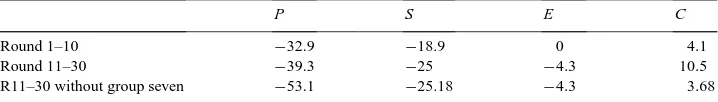
of the strict game theoretical prediction, however, it still implies too much variety in subjects’ behavior. To free us from the conceivable problem of incentive distortion in a variable-role mode, our data analysis will focus on rounds 11–30 in the following discussion.
Note that, as in the original form, (P, Soft) is the unique subgame perfect equilibrium outcome. Apart from this, all crucial interest conflicts remain the same and even get high-lighted in the reduced form, so that it has become irresistible for us to compare our results with similar experiments in the literature. The general insight from ultimatum game ex-periments, as well as those on reciprocal behavior (Berg et al., 1995 for instance), would suggest that (C, Soft) was a more likely long-run outcome here. Also, a cautious theoretical prediction may expect (S, Soft) to prevail in the long run as it costs significantly more for the second mover to punish, which in return makes a shifted preemptive bid safer. Yet, as Fig. 4 shows, these outcomes occurred in only 21.3 percent of all cases. In fact, the outcome (C, Soft) is almost non-existent in all but group seven, which accounts for 17 of the total 21 cases. Reciprocity apparently does not account for the majority of our observations. In contrast, (C, Hard) and (E, Soft), making up 47.5 percent of all outcomes, occurred rather persistently in our experiment. How can we explain this?
The individual histories (Tables 4–7 and Appendix B) provide us with more information about first-mover behavior. One way for a first mover to get a positive payoff is to have a preemptive outcome by playing P or S, and the other is to play C in the hope of a cooperative response. For the latter, players 6–2, 8–1 and 8–2 used something reminiscent of tit-for-tat behavior.4 They mixed C with E, sometimes also P or S, more or less frequently. Note that the first movers almost never mixed E with P and/or S. Some subjects like 7–3, 9–2 and 9–3 hardly did anything else but C. To obtain the preemptive outcome, players 6–1, 6–3, 7–1 and 10–2 rather stubbornly kept bidding high. However, the responses from the second movers were very often frustrating for first movers. As a reaction, player 8–3 settled permanently for S, while 7–2 changed to C in contrast.
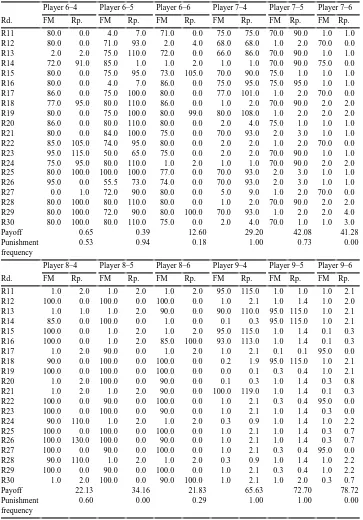
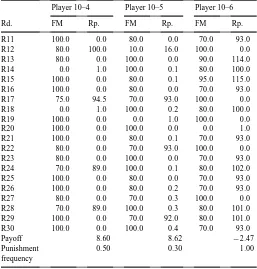
Table 7
Second mover behavior in the fixed-role phase
Player 6–4 Player 6–5 Player 6–6 Player 7–4 Player 7–5 Player 7–6
Rd. FM Rp. FM Rp. FM Rp. FM Rp. FM Rp. FM Rp.
Player 8–4 Player 8–5 Player 8–6 Player 9–4 Player 9–5 Player 9–6
Table 7. (Continued).
Now, let us look at second-mover behavior. The only way for second mover to get a positive payoff is when the first mover makes a bid lower than 68, i.e. C in the reduced form. Unlike the ultimatum game but similar to the trust game of Berg et al. (1995), the second mover has the option to exploit the first mover in this case by playing Hard (Recall, however, that the first mover has no outside option to fall back on as in the trust game). Given their inclination to exploit, together with the willingness to bear the cost of punishing a bid higher than 68, we have a complete characterization of second mover behavior.5
Now look at the subgame following C. In the original form, the second mover can freely split the potential gain of about 97–98 LD. For example, answering x=1 with y=1.1, 1.2, and 1.3 will result in outcomes (31, 67), (18, 80), and (10, 88), respectively. But unlike in Berg et al. (1995) and the dictator experiments, these alternative outcomes rarely took place here, so rarely that the reduced form quite exhaustively characterizes what really happened. Anyway, the dilemma the second mover faces is whether to exploit the situation when the chance comes along, which may upset the first mover so much that he will hold back cooperation in the next rounds, or to be nice to foster a cooperative environment.6
5Recall that people are matched randomly and anonymously such that, for everyone, only the aggregate behavior of all opponents on the other side in a group is relevant.
Table 8
For two reasons, though, the fate of exploitation seems inevitable. First, nurturing a co-operative environment is a public good among the second movers in a group, as we have a random-matching design here. Second, the second movers are aware of their powerful weapon of being able to punish bids higher than 68. Though still a public good, the oppor-tunity costs of carrying out this action, 2 and 14 LD for P and S, respectively, are lower than the 49 LD when forfeiting the right of exploitation. Moreover, punishing inflicts a payoff difference of about 87 LD on the first mover, much higher than the 50 LD in case of cooperation. Thus, the ‘collective’ punishing pressure from the second movers might just be high enough to crush the resistance from the first movers. Combined with the higher opportunity cost, there is no need for strategic investment for cooperation. The effects of this consideration on the first mover’s payoffs for different actions are implicitly given in Table 8.
On average, it is the best for the first mover to avoid the preemptive actions P and S, as intended by second movers as a group. The higher losses may reflect the fact that the ‘battle fronts’, and consequently the interests, in the fixed-role rounds are better delin-eated for everyone, so that ‘tough guys’ can become more assertive in pushing for their advantage. It is therefore not surprising that the ‘rational’ first movers kept playing C despite being constantly exploited, particularly in groups eight and nine as evident from Appendix B. Some real tough ones like players 8–3 and 10–3 kept bidding high after dis-appointed cooperation attempts. This also brings us to another important observation in our study.
Though, we can explain quite a substantial part of the data using the above rational-izations, the displayed behavior itself is not always directly strategically motivated. If the previous actions by the second movers were really meant to influence the future ac-tions of the first movers as part of a strategic plan, they would stop punishing them in the very last round as there is no future after it. With the exception of player 7–5, all second movers who intensively punished kept doing so even in the last round. Re-markably, player 8–6 who had been benign throughout the game made one of his only punishing bids in the final round. Thus, it is fair to conclude that the prevalence of the second-mover advantage was strongly carried on by emotional actions, like in the model by Frank (1988).
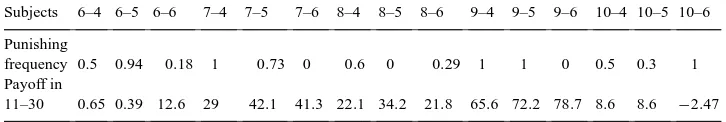
Table 9
SM punishing frequencies and payoffs
Subjects 6–4 6–5 6–6 7–4 7–5 7–6 8–4 8–5 8–6 9–4 9–5 9–6 10–4 10–5 10–6 Punishing
frequency 0.5 0.94 0.18 1 0.73 0 0.6 0 0.29 1 1 0 0.5 0.3 1 Payoff in
11–30 0.65 0.39 12.6 29 42.1 41.3 22.1 34.2 21.8 65.6 72.2 78.7 8.6 8.6 −2.47
The Spearman rank correlation test shows that there is no correlation between the payoffs and the punishing frequencies (ρ= −0.117, p=0.68). Yet, within each group the free riders do relatively better than do their more emotional, i.e. more frequently punishing, peers!
The final point of our analysis is devoted to the outcome (E, Soft). Punishing E in-curs high costs to the second mover. Moreover, the outcome is fair in the sense that both players get equal payoffs. Bidding 100 is a clear sign of resignation by a first mover, who sees no chance for any positive payoff, yet finds the fate of exploitation with C un-bearable. Since both players get 0 LD in (E, Soft), according to the fairness equilibrium concept of Rabin (1993), this outcome is much more likely to occur than the payoff out-come (5, 0) for instance, because of the associated ‘unfairness’ the second mover may perceive. It is therefore not surprising to find a strong discontinuity in punishing behav-ior at the bid 100. An interesting hypothetical question remains. What would the sec-ond mover do if all first movers played only E. If guys like player 9–4 are involved, this might become an even nastier war of attrition — it likely would come down to who blinks first.
All in all, the second movers successfully used the opportunity to punish to keep the first movers away from their equilibrium claims. Consequently, the best first movers could do was to offer cooperation and hope that the second movers would at least sometimes be merciful enough to split the pie with them. The punishment by the second movers, consequently, turns out to be a very profitable way of being ‘non-rational’ in a game theore-tical sense.
5. Concluding remarks
Our data undoubtedly show that the second mover is successful in this contest. Nowhere is the first mover close to getting his game-theoretically-conceded, (shifted) preemptive payoff. The best he can achieve is something close to a zero payoff, hoping to meet some merciful second mover who occasionally cooperates. In contrast, in the trust games dis-cussed in the literature, the first mover roughly gets the value of his outside option, which is unavailable here.
A remarkable observation is also that the theoretically feasible, efficient ‘fair’ out-come never prevails. Unlike in the ultimatum game, second movers in our setting have the chance to exploit the situation, which is what they do consistently in our experi-ment. This is in line with the idea that people tend to show concern for fairness only if they are in danger of being treated unfairly themselves, and not if they are the ‘predators’.7
Finally, in the finite version of the sequential rent-seeking game, a considerable amount of the rent is still dissipated because preemptive bids have to be relatively high. The em-pirical fact of low expenditures in rent-seeking situations, therefore, cannot be explained with this kind of model. Yet, as has been proven in Yang (1993, 1999) and Leininger and Yang (1994), this so-called ‘Tullock paradox’ disappears in the case of infinite rounds, i.e. if the contest is open-ended. The basic argument is that the fear of retaliation and es-calation will lead contenders to stop increasing their efforts early, as if they ‘agree’ on some cooperative solution to split the pie. Weimann et al. (1997) is an experimental test of this efficient rent-seeking hypothesis, where, for a change, the subgame perfect outcome prevails.
Acknowledgements
Chun-Lei Yang gratefully acknowledges the financial support from DFG under the post-doctoral scholarship and is indebted to the IED at the Economics Department of Boston University for hospitality during the preparation. Joachim Weimann gratefully acknowl-edges financial support of the DFG and the Land Sachsen-Anhalt.
Appendix A. The experiment instruction
A.1. The game
All six participants are randomly divided into three pairs. Each pair is then to play the following game. A prize of 100 laboratory dollar (LD) is given away to the winner of a lottery. Each player decides on the amount of lottery tickets he wants to purchase. All purchased lottery tickets are fed into a lottery machine that randomly determines the winner between the two participants. Formally, if x is the amount of lottery tickets bought by
player 1 while y is that bought by player 2, player 1’s and player 2’s chances of winning
respectively. Notice that the probability of winning depends solely on the lottery tickets purchased by the two players. Each player has 200 LD available for his purchase, which is thus the upper limit one can spend in each game. After the players submit their pur-chase decisions, the lottery is not really carried out. Rather, the players get their expected payoffs:
respectively. Notice that the game is played sequentially, meaning that player 1 submits his decision first, followed by player 2, who then knows the decision by player 1. To assist your decision-making, you will find a table with useful information at your seat. This shows all payoffs for player 1 for different combinations of both players’ decisions. The same information can be obtained on screen when you simulate your own and your opponent’s decisions.
A.2. The implementation
First, the game described above will be carried out 10 times. This means in particular that you have 200 LD available for purchase again and the pairs are randomly matched anew in each new round. You have no information about who your opponent in each round is. But you will be given the roles of first and second mover five times each during the course.
After this, 10–20 more rounds will be played depending on the time spent so far. This time, however, there is no change in roles, i.e. you keep the role you get in the first round for the whole 10–20 rounds to be played now.
To allow you to familiarize yourself with the computer program in use, four try-out rounds will be played without payoffs. You have to log on with your player number that is attached to your seat.
At end of the whole experiment, the aggregate amount of LD will be exchanged for DM at the rate of 60 : 1 (60 LD=1 DM). You also will get a fixed sum paid off at the end, the exact amount of which will be announced then. In case you have accumulated a negative amount of LD during the course of the game, this will be deducted from your fixed payment with the same exchange rate.
References
Berg, J., John, D., Kevin, M., 1995. Trust, reciprocity, and social history. Games and Economic Behavior 10, 122–142.
Bolton, G., Ockenfels, A., 1997. ERC — a theory of equity, reciprocity, and competition. In: American Economic Review (in press).
Frank, R., 1988. Passions within reasons. The Strategic Role of the Emotions. Norton, New York. Fehr, E., Schmidt, K., 1999. A theory of fairness, competition, and cooperation.
Leininger, W., 1993. More efficient rent-seeking — a Münchhausen solution. Public Choice 75, 43–62. Leininger, W., Yang, C.-L., 1994. Dynamic rent-seeking games. Games and Economic Behavior 7, 406–427. Rabin, M., 1993. Incorporating fairness into game theory and economics. American Economic Review 83 (5),
1281–1302.
Tullock, G., 1980. Efficient rent-seeking. In: Buchanan, J.M., Tollison, R.D., Tullock, G. (Eds.), Toward a Theory of Rent Seeking Society. A & M University Press, Texas, pp. 97–112.
Weimann, J., Yang, C.-L., Vogt, C., 1997. Efficient rent seeking in experiment. Discussion paper, University of Magdeburg.
Yang, C.-L., 1993. Cooperation by credible threats: on the social costs of transfer contests under uncertainty. Journal of Institutional and Theoretical Economics 149 (3), 559.