*
Chiara Cirelli, Giulio Tononi
The Neurosciences Institute, 10640 John J. Hopkins Drive, San Diego, CA 92121, USA
Abstract
Sleep and waking differ significantly in terms of behavior, metabolism, and neuronal activity. Recent evidence indicates that sleep and waking also differ with respect to the expression of certain genes. To systematically investigate such changes, we used mRNA differential display and cDNA microarrays to screen|10 000 transcripts expressed in the cerebral cortex of rats after 8 h of sleep, spontaneous
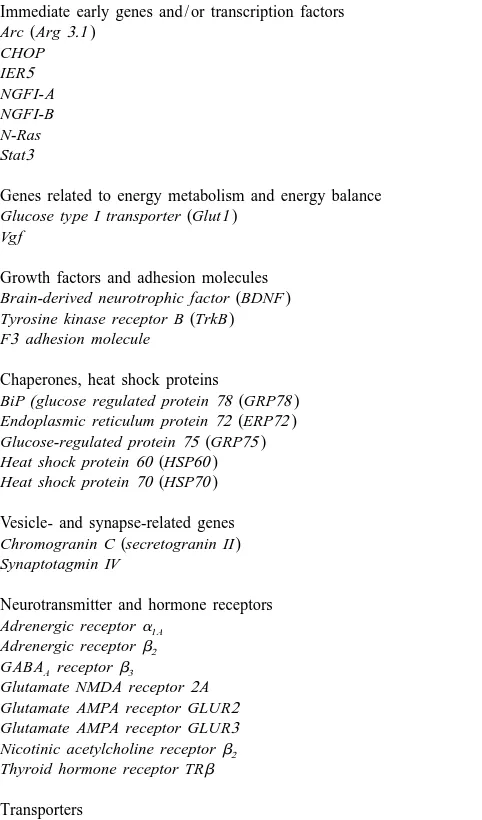
waking, or sleep deprivation. We found that 44 genes had higher mRNA levels after waking and / or sleep deprivation relative to sleep, while 10 were upregulated after sleep. Known genes that were upregulated in waking and sleep deprivation can be grouped into the following categories: immediate early genes / transcription factors (Arc, CHOP, IER5, NGFI-A, NGFI-B, N-Ras, Stat3 ), genes related to energy metabolism ( glucose type I transporter Glut1, Vgf ), growth factors / adhesion molecules (BDNF, TrkB, F3 adhesion molecule), chaperones / heat shock proteins (BiP, ERP72, GRP75, HSP60, HSP70 ), vesicle- and synapse-related genes (chromogranin C,
synaptotagmin IV ), neurotransmitter / hormone receptors (adrenergic receptora1 Aandb2, GABA receptorA b3, glutamate NMDA receptor 2A, glutamate AMPA receptor GluR2 and GluR3, nicotinic acetylcholine receptorb2, thyroid hormone receptor TRb), neurotransmitter
1 2
transporters ( glutamate /aspartate transporter GLAST, Na /Cl transporter NTT4 /Rxt1 ), enzymes (aryl sulfotransferase, c-jun
N-terminal kinase 1, serum /glucocorticoid-induced serine /threonine kinase), and a miscellaneous group (calmodulin, cyclin D2, LMO-4,
metallothionein3 ). Several other genes that were upregulated in waking and all the genes upregulated in sleep, with the exception of the one coding for membrane protein E25, did not match any known sequence. Thus, significant changes in gene expression occur across behavioral states, which are likely to affect basic cellular functions such as RNA and protein synthesis, neural plasticity, neuro-transmission, and metabolism. 2000 Elsevier Science B.V. All rights reserved.
Theme: Neural basis of behavior Topic: Biological rhythms and sleep
Keywords: Cerebral cortex; Plasticity; Rat; Sleep deprivation
1. Introduction indicating that several compounds accumulate in the brain
during short periods of spontaneous waking or sleep The functions of sleep remain obscure despite its deprivation, potentially leading to a need for restoration. ubiquitous occurrence [75] and its exquisite homeostatic For example, the neurotransmitter and metabolic by-prod-regulation [6]: in virtually all species studied so far, uct adenosine has been shown to increase in proportion to prolonged waking is followed by a compensatory increase the amount of waking in the basal forebrain region [74]. in the duration and / or the intensity of sleep [88]. Such Recent studies have provided evidence that the expression homeostatic regulation of sleep suggests that a distinct of certain genes changes as a function of behavioral state. physiological, biochemical, or molecular process may In the rat cerebral cortex, the expression of tumor necrosis build up beyond its usual level if sleep initiation is factor [94], interleukin 1 [48,86], cortistatin [19] and postponed, and that uncovering such processes may pro- BDNF [70] increases after prolonged waking or sleep
vide critical clues as to the functions of sleep. deprivation relative to sleep, while the expression of Over the past few years, evidence has been collected neurogranin and dendrin decreases after 24 h of sleep
deprivation [61,62,76]. For a few other genes, such as
tyrosine hydroxylase [4,73], growth hormone-releasing
1
Published on the World Wide Web on 30 October 2000.
hormone, somatostatin [91], and galanin [90], localized
*Corresponding author. Tel.: 11-858-626-2090; fax: 1
1-858-626-changes have been demonstrated after total or selective 2199.
E-mail address: [email protected] (G. Tononi). REM deprivation in certain hypothalamic or brainstem 0006-8993 / 00 / $ – see front matter 2000 Elsevier Science B.V. All rights reserved.
nuclei. Finally, several laboratories have shown that the cortex (4 mm posterior to the bregma and 3.8 mm lateral transition from sleep to waking is accompanied by the to the midline). After surgery, rats were housed individual-activation of the expression of immediate-early genes, such ly in sound-proofed recording cages. Lighting and tem-as c-fos and NGFI-A, in many brain regions (see Refs. perature were kept constant (LD, 12:12, light on at 10:00, [13,14,16]). The finding of a significant change in the |150 lux; 24618C, food and drink ad libitum). One week expression of these transcription factors between sleep and after surgery the rats were connected by means of a waking suggests that other ‘late’ genes, in addition to those flexible cable and a commutator (Airflyte, Bayonne, NJ) to already identified, may in turn be activated or deactivated a Grass polygraph (Quincy, MA; model 78), and recorded in relation to the behavioral state of the animal. continuously until the percentages and distributions of While targeted experiments aimed at studying specific sleep and waking were normal and within published values genes have proved very useful, it is unlikely that they will [72]. Each day from 10:00 to 10:30 the rats were allowed ever offer an exhaustive picture of the regulation of gene to play with a new object introduced into their cage to expression by sleep and waking. An alternative to candi- familiarize them with the sleep deprivation procedure. date gene approaches is the systematic investigation of all After adaptation, the rats were recorded for as many days the genes whose expression in the brain changes in relation as required to satisfy the criteria for any of three ex-to different behavioral states. As a first step in this perimental groups. Sleeping (S, n56) rats were sacrificed direction, in a recent study we used mRNA differential during the light hours (around 18:00) at the end of a long display to screen for changes in gene expression in the period of sleep (at least 45 min, interrupted by periods of cerebral cortex of rats after short periods (3 h) of sleep, waking no longer than 2 min) after spending at least 75% spontaneous waking, and sleep deprivation [12]. It was of the previous 8 h asleep. Sleep deprived (SD, n56) rats found that several immediate early genes, as well as were sacrificed during the light period (around 18:00) after mitochondrial genes encoded by the mitochondrial 8 h of total sleep deprivation. SD rats were kept awake by genome, are differentially expressed across the sleep– introducing new objects into the cage and later by moving
waking cycle. them to a new cage, by tapping on the cage, and exposing
The present paper continues and extends previous work, them to new odors. Each stimulus was delivered whenever with the goal of systematically establishing the differences a slowing of the EEG was noted. Spontaneously awake in gene expression that occur between sleep and waking. (W, n55) rats were sacrificed during the dark phase To this end, we analyzed the expression of|10 000 genes (around 6:00) after a long period of continuous waking (1 in the cerebral cortex of rats after sustained periods (8 h) h, interrupted by periods of sleep not longer than 4 min), of sleep, spontaneous waking, and sleep deprivation. We and after spending at least 75% of the previous 8 h awake. have used two complementary approaches: mRNA dif- Animal care was in accordance with institutional guide-ferential display, which allowed us an unbiased screen for lines, and the experiments were conducted under protocols random mRNAs without prior assumptions as to which approved by The Neurosciences Institute.
transcripts might change, and cDNA microarray
technolo-gy, which allowed us to screen 1176 known mRNAs, most 2.2. Tissue and RNA preparation of which are specifically expressed in the rat brain. We
focused on the cerebral cortex as it appears to be the Rats were deeply anesthetized with isoflurane (within 2 structure most significantly affected by sleep deprivation in min) and decapitated. The head was cooled in liquid humans [34] and is the main target of the restorative nitrogen and the whole brain was removed. The right effects of sleep according to several influential hypotheses cerebral cortex and hippocampus were dissected, while the about the functions and the local mechanisms of sleep rest of the brain was left intact for in situ hybridization
[41,50]. experiments. Samples were immediately frozen on dry ice
and stored at2808C. A few additional S, SD and W rats were used only for in situ hybridization experiments. In 2. Materials and methods these cases, the brain was frozen without dissection. Total RNA was isolated from the right cerebral cortex of each
2.1. Recordings animal by using Trizol (Gibco-BRL, Gaithersburg, MD)
according to the manufacturer’s instructions. Final RNA Male Wistar WKY rats (Charles River, 300–350 g) were concentrations were determined spectrophotometrically. anesthetized with pentobarbital (65–75 mg / kg) and
im-planted with stainless steel, round-tipped miniature screw 2.3. mRNA differential display electrodes in the skull to record the electroencephalogram
anchor primers used for the reverse transcription and one Based on pilot experiments, a difference was considered of 35 E2-AP 59 arbitrary primers, where E25 eligible for further confirmation if the ratio was .1.3 or CGTGAATTCG and AP is a sequence of 10 bp with a ,0.7 and the absolute difference .30 (as measured by the presence of 50% G1C and A1T and an absence of phosphorimager in arbitrary signal intensity units) in at uninterrupted self-complementarity of more than two least two out of three hybridization experiments. Specific nucleotides. PCR conditions and specific primers for c-fos, primers (Clontech) were used to amplify each cDNA of
NGFI-A, cytochrome c oxidase subunit IV mRNAs were as interest from rat cerebral cortex. PCR products were
in Ref. [12]. Radiolabeled PCR products were separated on subcloned into pCREII vectors and partially sequenced to 6% denaturating polyacrylamide gels (Genomyx, Foster verify their identity.
City, CA) and visualized by autoradiography. Individual
animals were not pooled but run in parallel, and PCR 2.5. Ribonuclease protection assays (RPA), quantitative reactions were performed in duplicate for each animal. PCR, in situ hybridization
Differentially expressed bands were quantified with a
phosphorimager (Molecular Dynamics, Sunnivale, CA) by For RPA, antisense RNA probes were synthesized by measuring the average volume of each band for each lane run-off transcription from a linearized DNA template using and subtracting the background. The mean density within the MAXIscript in vitro transcription kit (Ambion, Austin,
32
and among conditions was calculated and significant TX) and [a- P]UTP (New England Nuclear–Du Pont). differences among conditions were evaluated by ANOVA RPA was performed using the RPAIIIE kit (Ambion). followed by Bonferroni correction. Differentially ex- DNAse I-digested total RNA from the right cerebral cortex
32
pressed bands were recovered from dried gels, reamplified was hybridized with an excess of [a- P]UTP-labeled by PCR using the same primers and subcloned into riboprobe. To normalize the amount of sample RNA, a pCREII vectors using the TA cloning kit (Invitrogen, San b-actin riboprobe was used to measureb-actin mRNA. Diego, CA). Plasmid DNA sequencing of cloned cDNAs For real time quantitative PCR, reverse transcription was carried out using the Cy5E AutoRead sequencing kit reactions were carried out in parallel on DNAse I-digested (Pharmacia Biotech, Sweden). Sequences were screened pooled total RNA from S, SD, and W rats. Prior to reverse using the BLAST program and the EMBL and GenBank transcription, total RNA was confirmed to be free of
databases. contaminating DNA sequences by PCR using rat b-actin
specific primer pairs designed to differentiate between
2.4. cDNA microarray cDNA, genomic DNA, and pseudogene genomic DNA.
Eight reverse transcription reactions were done for each Total RNA from the right cerebral cortex of the same experimental group (S, SD, and W), for a total of 24 animals used for mRNA differential display was pooled reactions. Reverse transcription reactions were as follows: from all the rats within each experimental group (S, SD, 100 ng total RNA, 2.5 ml oligo dT16 (500 mg / ml), 5 ml
32
W; 2 mg / pool), converted into P-labeled first-strand dNTPmix (10 mM each dNTP), 1 pg artificial transcript cDNA, and used to hybridize to rat cDNA microarrays (rat (IDT, Coralville, IA), H O to 29.752 ml. Samples were Atlas cDNA array 1.0 and 1.2, Clontech, Palo Alto, CA). incubated at 708C for 10 min, put briefly on ice, and then Each membrane was prehybridized for 1 h at 718C in 10 incubated at 428C for 2–5 min. Mix [2 (10 ml 53
ml of hybridization solution (ExpressHyb, Clontech) with Superscript II First Strand Buffer, 5 ml 0.1 M DTT, 4ml 2 continuous agitation. Hybridization with radiolabeled 25 mM MgCl2 and 1.25 ml Superscript II RNAse H
6
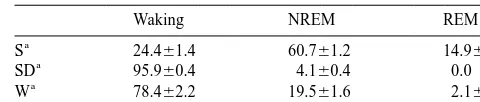
Table 1 of pooled reverse transcription product and H O to a total2
Percentages of waking, non-rapid eye movement (NREM) sleep and rapid volume of 25ml. A two-step PCR profile was used: 10 min
eye movement (REM) sleep for the last 8 recording hours before sacrifice at 958C denaturation and Amplitaq gold activation, fol- in the three groups of rats
lowed by 40 cycles alternating between 958C for 15 s and
Waking NREM REM
608C for 60 s. Dilution series (1:2, 1:10, 1:50, 1:100)
a
S 24.461.4 60.761.2 14.960.7
standard curves were performed in triplicate for each a
SD 95.960.4 4.160.4 0.0
primer pair using reverse transcription products from a
W 78.462.2 19.561.6 2.160.7
generic rat brain total RNA. PCR was done in
quintupli-a
S, rats sacrificed after spontaneous sleep during the light period (n56); cate for each sample condition assayed and relative
SD, rats sacrificed after being sleep deprived during the light period quantities determined based on the equation of the line of (n56); W, rats sacrificed after spontaneous waking during the dark period
2
best fit derived from the standard curve (R . 50.99). (n55). Values are expressed as percentages of the recording time In situ hybridization was performed on frontal sections (mean6S.E.M.).
as in Ref. [11] using the same antisense RNA probes used for RPA. Pretreatment of tissue sections with RNAse
eliminated true hybridization signals. Hybridization with without causing substantial stress, while REM sleep was sense RNA probes showed no specific hybridization signal. completely suppressed.
Slides were scanned with a phosphorimager (Molecular Dynamics) and then exposed to Biomax film (Eastman
Kodak, New Haven, CT). The riboprobe used to detect 3.2. mRNA differential display
F1-ATPase subunit a mRNA was the same as in Ref.
[12]. RPA and in situ hybridization signals were quantified The primary mRNA differential display screening used densitometrically with a phosphorimager as in Ref. [12]. 105 primer combinations. Thirty-two bands were identified by visual inspection as differentially expressed between sleep, sleep deprivation, and waking. Of these, 22 were
3. Results higher in sleep deprivation and waking than in sleep and
10 were higher in sleep. All bands were excised from the
3.1. Sleep percentages gel, reamplified, cloned, and sequenced. Partial DNA
sequence analysis revealed flanking sites complementary to Rats kept in a 12:12 light / dark cycle are asleep for most the PCR primers in all cases. All species were 200–700 bp of the light period and awake for most of the dark period. in size.
We selected rats that had been asleep for the first 8 h of the The 22 bands with higher expression levels in sponta-light period, rats that had been spontaneously awake for neous waking and / or sleep deprivation relative to sleep the first 8 h of the dark period, and rats that had been sleep corresponded to 19 genes, of which 10 were identified rat deprived during the light period for 8 h (see Section 2.1 for genes (aryl sulfotransferase, BDNF, BiP, bone mor-details). The three experimental conditions were chosen to phogenic protein2, CHOP, GRP75, IER5, metallothionein distinguish between changes in gene expression related to 3, NGFI-A, synaptotagmin IV ). BiP was isolated using sleep and waking per se and changes related to circadian three different sets of primers. Another transcript was time or to the sleep deprivation procedure (Fig. 1). Table 1 found to be the rat homologue of the mouse gene LMO-4 shows percentages of waking, non-REM sleep, and REM [40,85]. The other eight transcripts with higher expression sleep during the final 8 recording hours prior to sacrifice levels in spontaneous waking and / or sleep deprivation for the three experimental groups of rats. The values for relative to sleep could not be assigned to any previously spontaneous waking and sleep are in agreement with reported gene. Among the 10 transcripts with higher baseline standard values (see, e.g., Refs. [12,72]). In sleep- expression in sleep relative to spontaneous waking and deprived rats, short episodes (,30 s) of NREM sleep sleep deprivation, one corresponded to the gene encoding could not be avoided in the last 2–3 h of the deprivation the membrane protein E25 [20], while the other nine had
no matches in the public sequence databases.
Confirmation of the results obtained with mRNA dif-ferential display was performed for each difdif-ferentially expressed cDNA by using RPA and / or real time quantita-tive PCR. In situ hybridization experiments were also carried out to study the regional distribution of the transcripts. With the exception of bone morphogenic
protein 2, all results obtained with mRNA differential display were confirmed. Examples of the differential Fig. 1. Schematic drawing showing the experimental conditions chosen
expression of IER5, BiP, and aryl sulfotransferase are to distinguish changes associated with sleep, spontaneous waking,
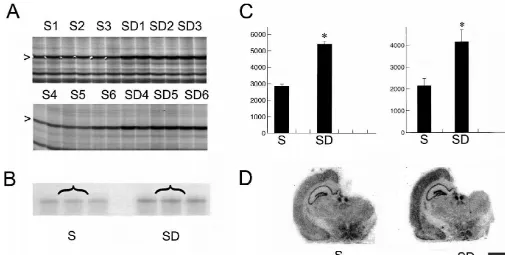
Fig. 2. Differential expression of IER5. (A) mRNA differential display. A band corresponding to IER5 mRNA (arrowhead) is expressed at higher levels in the cerebral cortex of rats that were sleep deprived for 8 h (SD1–SD6) than in the cerebral cortex of rats that were asleep for 8 h (S1–S6). Pairs 1–3 and 4–6 of S and SD rats were run in different gels. The figure only shows a portion of these gels. (C, left panel) Densitometric analysis performed by scanning the two gels with a phosphorimager (*P,0.01, ANOVA). (B) An RPA experiment in which an equal amount of pooled total RNA from the cerebral cortex of S and SD rats was hybridized with a riboprobe specific for IER5. (C, right panel) Densitometric analysis performed by scanning the RPA gel with a phosphorimager (*P,0.01, ANOVA). (D) In situ hybridization experiments show IER5 mRNA levels in the cerebral cortex after 8 h of sleep and sleep deprivation. Scale bar5500mm.
3.3. cDNA microarrays a1 A and b2 subunits, GABA receptorA b3 subunit,
gluta-mate NMDA receptor 2A subunit, glutamate AMPA
re-The rat cDNA microarrays used for this study contain ceptor GluR2 and GluR3 subunits, nicotinic acetylcholine 1176 cDNAs representing transcription factors, intracellu- receptor b2, thyroid hormone receptor TRb), neurotrans-lar signal transduction modulators, receptors for neuro- mitter transporters ( glutamate /aspartate transporter
1 2
transmitters and growth factors, genes involved in apop- GLAST, Na /Cl transporter NTT4 /Rxt1 ), enzymes (c-tosis, metabolism, protein turnover, and cell–cell com- jun N-terminal kinase 1, serum /glucocorticoid-induced munication. In agreement with the results obtained with serine /threonine kinase), and other genes (calmodulin,
mRNA differential display, the great majority of genes cyclin D2 ). The differential expression of these genes was were expressed at the same level after 8 h of sleep, sleep confirmed in all cases using RPA and / or real time quan-deprivation and spontaneous waking. However, several titative PCR, and in situ hybridization experiments were genes were found to be upregulated in spontaneous waking performed to study the regional distribution of the tran-and / or sleep deprivation relative to sleep, while no gene scripts (e.g., Fig. 5).
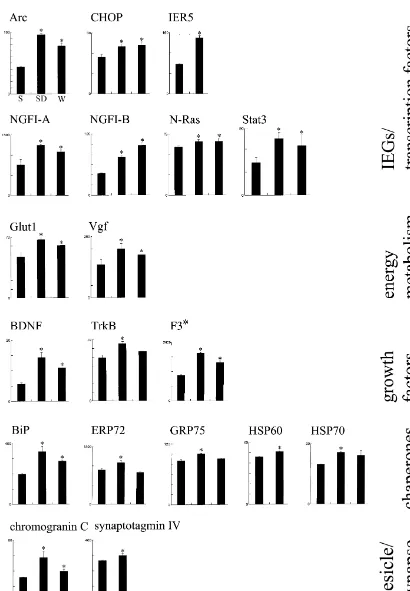
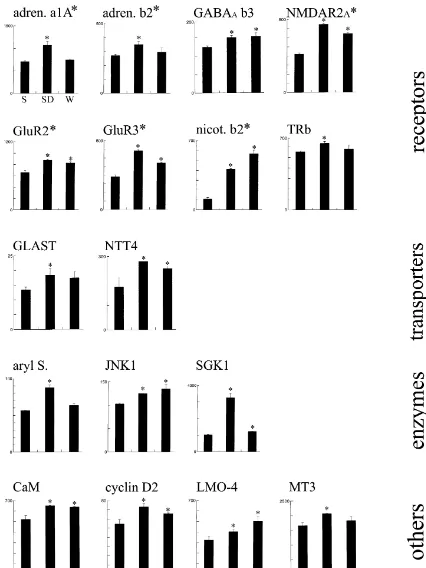
was found to be upregulated in sleep relative to sponta- Table 2 summarizes all the known transcripts that were neous waking and / or sleep deprivation. found to be upregulated after 8 h of spontaneous waking The genes whose expression was increased during and / or sleep deprivation relative to 8 h of sleep using spontaneous waking and / or sleep deprivation could be either mRNA differential display or cDNA microarray grouped into the following categories: immediate early technology and whose differential expression was indepen-genes / transcription factors (Arc, CHOP, NGFI-A, NGFI-B, dently confirmed with other techniques. Fig. 6 shows the
N-Ras, Stat3 ), genes related to energy metabolism and differential expression of these transcripts as measured by energy balance ( glucose type I transporter Glut1, Vgf ), RPA or real time quantitative PCR. In most cases, the growth factors / adhesion molecules (TrkB, F3 adhesion increase in mRNA levels relative to sleep was more
molecule), chaperones / heat shock proteins (BiP, ERP72, marked after sleep deprivation than after spontaneous
GRP75, HSP60, HSP70 ), vesicle- and synapse-related waking. In a subset of cases (Stat3, ERP72, GRP75, genes (chromogranin C, synaptotagmin IV ), genes for HSP70, adrenergic receptor a1 A and b2 subunits, thyroid
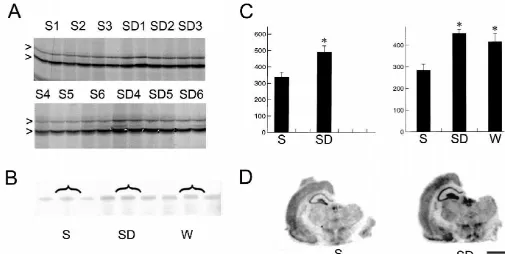
Fig. 3. Differential expression of BiP. (A) mRNA differential display. Two bands corresponding to BiP mRNA (arrowheads) are expressed at higher levels in the cerebral cortex of rats that were sleep deprived for 8 h (SD1–SD6) than in the cerebral cortex of rats that were asleep for 8 h (S1–S6). Pairs 1–3 and 4–6 of S and SD rats were run in different gels. The figure only shows a portion of these gels. (C, left panel) Densitometric analysis performed by scanning the two gels with a phosphorimager (*P,0.01, ANOVA). (B) An RPA experiment in which an equal amount of pooled total RNA from the cerebral cortex of S, SD, and W rats was hybridized with a riboprobe specific for BiP. (C, right panel) Densitometric analysis performed by scanning the RPA gel with a phosphorimager (*P,0.01, ANOVA; comparison between S and SD and between S and W). (D) In situ hybridization experiments show BiP cortical mRNA levels after 8 h of sleep and sleep deprivation. Scale bar5500mm.
MT3 ), only sleep deprived but not spontaneously awake their expression after 8 h of spontaneous waking and / or rats showed significantly higher mRNA levels relative to sleep deprivation relative to sleep.
sleep.
4. Discussion 3.4. Expression of transcripts upregulated after 3 h of
waking 4.1. General findings
Our previous study [12] found two main groups of The present study provides a comprehensive evaluation known genes to be upregulated after 3 h of spontaneous of changes in gene expression in the cerebral cortex as a waking and sleep deprivation relative to sleep: immediate function of behavioral state. The results obtained after early genes / transcription factors (including c-fos and sustained periods of sleep, sleep deprivation, and
sponta-NGFI-A) and mitochondrial genes encoded by the mito- neous waking (8 h) complement and extend previous
chondrial genome (cytochrome oxidase subunit I, NADH findings from a screening of gene expression after shorter
dehydrogenase subunit2 and 12S rRNA). periods of sleep and waking (3 h [12–14]). Several general
In this study, mRNA differential display showed conclusions can be drawn from these experiments. First, changes in the expression of NGFI-A after 8 h of sponta- only a small minority of the genes screened change their neous waking and sleep deprivation relative to sleep, but expression after both short and long periods of physiologi-not in the expression of c-fos, nor in the expression of cal sleep or waking. A previous study that examined
cytochrome oxidase subunit I, NADH dehydrogenase changes in gene expression after 24 h of sleep deprivation
subunit 2 and 12S rRNA. RPA (Fig. 7) and in situ by subtractive cDNA cloning reached similar conclusions:
hybridization confirmed that RNA levels of the three of the 4000 clones screened, only 10 transcripts were mitochondrial transcripts were similar after 8 h of sleep, found to be differentially expressed in the rat forebrain spontaneous waking, and sleep deprivation. Cytochrome [76]. Screening studies employing less physiological
Fig. 4. Differential expression of aryl sulfotransferase. (A) mRNA differential display. A band corresponding to aryl sulfotransferase mRNA (arrowhead) is expressed at higher levels in the cerebral cortex of sleep deprived rats (SD1–SD6) than in sleeping rats (S1–S6). Pairs 1–3 and 4–6 of S and SD rats were run in different gels. The figure only shows a portion of these gels. (C, left panel) Densitometric analysis performed by scanning the two gels with a phosphorimager. The difference in signal intensity between S and SD rats was statistically significant (*P,0.01, ANOVA). (B) An RPA experiment in which an equal amount of pooled total RNA from the cerebral cortex of S, SD, and W rats was hybridized with a riboprobe specific for aryl sulfotransferase. (C, right panel) Densitometric analysis performed by scanning the RPA gel with a phosphorimager (*P,0.01, ANOVA; comparison between S and SD and between S and W). (D). In situ hybridization experiments show aryl sulfotransferase mRNA levels after 8 h of sleep and sleep deprivation. Scale bar5500mm.
dentate gyrus a few hours after systemic application of experimental conditions is due to mRNA stabilization, kainate (e.g., Ref. [31]). However, most of the ‘activity- rather than to an increased transcription rate [5].
regulated’ genes identified after seizures or electroconvul- A third observation is that only a minority of the genes sive shock have not been isolated under the milder that are upregulated in spontaneous waking and / or sleep stimulation conditions used for LTP [53]. deprivation but almost all the genes that are upregulated in A second observation is that the majority of differential- sleep do not match any known sequence. This asymmetry ly expressed genes are upregulated in spontaneous waking may be explained in part by the fact that differential and / or sleep deprivation rather than in sleep. Whether this cloning techniques have generally been used to identify finding indicates that waking is more conducive than sleep genes that are rapidly induced by depolarizing stimuli, to the activation of gene transcription remains to be pharmacological agents, or pathological conditions, but not determined. In this context, it is relevant that the induction by conditions that more closely resemble physiological of at least some of the genes that are expressed at higher sleep, such as, for example, anesthesia. The characteriza-levels during waking is controlled by the noradrenergic tion of the transcripts that are upregulated in sleep is in system of the locus coeruleus, a system that fires at higher progress and will be the subject of a future publication. rates during waking than during sleep [1]. Specifically, the A final observation is that, while most genes upregulated noradrenergic system is responsible for the increased by sleep deprivation were also upregulated by spontaneous expression during waking of c-fos, NGFI-A, P-CREB [9], waking, the increase in mRNA levels was generally more
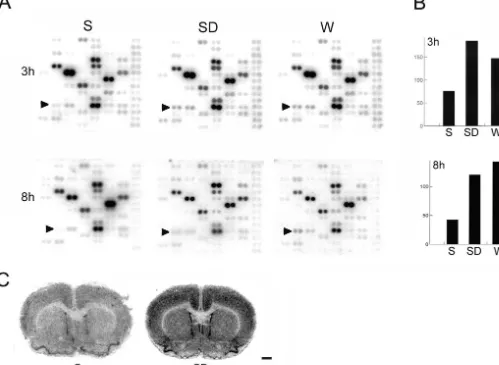
Fig. 5. Differential expression of NGFI-B. (A) Rat cDNA microarray. NGFI-B mRNA levels (arrowhead) are higher in the cerebral cortex after 3 or 8 h of either sleep deprivation (SD) or spontaneous waking (W) than after 3 or 8 h of spontaneous sleep (S). The figure only shows a portion of the cDNA microarray. Signal quantification using a phosphorimager is shown in (B). In situ hybridization experiments show NGFI-B mRNA levels after 8 h of sleep and sleep deprivation. Scale bar51 mm.
rats sacrificed after 8 h of spontaneous waking starting ‘late’ genes, which are induced after the immediate early from light off were mostly asleep during the previous light genes, and which are therefore more likely to be isolated
period. after 8 h rather than 3 h of sleep deprivation or waking.
cells can be diluted when screening a brain region as a IER5
whole. Interestingly, two of the 10 genes identified in the NGFI-A
NGFI-B hippocampus after LTP by Matsuo et al. [53] were CHOP
N-Ras and IER5, which we also found to be upregulated in the
Stat3
cerebral cortex after spontaneous waking and sleep depri-vation.
Genes related to energy metabolism and energy balance Glucose type I transporter (Glut1 )
Vgf 4.2. Immediate early genes /transcription factors
Growth factors and adhesion molecules
Immediate early genes are so called because their Brain-derived neurotrophic factor (BDNF )
transcription is induced in response to a stimulus without Tyrosine kinase receptor B (TrkB )
the need for de novo protein synthesis. Previous studies F3 adhesion molecule
found that the expression of c-fos, NGFI-A, NGFI-B, Jun Chaperones, heat shock proteins B and rfl is higher after 3–6 h of spontaneous waking and BiP(glucose regulated protein 78 (GRP78 )
sleep deprivation relative to 3–6 h of sleep (see Refs. Endoplasmic reticulum protein72 (ERP72 )
[12–14,16] for references). c-Fos induction typically oc-Glucose-regulated protein75 (GRP75 )
curs when a new stimulus is applied, while NGFI-A Heat shock protein60 (HSP60 )
Heat shock protein70 (HSP70 ) induction persists throughout the duration of the stimula-tion (see, e.g., Ref. [38]). In agreement with this evidence, Vesicle- and synapse-related genes
c-fos mRNA levels are increased after 3 h of waking but
Chromogranin C (secretogranin II )
revert to the levels observed during sleep after 8 h of Synaptotagmin IV
waking (a detailed discussion of the significance of c-fos Neurotransmitter and hormone receptors induction during waking can be found in Ref. [16]. By
Adrenergic receptora1 A contrast, NGFI-A mRNA levels, which increase after 3 h
Adrenergic receptorb2 of waking, remain elevated after 8 h of spontaneous
GABA receptorA b3
waking or sleep deprivation. A similar time course is Glutamate NMDA receptor2A
observed for NGFI-B (Fig. 5) and Arc (Cirelli and Tononi, Glutamate AMPA receptor GLUR2
Glutamate AMPA receptor GLUR3 submitted). IER5, which belongs to a group of immediate
Nicotinic acetylcholine receptorb2 early genes that are induced with slower kinetics than c-fos
Thyroid hormone receptor TRb
[100], was found to increase after 8 but not after 3 h of sleep deprivation.
Transporters
In contrast to c-fos and jun B, c-jun mRNA and protein Glutamate /aspartate transporter (GLAST )
1 2
Na /Cl -dependent neurotransmitter transporter (NTT4 /Rxt1 ) levels are not upregulated by membrane depolarization in vitro, nor by increases in electrical activity (e.g., seizures) Enzymes
in vivo (see Ref. [16] for references). It is not surprising, Aryl sulfotransferase
therefore, that c-jun expression did not change in the brain c-Jun N-terminal kinase1 (JNK1 )
after sleep deprivation [16]. However, for its transcription Serum /glucocorticoid-induced serine /threonine kinase (SGK1 )
regulating activity c-jun needs to be phosphorylated by
Other genes c-Jun N-terminal kinases (JNK 1, 2, and 3), and JNK
Calmodulin
activity increases in the brain after seizures, restraint stress, Cyclin D2 (Vin-1 )
and exposure to a novel environment [8,102]. We show LMO-4
here that the mRNA levels of JNK 1 are increased in Metallothionein3
a spontaneous waking and sleep deprivation relative to sleep.
Genes were identified using mRNA differential display and cDNA
As a next step, it will be necessary to determine whether microarray technology and differential expression was confirmed using
ribonuclease protection assay and / or real-time quantitative PCR. the increase in mRNA levels is also associated with an increase in JNK protein levels and in JNK enzymatic activity during waking. If this were the case, the ability of our study. A recent comprehensive mRNA differential c-jun to activate gene transcription could be strongly
display screening designed to identify long term potentia- potentiated during waking relative to sleep even in the tion (LTP)-related genes isolated 10 differentially ex- absence of an increase in c-Jun protein levels.
Fig. 6. (continued )
protein), N-Ras (a proto-oncogene encoding a GTPase) and to specific DNA sequences. Another gene that seems to be
IER5 (whose function is still unclear), all immediate early involved in the control of transcription, and whose expres-genes whose mRNA levels increase during spontaneous sion is upregulated in spontaneous waking and sleep waking and / or sleep deprivation (c-fos, NGFI-A, NGFI-B, deprivation, is LMO-4. LMO proteins are a family of
Fig. 7. RPA experiments showing similar cortical mRNA levels ofb-actin, cytochrome c oxidase subunit I, and cytochrome c oxidase subunit IV in rats spontaneously asleep (S) or sleep deprived (SD) for 8 h. Total RNA from six S and six SD rats was pooled and run in triplicate. Theb-actin antisense riboprobe was used to normalize the amount of sample RNA on each gel. The gel was exposed for 1 day for cytochrome c oxidase subunit IV and for 5 days forb-actin. Cytochrome c oxidase subunit I was run on a different gel and exposed for 1 day (b-actin not shown). Lane 1 (from left) shows molecular weight markers.
LMO-4 is highly expressed in the cerebral cortex [30] and ment with this hypothesis, we have recently found that the the expression of LMO-1, 2, and 3 is regulated by seizure levels of the phosphorylated form of cAMP responsive activity [32]. To our knowledge, the finding that LMO-4 element binding protein (P-CREB) are higher in the mRNA levels are increased during spontaneous waking cerebral cortex of awake rats than in sleeping rats (Cirelli and sleep deprivation relative to sleep is the first demon- and Tononi, submitted). P-CREB has been tied to the stration that the expression of this new member of the occurrence of plastic changes in several animal models LMO family is regulated by neuronal activity. In a [81].
previous study we found that another transcript that is
upregulated after 3 h of spontaneous waking and sleep 4.3. Genes related to energy metabolism and energy deprivation relative to sleep is similar to the human balance
homologue of SNF2 / SWI2, a global activator of
transcrip-tion in yeast [13,14]. Thus, the inductranscrip-tion of transcriptranscrip-tion mRNA levels of the glucose transporter Glut1 were factors, the upregulation of LMO-4, and the increased found to increase by 30–40% during spontaneous waking levels of the transcript related to SNF2 / SWI2, suggest that and sleep deprivation relative to sleep. Brain metabolism is waking may promote the transcriptional activation of a 15–20% higher in waking than in sleep and the brain relies select group of ‘target’ genes. almost exclusively on glucose as its energy substrate.
Arc [43,47] is unique among activity-regulated genes in Glucose is transported from blood to neurons and glia by that, after induction, its mRNA is selectively transported to facilitative glucose transporters, six of which have been activated postsynaptic sites, where it may play a role in identified in the brain (see Ref. [21] for references). The activity-dependent synaptic plasticity requiring protein predominant forms are Glut1 (in the brain capillary synthesis [84]. Arc expression has been shown to be endothelium and in the perivascular endfeet of astrocytes) important for the formation of long-term memories in the and Glut3 (in neurons). Increases or decreases in Glut1 hippocampus [27]. In addition to Arc, several other genes expression correlate with increases or decreases in cerebral whose mRNA levels where found to be higher in sponta- glucose utilization, respectively (e.g., Ref. [22]). Glut1 neous waking and sleep deprivation relative to sleep have mRNA and / or protein levels increase in response to kainic
1
been implicated in neural plasticity. They include NGFI-A, acid-induced seizure, K -induced depolarization, and which has already been mentioned, and other genes that chronic administration of nicotine [21] and decrease in will be discussed later, such as BiP, synaptotagmin IV, visual brain areas after chronic visual deprivation [22].
chromogranin C, BDNF, and its receptor TrkB. Thus, it Thus, Glut1 induction may represent a mechanism by
waking can deplete brain extracellular glucose and may cally, by visual and osmotic stimuli. BDNF is considered a trigger compensatory mechanisms. good candidate as modulator of activity-dependent plastici-Cerebral glucose is almost exclusively metabolized ty because: (1) its expression is strongly modulated by through mitochondrial oxidative phosphorylation. In our neuronal activity (at both mRNA and protein levels); (2) it previous gene expression screening, we found that, in has potent effects on synaptic transmission and signaling many cortical and subcortical regions, RNA levels of three properties of neurons; (3) it is able to alter dendritic mitochondrial genes encoded by the mitochondrial genome morphology (reviewed in Ref. [54]). Electrical or pharma-— subunit I of cytochrome c oxidase (CO ), subunit 2 of cological stimulation also increase TrkB mRNA and
NADH, and12S rRNA — were uniformly higher after 3 h protein levels and TrkB, together with BDNF, plays an
of waking than after 3 h of sleep, while the expression of essential role in hippocampus-mediated learning [57]. the nuclear-coded CO subunit IV and F1-ATPase subunita mRNA levels of F3 / contactin were also higher in sponta-did not change. In the present study, we found that none of neous waking and sleep deprivation relative to sleep. these genes was upregulated after 8 h of spontaneous F3 / contactin is a cell adhesion molecule specifically waking or sleep deprivation. Thus, there is no upregulation expressed in the brain. It can be anchored to the cell of nuclear-encoded mitochondrial transcripts after either membrane of neurons or be present in a soluble form. By short (3 h) or sustained (8 h) periods of waking. On the binding to different ligands such as other adhesion mole-other hand, mitochondrial-encoded transcripts are upregu- cules and extracellular matrix molecules, F3 can act either lated shortly after the transition between sleep and waking, as a neuronal receptor or as a substrate for neurite growth. but the response is transient and does not persist after During development, F3 expression can control neurite sustained periods of waking. In agreement with this growth and can be upregulated with synaptic contact conclusion, mRNA levels of NADH dehydrogenase formation [96]. In the adult, activity-dependent changes in
subunit 2 were found to be similar in rats sleep-deprived F3 expression have been described in the magnocellular for 24 h with respect to their controls [76]. It has recently nuclei of the hypothalamus, where F3 colocalizes with been shown that mitochondria contain an excess of nu- vasopressin and oxytocin in neurosecretory granules [87]. clear-encoded CO subunits, and that it is the synthesis of The fact that F3 mRNA levels are increased during the mitochondrial-encoded subunits, followed by the CO spontaneous waking and sleep deprivation could be holoenzyme assembly, that is controlled by local changes another indication that synaptic plastic changes are occur-in energy demands [101]. This foccur-indoccur-ing suggests that the ring during these behavioral states rather than during sleep. increased amount of CO holoenzyme assembled shortly
after the onset of waking as a result of the rapid upregula- 4.5. Molecular chaperones tion of mitochondrial-encoded transcripts may be sufficient
to sustain the energy demand of a prolonged period of Molecular chaperones facilitate the folding of most
waking. newly synthesized proteins in the cell [25]. The major
Another gene whose mRNA levels were increased in families of general chaperones are HSP40, HSP60, HSP70 spontaneous waking and sleep deprivation relative to sleep (which includes Bip and Grp75 ), and HSP90. In this corresponds to Vgf. Vgf is a neuropeptide amply expressed study, the largest increase in expression after spontaneous in the developing and adult brain, particularly in hypo- waking and sleep deprivation relative to sleep was shown thalamus and cerebral cortex, where it is localized in by BiP, while the induction of the two mitochondrial synaptic large dense core vesicles and is released through chaperones Hsp60 and Grp75 was less marked.
regulated pathways. Vgf expression is rapidly induced by BiP is constitutively expressed at high levels in the growth factors, cAMP, neuronal activity, seizures, and endoplasmic reticulum (ER), where it assists in the folding lesions [46,59,82]. Recently, Vgf has been implicated in and assembly of newly synthesized glycoproteins and the regulation of energy balance because its expression is secretory polypeptides. Increases in mRNA and / or protein upregulated in the hypothalamus during fasting and knock- levels of BiP have been classically described after heat out mice lacking Vgf are hypermetabolic and hyperactive shock and ischemia, which cause accumulation of unfolded
[28]. proteins in the ER. In these abnormal conditions BiP may
either target unfolded protein for degradation or participate
4.4. BDNF, TrkB, and F3 in their refolding. BiP is also induced by other conditions
that adversely affect ER function, such as anoxia, glucose Our results indicate that mRNA levels of BDNF are deprivation (BiP is also called glucose-regulated protein
21
during status epilepticus [44] and after axotomy [58] and thought to be released upon depolarization and are sensi-its induction may impart cellular tolerance to environmen- tive to changes in neuronal activity. mRNA levels of both tal stress (e.g., Ref. [45]). chromogranin B and C increase in acutely and chronically The increase in BiP mRNA levels observed after 8 h of stimulated neurons, e.g., after kainic acid-induced seizures spontaneous waking and sleep deprivation suggests that and cortical spreading depression [78]. We found that this gene can be induced in normal cells in the absence of spontaneous waking and sleep deprivation increase cortical any obvious stress factor such as glucose deprivation or mRNA levels of chromogranin C (also called secretogranin hypoxia. Such physiological, waking-related increase is all II) and synaptotagmin IV. Chromogranin B cDNA was not the more interesting in view of the recent demonstration represented in the microarrays.
that an upregulation of BiP also occurs in the brain of Synaptotagmin IV is an abundant membrane protein that
Drosophila, where BiP mRNA levels are significantly is localized to synaptic vesicles. Both mRNA [95] and
higher after periods of waking and sleep deprivation protein levels [23] of synaptotagmin IV increase a few relative to comparable periods of sleep-like behavior [77]. hours after potassium depolarization or kainic acid-induced The events responsible for BiP induction during waking seizures. In cultured neurons, synaptotagmin IV is present are unclear at the moment. An increase in protein syn- in the Golgi apparatus and in distal parts of growing thesis, notably of proteins that require assembly in the ER, neurites, where its expression increases in response to could play a role. The Aplysia homologue of BiP, which is membrane depolarization [36]. Because of its activity-induced after long-term sensitization training, may be dependent expression and its subcellular localization, instrumental in the folding of newly synthesized proteins synaptotagmin IV has been considered by some as a involved in synaptic plasticity [42]. Interestingly, prelimin- marker of synaptic plasticity. The upregulation of com-ary results in our laboratory show that cortical BiP mRNA ponents of the synaptic transmission machinery following levels in awake rats are significantly decreased after lesion sleep deprivation may represent a compensatory response of the noradrenergic system of the locus coeruleus [10], a to increased levels of neurotransmission during these neuromodulatory system that can gate the triggering of behavioral states.
plastic changes [9]. Another possibility is that BiP
induc-21
tion during waking is triggered by a depletion of Ca in 4.7. Neurotransmitter and hormone receptors the ER. Although there is no direct evidence that waking
21
causes Ca depletion, the finding that prolonged REM The mRNA levels of several receptor subunits of sleep deprivation is associated, in most brain areas, with a neurotransmitters and neuromodulators were found to be
21
decrease in synaptosomal Ca , is at least consistent with increased in spontaneous waking and / or sleep deprivation
this hypothesis [49]. relative to sleep. They include the genes for the adrenergic
In addition to triggering the expression of BiP, con- receptora1Aandb2subunits, GABA receptorA b3subunit, ditions that perturb ER function and protein folding cause glutamate NMDA receptor 2A subunit, glutamate AMPA the induction of the transcription factor CHOP (C / EBP receptor GluR2 and GluR3 subunits, nicotinic acetylcho-homologous protein 10, also called gadd153; [97]) and of line receptor b2, and thyroid hormone T3 receptor b. the ER protein 72 (e.g., Ref. [69]). Both genes were found Little is known about changes in adrenergic receptor in this study to be upregulated during spontaneous waking mRNA levels in different experimental conditions, except and / or sleep deprivation. that cortical spreading depression increases a1B (but not Metallothioneins (MT) are intracellular zinc-binding a1A orb2) adrenoceptor mRNA levels [79]. Noradrenergic proteins whose primary function remains unclear [93]. neurons, which fire during waking in response to salient MT1 and MT2 are found in all organs and are induced by events, markedly decrease their firing rate or cease firing glucocorticoids, cytokines, and metal ions. MT1 and MT2 altogether during sleep [1]. It has been hypothesized that seem to be important for zinc uptake, distribution, storage, such changes in locus coeruleus firing during the sleep– and release. They have been suggested to function as waking cycle should be accompanied by a homeostatic chaperones for the synthesis of metalloproteins [93]. MT3, regulation of the sensitivity and / or the number of adren-on the other hand, which is upregulated in sleep depriva- ergic receptors [80]. Irrespective of the specific predictions tion relative to sleep, is unresponsive to most inducers of of this hypothesis, the finding of a modulation in the MT1 and MT2 [67] and might have a function distinct expression ofa1A andb2 adrenoceptors by sleep
depriva-from MT1 and MT2. tion could indeed be due to the concurrent changes in the
activity of the locus coeruleus, as has been demonstrated 4.6. Vesicle- and synapse-related genes for other genes (see above).
they are not responsive to reduced neuronal activity. neuromodulators [51]. There are two main subtypes of T3 However, as suggested by our results, they might respond receptors,a andb, encoded by two different genes, TRa to sustained electrical activity during prolonged periods of and TRb, whose mRNAs are highly expressed in the entire either spontaneous or forced waking, with potential func- cerebral cortex [7]. To our knowledge, changes in the tional consequences on neuronal excitability. expression of T3 receptors had been demonstrated so far The NMDA-type glutamate receptor is involved in only in the developing brain, usually in response to synaptic plasticity and excitotoxicity. It is composed of hypothyroid conditions. The finding of a small but signifi-NMDAR1 and NMDAR2 protein subunits. There are four cant upregulation of TRb mRNA levels in the cerebral genes encoding variants of NMDAR2 (NMDAR2A – D). The cortex of adult rats after sleep deprivation suggests a composition of NMDAR subunits affects the functional possible involvement of this signaling system in the properties of the receptor and different subunits are physiological regulation of neural activity, although its differentially regulated during development and by various functional relevance is at present unknown.
ligands (e.g., Ref. [26]). The finding that the expression of
NMDAR2 is upregulated in waking with respect to sleepA 4.8. Transporters suggests that this receptor subunit is regulated under
physiological conditions in the adult animal. At least five different types of excitatory amino acid The AMPA-type glutamate receptor is the principal transporters (EAATs) have been identified. Two of them, mediator of fast excitatory transmission in the brain. the astroglial transporters GLAST and GLT1, are respon-AMPA receptors are comprised of different combinations sible for most of the functional glutamate transport that of four subunits, GluR1–4. The GluR2 subunit is ex- maintains the extracellular glutamate concentration at a pressed in most cortical pyramidal cells and plays a major low level. Several experimental conditions are associated role in determining calcium permeability of the receptor, with an increase in extracellular glutamate concentration, which is low when Glur2 is highly expressed (see refer- including kainic acid-induced seizures, ischemia, and nerve ences in Ref. [17]). Pathological events such as ischemia transection. In all cases GLAST mRNA levels increase can cause a switch in subunit composition and a dow- considerably [65], probably as an attempt to prevent nregulation of GluR2 expression, with subsequent in- glutamate neurotoxicity. After kainic acid-induced
sei-21
creased Ca permeability and cell death (see references in zures, GLAST mRNA levels reached 150, 200 and 300% Ref. [17]). The finding of increased GluR2 and GluR3 of baseline levels 6, 12, and 48 h following treatment, mRNA levels after spontaneous waking and sleep depriva- respectively [65]. In the present study, GLAST mRNA
21
tion relative to sleep raises the question of whether Ca levels increased by|30% after 8 h of spontaneous waking, permeability of cortical neurons may change across the a completely physiological condition. This result is
con-sleep–waking cycle. sistent with an increased release of glutamate in the
Activation of neuronal nicotinic acetylcholine receptors, cerebral cortex during waking relative to sleep. Indeed, which are located on axon terminals, increases the release cortical glutamate release assessed using a plastic chamber of several neurotransmitters, including acetylcholine, dopa- sealed into the skull was found to be higher in waking than mine, norepinephrine, serotonin, GABA, and glutamate. in sleep [37]. Subsequent studies of glutamate release in The predominant nicotinic receptor expressed in the verte- other brain structures have yielded contrasting evidence, brate brain contains a4 and b2 subunits, with the b2 possibly due to regional differences. Two microdialysis subunit mediating many of the pharmacological and be- studies found higher extracellular glutamate levels in havioral effects of nicotine [71]. Except for the effect of spontaneous waking ([2]; anterior hypothalamus) or after nicotine treatment (e.g., Ref. [66]), little is known about modafinil-induced waking ([24]; thalamus and hippocam-changes in mRNA levels of nicotinic receptor subunits. To pus) relative to sleep, but a third study obtained opposite our knowledge, the significant increase in mRNA levels of results ([39]; thalamus), and two other studies found no the b2 subunit in spontaneous waking and sleep depriva- changes across the sleep–waking cycle ([63,64]; posterior tion relative to sleep reported here is the first demonstra- hypothalamus and locus coeruleus).
tion of an activity-dependent regulation in the expression Spontaneous waking and sleep deprivation also cause an
of this gene. upregulation of the neurotransmitter transporter NTT4 /
expression in cerebral cortex and thalamus, where it is homeostasis. However, little is known about its functions associated with synaptic vesicles in nerve terminals of and none of its downstream targets have been identified. glutamatergic neurons and of some GABAergic neurons. Like most protein kinases, SGK1 is regulated at the post-NTT4 is therefore a vesicular transporter, but its substrate translational level [68]. However SGK1 is unique in being has yet to be identified. strongly regulated at the transcriptional level by glucocor-ticoid, serum, and other signals (see references in Ref. 4.9. Aryl sulfotransferase and serum /glucocorticoid- [68]).
induced serine /threonine kinase
4.10. Other genes Aryl sulfotransferases are a large family of enzymes that
catalyze sulfate conjugation of catecholamines, steroids, Other genes upregulated during spontaneous waking and drugs. The cDNA that we isolated in the cerebral and / or sleep deprivation form a heterogeneous group. cortex of sleep-deprived rats encodes an enzyme first These genes include LMO-4 and MT3, which were dis-cloned from rat liver as phenol sulfotransferase 1 and cussed above, cyclin D2 (Vin-1), which has been involved subsequently identified in the same tissue as aryl sulfo- in oncogenesis [29] and calmodulin. Calmodulin is a major
21
transferase IV, minoxidil sulfotransferase, tyrosine-ester Ca -binding protein present in all eucaryotic cells and sulfotransferase, and aryl sulfotransferase [99]. In the particularly abundant in the brain. Calmodulin modulates
21
brain, aryl sulfotransferase is responsible for the sulfona- the action of numerous Ca -dependent enzymes such as
21
tion of norepinephrine, dopamine and, to a lesser extent, adenylate cyclase and Ca -ATPase, and it is involved in serotonin [92]. In rodents, norepinephrine is first metabo- the synthesis of neurotransmitters, in synaptic function and
21 lized to 3-methoxy-4-hydroxyphenylethylene glycol neurotransmitter release, microtubule function, and Ca -(MHPG) by catechol-o-methyl transferases and mono- mediated regulation of gene expression. Three genes aminooxidases. Subsequently, MHPG is sulfonated by aryl encoding calmodulin have been isolated in the rat: CaM I, sulfotransferase. MHPG-sulfate is the major metabolite of CaM II, and CaM III. The three genes produce five
norepinephrine and MHPG-sulfate levels are well corre- different transcripts but the same identical protein because lated with the activity of the noradrenergic system of the they share the same coding region. The cDNA contained in locus coeruleus [18]. As was mentioned above, the activity the microarrays used for this study includes only a portion of noradrenergic neurons is strictly state-dependent, being of the coding region. Thus, we cannot establish which of high in waking and low in sleep [1]. Preliminary results the three CaM genes were differentially regulated across show that mRNA levels of aryl sulfotransferase increase the sleep–waking cycle. CaM I, II, and III expression may further after long periods (several days) of sleep depriva- be differentially regulated during development and after tion [15]. If confirmed, this would be the first demonstra- kainate-induced seizures in the hippocampus [83]. tion of a molecular response in the brain to prolonged
sleep loss and would suggest that the induction of aryl
sulfotransferase may constitute a homeostatic response to 5. Conclusions the uninterrupted activity of the central noradrenergic
system during waking. This notion is strengthened by the The results of the systematic screening of brain gene evidence of converging molecular correlates that was expression during sleep and waking lead to several conclu-recently obtained in Drosophila [77]. Rest deprivation in sions. As shown here, sleep and waking differ not only in
Drosophila is associated with an increased expression of terms of behavior, metabolism, and neuronal activity, but arylalkylamine N-acetyltransferase (DAT), an enzyme they are characterized by the up- or down-regulation of implicated in the catabolism of monoamines and func- distinctive categories of genes. The few genes that are tionally related to aryl sulfotransferase. Moreover, flies specifically upregulated during sleep are presently still mutant or deficient for DAT have an increased rest unidentified and await further characterization. The genes rebound after rest deprivation, suggesting that the accumu- that are upregulated after periods of waking and / or sleep lation of monoamines in the brain may trigger sleep deprivation suggest that several basic cellular functions are
homeostasis. affected by the arousal state of the animal. The increase in
cellular chaperones, which play a key role in protein
Res. 56 (1998) 293–305.
folding and ER function. This suggests that waking may [13] C. Cirelli, G. Tononi, Differences in brain gene expression between place some increased demands on such cellular processes, sleep and waking as revealed by mRNA differential display and cDNA microarray technology, J. Sleep Res. 8 (Suppl 1) (1999) or that sleep may be a time for their restoration. The
44–52. delineation of the spectrum of molecular differences
[14] C. Cirelli, G. Tononi, Differences in gene expression during sleep between sleep and waking should help directing further and wakefulness, Ann. Med. 31 (1999) 117–124.
work and provide important data to constrain hypotheses [15] C. Cirelli, G. Tononi, Changes in gene expression in the cerebral on the functions of sleep. cortex of rats after short-term and long-term sleep deprivation, Sleep
22 (Suppl. 1) (1999) 113.
[16] C. Cirelli, G. Tononi, On the functional significance of c-fos induction during the sleep / waking cycle, Sleep 23 (2000) 453–469. Acknowledgements [17] F. Conti, A. Minelli, N.C. Brecha, Cellular localization and laminar distribution of AMPA glutamate receptor subunits mRNAs and proteins in the rat cerebral cortex, J. Comp. Neurol. 350 (1994) This work was carried out as part of the experimental
241–259.
neurobiology program at The Neurosciences Institute, [18] J.R. Cooper, F.E. Bloom, R.H. Roth (Eds.), The Biochemical Basis which is supported by Neurosciences Research Founda- of Neuropharmacology, 7th Edition, Oxford University Press, New
York, 1996, pp. 226–292. tion. The Foundation receives major support for this
[19] L. De Lecea, J. Criado, M. Calbet, P.E. Danielson, S.J. Henriksen, program from Novartis Pharmaceutical Corporation. We
J.G. Sutcliffe, O. Prospero-Garcia, Sleep regulates accumulation of thank Glen A. Davis, Marijo C. Gallina, and Donald F. the cortical neuropeptide cortistatin, Soc. Neurosci. Abstr. 24 (1998)
Robinson for their expert contribution. 1429.
[20] W. Deleersnijder, G. Hong, R. Cortvrindt, C. Poirier, P. Tylzanow-ski, K. Pittois, E. Van Marck, J. Merregaert, Isolation of markers for chondro-osteogenic differentiation using cDNA library subtraction.
References Molecular cloning and characterization of a gene belonging to a
novel multigene family of integral membrane proteins, J. Biol. [1] G. Aston-Jones, F.E. Bloom, Activity of norepinephrine-containing Chem. 271 (1996) 19475–19482.
locus coeruleus neurons in behaving rats anticipates fluctuations in [21] S.U. Devaskar, P.A. Rajakumar, R.B. Mink, R.A. McKnight, S. the sleep-waking cycle, J. Neurosci. 1 (1981) 876–886. Thamotharan, S.J. Hicks, Effect of development and
hypoxic-is-´
[2] S. Azuma, T. Kodama, K. Honda, S. Inoue, State-dependent changes chemia upon rabbit brain glucose transporter expression, Brain Res. of extracellular glutamate in the medial preoptic area in freely 823 (1999) 113–128.
behaving rats, Neuroscience 214 (1996) 179–182. [22] R. Duelli, M.H. Maurer, W. Kuschinsky, Decreased glucose trans-[3] R. Basheer, J.E. Sherin, C.B. Saper, J.I. Morgan, R.W. McCarley, porter densities, rate constants and glucose utilization in visual P.J. Shiromani, Effects of sleep on wake-induced c-fos expression, J. structures of the rat brain during chronic visual deprivation, Neuro-Neurosci. 17 (1997) 9746–9750. sci. Lett. 250 (1998) 49–52.
[4] R. Basheer, M. Magner, R.W. McCarley, P.J. Shiromani, REM sleep [23] G.D. Ferguson, D.M. Thomas, L.A. Elferink, H.R. Herschman, deprivation increases the levels of tyrosine hydroxylase and norad- Synthesis, degradation, and subcellular localization of synaptotag-renaline transporter mRNA in the locus coeruleus, Mol. Brain Res. min IV, a neuronal immediate early gene product, J. Neurochem. 72
57 (1998) 235–240. (1999) 1821–1831.
[5] R.J. Boado, W.M. Pardridge, Glucose deprivation causes post- [24] L. Ferraro, T. Antonelli, W.T. O’Connor, S. Tanganelli, F. Rambert, transcriptional enhancement of brain capillary endothelial glucose K. Fuxe, The antinarcoleptic drug modafinil increases glutamate transporter gene expression via GLUT1 mRNA stabilization, J. release in thalamic areas and hippocampus, Neuroreport 8 (1997)
Neurochem. 60 (1993) 2290–2296. 2883–2887.
´
[6] A.A. Borbely, P. Achermann, Concepts and models of sleep [25] A.L. Fink, Chaperone-mediated protein folding, Physiol. Rev. 79 regulation: an overview, J. Sleep Res. 1 (1992) 63–79. (1999) 425–449.
[7] D.J. Bradley, W. Scott Young III, C. Weinberger, Differential [26] P. Follesa, M.K. Ticku, NMDA receptor upregulation: molecular expression ofaandbthyroid hormone receptor genes in rat brain studies in cultured mouse cortical neurons after chronic antagonist and pituitary, Proc. Natl. Acad. Sci. USA 86 (1989) 7250–7254. exposure, J. Neurosci. 16 (1996) 2172–2178.
[8] S. Brecht, S. Simler, M. Vergnes, K. Mielke, C. Marescaux, T. [27] J.F. Guzowski, G.L. Lyford, G.D. Stevenson, F.P. Houston, J.L. Herdegen, Repetitive electroconvulsive seizures induce activity of McGaugh, P.F. Worley, C.A. Barnes, Inhibition of activity-depen-c-Jun N-terminal kinase and compartment-specific desensitization of dent Arc protein expression in the rat hippocampus impairs the c-Jun phosphorylation in the rat brain, Mol. Brain Res. 68 (1999) maintenance of long-term potentiation and the consolidation of
101–108. long-term memory, J. Neurosci. 20 (2000) 3993–4001.
[29] Z. Hanna, M. Jankowski, P. Tremblay, X. Jiang, A. Milatovich, U. Cenni, R. Possenti, G. Barsacchi, L. Maffei, A developmentally Francke, P. Jolicoeur, The Vin-1 gene, identified by provirus regulated nerve growth factor-induced gene. VGF, is expressed in insertional mutagenesis, is the cyclin D2, Oncogene 8 (1993) 1661– geniculocortical afferents during synaptogenesis, Neuroscience 65
1666. (1995) 997–1008.
[30] O. Hermanson, T.M. Sugihara, B. Andersen, Expression of LMO-4 [47] G.L. Lyford, K. Yamagata, W.E. Kaufmann, C.A. Barnes, L.K. in the central nervous system of the embryonic and adult mouse, Sanders, N.G. Copeland, D.J. Gilbert, N.A. Jenkins, A.A. Lanahan, Cell. Mol. Biol. 45 (1999) 677–686. P.F. Worley, Arc, a growth factor and activity-regulated gene, encodes a novel cytoskeleton-associated protein that is enriched in [31] D. Hevroni, A. Rattner, M. Bundman, D. Lederfein, A. Gabarah, M.
neuronal dendrites, Neuron 14 (1995) 433–445. Mangelus, M.A. Silverman, H. Kedar, C. Naor, M. Kornuc, T.
Hanoch, R. Seger, L.E. Theill, E. Nedivi, G. Richter-Levin, Y. Citri, [48] M. Mackiewicz, P.J. Sollars, M.D. Ogilvie, A.I. Pack, Modulation of Hippocampal plasticity involves extensive gene induction and IL-1 beta gene expression in the rat CNS during sleep deprivation, multiple cellular mechanisms, J. Mol. Neurosci. 10 (1998) 75–98. Neuroreport 7 (1996) 529–533.
[32] G.L. Hinks, B. Shah, S.J. French, L.S. Campos, K. Staley, J. [49] B.N. Mallick, S. Gulyani, Alterations in synaptosomal calcium Hughes, M.V. Sofroniew, Expression of LIM protein genes Lmo1, concentrations after rapid eye movement sleep deprivation in rats, Lmo2, and Lmo3 in adult mouse hippocampus and other forebrain Neuroscience 75 (1996) 729–736.
regions: differential regulation by seizure activity, J. Neurosci. 17 [50] P. Maquet, Sleep function(s) and cerebral metabolism, Behav. Brain
(1997) 5549–5559. Res. 69 (1995) 75–83.
[33] G.E. Homanics, T.M. DeLorey, L.L. Firestone, J.J. Quinlan, A. [51] J.V. Martin, D.B. Williams, R.M. Fitzgerald, H.K. Im, P.F. Von-Handforth, N.L. Harrison, M.D. Krasowski, C.E. Rick, E.R. Korpi, voigtlander, Thyroid hormonal modulation of the binding and
¨ ¨
R. Makela, M.H. Brilliant, N. Hagiwara, C. Ferguson, K. Snyder, activity of the GABAA receptor complex of brain, Neuroscience 73 R.W. Olsen, Mice devoid of gamma-aminobutyrate type A receptor (1996) 705–713.
beta3 subunit have epilepsy, cleft palate, and hypersensitive be- [52] J. Masson, M. Riad, F. Chaudhry, M. Darmon, Z. Aidouni, M. havior, Proc. Natl. Acad. Sci. USA 94 (1997) 4143–4148. Conrath, B. Giros, M. Hamon, J. Storm-Mathisen, L. Descarries, S.
1 2
[34] J.A. Horne, in: Why We Sleep. The Functions of Sleep in Humans El Mestikawy, Unexpected localization of the Na / Cl -dependent-and Other Mammals, Oxford University Press, Oxford, 1988, 319 like orphan transporter, Rxt1, on synaptic vesicles in the rat central
pp. nervous system, Eur. J. Neurosci. 11 (1999) 1349–1361.
[35] M.M. Huntsman, E.G. Jones, Expression of alpha3, beta3 and [53] R. Matsuo, A. Murayama, Y. Saitoh, Y. Sakaki, K. Inokuchi, gamma1 GABA(A) receptor subunit messenger RNAs in visual Identification and cataloging of genes induced by lasting long-cortex and lateral geniculate nucleus of normal and monocularly term potentiation in awake rats, J. Neurochem. 74 (2000) 2239– deprived monkeys, Neuroscience 87 (1998) 385–400. 2249.
[36] K. Ibata, M. Fukuda, T. Hamada, H. Kabayama, K. Mikoshiba, [54] A.K. McAllister, L.C. Katz, D.C. Lo, Neurotrophins and synaptic Synaptotagmin IV is present at the Golgi and distal parts of neurites, plasticity, Annu. Rev. Neurosci. 22 (1999) 295–318.
J. Neurochem. 74 (2000) 518–526. [55] E.C. McNay, T.M. Fries, P.E. Gold, Decreases in rat extracellular [37] H.H. Jasper, R.T. Khan, K.A.C. Elliott, Amino acids released from hippocampal glucose concentration associated with cognitive de-the cerebral cortex in relation to its state of activation, Science 147 mand during a spatial task, Proc. Natl. Acad. Sci. USA 97 (2000)
(1965) 1448–1449. 2881–2885.
[38] L. Kaczmarek, A. Chaudhuri, Sensory regulation of immediate-early [56] F.D. Milner, J.G. Sutcliffe, Gene expression in rat brain, Nucleic gene expression in mammalian visual cortex: implications for Acids Res. 11 (1983) 5497–5520.
¨
functional mapping and neural plasticity, Brain Res. Rev. 23 (1997) [57] L. Minichiello, M. Korte, D. Wolfer, R. Kuhn, K. Unsicker, V.
237–256. Cestari, C. Rossi-Arnaud, H.-P. Lipp, T. Bonhoeffer, R. Klein,
[39] K.A. Kekesi, A. Dobolyi, O. Salfay, G. Nyitrai, G. Juhasz, Slow Essential role for TrkB receptors in hippocampus-mediated learning, wave sleep is accompanied by release of certain amino acids in the Neuron 24 (1999) 401–414.
´
thalamus of cats, Neuroreport 8 (1997) 1183–1186. [58] M.T. Moreno-Flores, U.E. Olazabal, G.W. Kreutzberg, Axotomy [40] D.A. Kenny, L.W. Jurata, Y. Saga, G.N. Gill, Identification and increases the expression of glucose-regulated protein 78 kDa in rat
characterization of LMO4, an LMO gene with a novel pattern of facial nucleus, Exp. Neurol. 146 (1997) 10–16.
expression during embryogenesis, Proc. Natl. Acad. Sci. USA 95 [59] K. Nagasaki, K. Sasaki, N. Maass, T. Tsukada, H. Hanzawa, K. (1998) 11257–11262. Yamaguchi, Staurosporine enhances cAMP-induced expression of [41] J.M. Krueger, F. Obal Jr., L. Kapas, J. Fang, Brain organization and neural-specific gene VGF and tyrosine hydroxylase, Neurosci. Lett.
sleep function, Behav. Brain Res. 69 (1995) 177–186. 267 (1999) 177–180.
1 2
[42] D. Kuhl, T.E. Kennedy, A. Barzilai, E.R. Kandel, Long-term [60] N. Nelson, The family of the Na / Cl neurotransmitter transpor-sensitization training in Aplysia leads to an increase in the expres- ters, J. Neurochem. 71 (1998) 1785–1803.
´
sion of BiP, the major protein chaperon of the ER, J. Cell Biol. 19 [61] M. Neuner-Jehle, T.A. Rhyner, A.A. Borbely, Sleep deprivation (1992) 1069–1076. differentially alters the mRNA and protein levels of neurogranin in [43] W. Link, U. Konietzko, G. Kauselmann, M. Krug, B. Schwanke, U. rat brain, Brain Res. 685 (1995) 143–153.
´
Frey, D. Kuhl, Somatodendritic expression of an immediate early [62] M. Neuner-Jehle, J.-P. Denizot, A.A. Borbely, J. Mallet, Characteri-gene is regulated by synaptic activity, Proc. Natl. Acad. Sci. USA 92 zation and sleep deprivation-induced expression modulation of (1995) 5734–5738. dendrin, a novel dendritic protein in rat brain neurons, J. Neurosci. [44] E. Little, G. Tocco, M. Baudry, A.S. Lee, S.S. Schreiber, Induction Res. 46 (1996) 138–151.
of glucose-regulated protein (glucose-regulated protein 78 / BiP and [63] D. Nitz, J.M. Siegel, GABA release in posterior hypothalamus glucose-regulated protein 94) and heat shock protein 70 transcripts across sleep / wake cycle, Am. J. Physiol. 271 (1996) R1707–1712. in the immature rat brain following status epilepticus, Neuroscience [64] D. Nitz, J.M. Siegel, GABA release in the locus coeruleus as a 75 (1996) 209–219. function of sleep / wake state, Neuroscience 78 (1997) 795–801. [45] H. Liu, R.C. Bowes, B. van de Water, C. Sillence, J.F. Nagelkerke, [65] M. Nonaka, E. Kohmura, T. Yamashita, S. Shimada, K. Tanaka, T.
J.L. Stevens, Endoplasmic reticulum chaperones GRP78 and cal- Yoshimine, M. Tohyama, T. Hayakawa, Increased transcription of
21