Drift control and buffer zones for helicopter spraying
of bracken (Pteridium aquilinum)
R.C. Robinson
a,∗, R.G. Parsons
b, G. Barbe
c, P.T. Patel
d, S. Murphy
eaInternational Application Technology Group, Rhône-Poulenc, North Newbald, York YO43 4TY, UK bAldhams Experimental Farm, Rhône-Poulenc Agriculture Ltd., Lawford, Manningtree, Essex CO11 2NF, UK
c1, Rue du Lac, 92500, Rueil Malmaison, France
dEnvironmental Sciences Department, Rhône-Poulenc Agriculture Ltd., Ongar Research Station, Ongar Essex CM5 OHW, UK eSilsoe College, Cranfield University, Beds, MK45 4DT, UK
Received 22 March 1999; received in revised form 20 December 1999; accepted 21 December 1999
Abstract
Application of asulam herbicide by helicopter, as a primary treatment of bracken, requires appropriate buffer zones to protect non-target plants, conservation areas and water catchments from spray drift. Drift from large-scale applications of asulam were monitored at two moorland sites where helicopters were fitted with Delavan RD ‘Raindrop’ drift-reducing, hollow-cone nozzles. Drift was measured on 10 m vertical ‘strings’ and on flat cards at intervals to 200 m downwind. Potted seedlings of Rumex acetosa, as a bioassay, were exposed over similar distances.
At 200 m downwind, levels of drift were close to limits of detection by high performance liquid chromatography (HPLC). With wind speeds at the legal limit for helicopter spraying, total drift fallout (integrated to 1 km downwind) accounted for 0.61% of the applied asulam. In these conditions, fallout dropped below 1% of the applied dose rate approximately 35 m downwind of the sprayed area. In general terms, beyond 15 m from the sprayed areas, drift levels from the helicopters proved similar to those reported from tractor-operated boom-sprayers. Bioassay data correlated with asulam fallout. A zero-effect level of 100 g ha−1after 7 weeks (2.25% of the dose for bracken eradication) suggested a buffer zone of 15 m which might be doubled to 30 m to allow for inaccurate flying, late shut-off, dosage errors and species with greater sensitivity than Rumex. On the basis of this work, and also to protect private water abstractions, the Environment Agency approved a 50 m buffer zone for helicopters fitted exclusively with RD Raindrop nozzles. © 2000 Elsevier Science B.V. All rights reserved.
Keywords: Bracken; Pteridium aquilinum; Asulam; Helicopter spraying; Drift; Buffer zones; Rumex acetosa; UK
1. Introduction
The systemic herbicide asulam, methyl(4-amino-benzenesulphonyl)carbamate, is applied by helicopter as a primary treatment of larger, often inaccessible, stands of bracken. To assess the environmental risks
∗Corresponding author. Tel.:+44-01430-827747; fax:+44-01430-827729.
E-mail address: [email protected] (R.C. Robinson)
from such work, drift-monitoring studies were car-ried out by Marrs and Frost (1996), using a Rumex
acetosa (Common Sorrel) bioassay, which suggested
the need for a 160 m buffer zone to protect suscepti-ble, non-target species. This was subsequently applied without qualification wherever there were perceived risks of drift onto non-target plants, conservation ar-eas or water-courses extracted for drinking purposes. Delavan RD Raindrop nozzles (Tate, 1977) can re-duce drift, increase spray recovery (Bouse et al., 1976)
and enhance the efficacy of asulam applied aerially to bracken (Horsnail and Robinson, 1984; Robinson, 1984). The pertinent work by Marrs and Frost, how-ever, had evaluated drift for helicopters which were not set-up exclusively with RD nozzles. When this mea-sure is adopted under commercial conditions, bracken, itself sensitive to asulam, rarely shows a response beyond a few metres downwind of the boom ends. Missed-strips sometimes arise which reflect a sharp edge to the sprayed swath and an absence of high lev-els of drift which would otherwise assist swath match-ing. It was therefore suspected that the 160 m buffer zone was too restrictive of helicopter spraying in many areas where invasive bracken required control, espe-cially in upland localities intersected by numerous water-courses.
Recognising these factors, a protocol was approved by the Environment Agency (England and Wales) to demonstrate, through further monitoring, that a re-duced buffer-zone was feasible when helicopters were fitted exclusively with RD Raindrop nozzles. The protocol called for monitoring of commercial-scale spraying of typical upland bracken, again using a R.
acetosa bioassay to compare with the work of Marrs
and Frost. Drift of asulam itself was to be mea-sured using high performance liquid chromatography (HPLC) methods to avoid debate over use of tracers. Drift fallout on sampling cards was to be measured to correlate bioassay data with dosage. Airborne drift was also to be monitored on vertical ‘strings’ to permit comparison with other, definitive drift studies. Such studies (Wilson, 1995) have indicated that drift-reduction nozzles used on helicopters can de-crease drift to levels comparable with conventional tractor-operated boom spraying. Where such compa-rability may be demonstrated, interpretation of limited assay data and the choice of buffer zones required can be resolved by the widely-accepted agricultural prac-tice pertaining to tractor-drawn sprayers. Part of this study therefore undertook such a comparison based on the data of Lloyd and Bell (1983).
2. Materials and methods
Monitoring of helicopters applying asulam to bracken on a commercial scale was carried out in 1997 at two upland moorland sites in the North
York Moors National Park. At Site 1 (Crossley Side, Little Fryup Dale; Grid Ref. NZ 710 055) spray was applied to a 7.4 ha block within an extended area of mostly uniform, low-density bracken (approximately 50 cm tall) across a 10–30◦±concave slope. Heather (Calluna vulgaris, including Erica cinereum and E.
tetralix), bilberry (Vaccinium myrtillus) and
crow-berry (Empetrum nigrum) ground-cover was present under the bracken. Drift was monitored within the same area of vegetation on slightly rising ground. At Site 2 (Goathland Common; Grid Ref. SE 816 995) spray was applied to a 4.3 ha block of vigorous, uniform bracken (75–100 cm tall) across a 10◦slope. Drift monitoring was conducted on an adjacent area, mostly free of bracken (sprayed in 1996), although vigorous heather and bilberry was present.
2.1. Site layout for spray-deposit and drift monitoring
Within each site, a rectangular block was selected for treatment with a downwind edge perpendicular to the wind direction. This base-line was flagged with balloon markers to guide the pilot to obtain an accurate first-pass of the helicopter (no other markers were em-ployed). All the remainder of the spraying took place successively upwind of, and parallel to, this line, in 22 passes made cross-wind in opposite directions, each pass being approximately 300 or 200 m long at Site 1 and 2, respectively.
Spray deposit assessment and drift monitoring were carried out at each site along duplicate transects (A and B), approximately 50 m apart, lying±parallel to the wind and extending to 150 m (Site 1) or 200 m (Site 2) downwind of the base-line. The different sampling distances reflected the space available on-site over rea-sonably smooth terrain given the wind direction on that day. The transects also extended 30 m upwind of the base-line to measure spray deposits achieved di-rectly under the initial helicopter passes.
from each other and across the wind direction. Where necessary, any bracken fronds in the vicinity were cut back to create an open avenue, approximately 2 m wide, along the transects.
Spray deposition and levels of drift were estimated using four different means:
(i) Ciba Geigy, 52 mm×76 mm, water-sensitive pa-pers were used to visualise spray deposits under the
helicopter and the drift fallout downwind of the ap-plications. Papers were laid out on tables (attached by a rubber-band) at 1 m intervals, beginning at the zero line, to 50 m downwind; thence at intervals of 5 m to 100 m downwind. Significant visible fallout was not anticipated beyond this distance. Papers were in-spected for deposit levels and droplet quality on-site immediately after spraying. Xerox copies of each pa-per were also made as pa-permanent records.
(ii) Fyne Papers acrylic-coated, 290 gsm, 75 mm× 106 mm ‘Astralux’ cards were used to sample the spray
applied under the helicopter as well as the levels of drift fallout downwind. Each card was attached to the sampling tables in a horizontal position by a sin-gle rubber band. The cards were laid out on tables at 2 m intervals, beginning at the zero line, to 50 m downwind; thence at intervals of 5 m to 100 m down-wind; and beyond that, at intervals of 10 m to 150 m downwind (Site 1) or to 200 m downwind (Site 2). To monitor the dosage applied under the helicopter, cards were also laid out within the transects upwind of the base-line every 2 m, to a distance of 30 m. Im-mediately after spraying, each card was placed within a labelled polybag and returned to the laboratory for estimation of asulam by HPLC.
To check the possibility of cross-contamination from handling sampling-tables already used on Site 1, control cards on Site 2 were handled on-site in the same manner as the ‘live’ cards, but not later exposed to spray drift. In subsequent analysis of these control cards for asulam, no cross-contamination was found.
(iii) Vertical drift-sampling ‘strings’ on 10 m masts were used to sample levels of airborne drift. Three masts were erected 50, 100 and 150 m downwind of the base-line at each site, adjacent to Transect B. Each mast (supplied by Silsoe College and described by Gilbert and Bell, 1988) carried duplicate, vertical, 10 m ‘strings’ of 2 mm OD polythene tubing (small diameter for sampling fine, airborne spray droplets). Each string comprised five sections, each 2 m long,
linked by crimp-connectors. Immediately after spray-ing, each 2 m string section was placed in a labelled polybag and returned to the laboratory for estimation of asulam by HPLC.
(iv) Potted seedlings of R. acetosa (Common Sorrel) were used for bioassay purposes, to monitor the spray applied under the helicopter and the lev-els of drift downwind. R. acetosa was chosen as a bioassay because it grows rapidly and uniformly from seed and is sensitive to asulam (recommended for the control of Rumex species as Docks in pasture). The Rumex seedlings were grown in the greenhouse, sown in 80 mm square plastic pots in John Innes No. 2 compost and thinned to 10 plants per pot before use at the 1–2 leaf stage, approximately 20–30 mm tall. This growth stage proved more manageable than the larger 10–40 leaf plants used by Marrs and Frost. A stackable tray system minimised damage to seedlings during handling, transport and work on-site.
Single pots of Rumex seedlings were placed on sampling-tables in the same locations as the ‘Astralux’ cards. After spraying, no overhead watering was used and precautions were taken to protect the plants from rainfall. As soon as possible after treatment, all pots were returned to the greenhouse for growing-on.
Visual assessments of the foliage of exposed seedlings were made 14, 22, 30, 36 and 48 days after treatment (DAT) for Site 1 or 12, 20, 28, 34 and 46 DAT for Site 2. Percentage reduction of healthy leaf area was estimated by comparison with control plants, effectively integrating necrosis, chlorosis and bulk reduction effects. Control pots were not exposed to the helicopter treatments but were otherwise handled identically. Two independent sets of controls were maintained for each of the two sites. The assay had not reached maturity (maximum levels of recovery or damage) by the last assessment at 48/46 DAT (7 weeks).
2.2. Analysis of cards and ‘strings’
for estimation at 270 nm by reverse-phase HPLC with 1 ml min−1 flow rate against an external stan-dard using a peak integration method. The limit of detection was approximately 10 ppb asulam in the 20 ml extracts. This was equivalent to a dose rate of approximately 0.3 g ha−1 of asulam. By means of spiked samples, mean recovery of asulam from the cards was estimated at 87.6% including a correction for ‘shading’ by the rubber-bands. In the absence of a suitable determination, recovery from the ‘strings’ was assumed to be 100%.
2.3. Application
Each helicopter was set-up exclusively with Dela-van RD Raindrop nozzles in order to minimise drift. These disc/core hollow-cone nozzles employ a sec-ondary swirl chamber which significantly reduces fines compared with conventional nozzles of the same output (Stewart and Gratkowsky, 1976; Grumbles et al., 1980). Typically, the droplet spectrum from an RD nozzle comprises <1% of droplets with
diame-ters<100mm, with VMD ranging from 400 to over 1500mm, depending on output (Tate, 1977).
At Site 1, a Bell 47-G3B1 helicopter was fitted with 36 RD3 (D5/25) nozzles at an angle of 90◦to the di-rection of flight, giving an operating boom width of 10.5 m. Working spray pressure was quoted as 30 psi and flying speed as 78–83 km h−1at a height of 2–3 m. At Site 2, a Robinson R22B helicopter was fitted with 16 RD7 (D8/45) nozzles at an angle of 130◦ to the direction of flight, giving an operational boom width of 8.5 m. Working spray pressure was quoted as 20 psi and flying speed as 64–74 km h−1. This helicopter em-ployed a greater flying-height of 3–5 m to compensate for its narrower swath width.
One full helicopter load of asulam spray-mix was applied at each site for drift monitoring purposes. A small quantity of non-ionic wetter (alkyl phenol ethy-lene oxide condensate), as Techsol ‘Enhance’ (Site 1) or ‘Enhance Low Foam’(Site 2), was added to each tank mix as recommended for spraying bracken with asulam. At each site, the duration of spraying (with turns) lasted for just over 8 min. No other spraying was carried out on-site until all monitoring work was complete.
A portable Met-250 weather station recorded wind speed and direction at 2 m height above ground at
1 s intervals during the spraying. Site 1 was sprayed in gusty conditions with a mean wind speed of 16.7 km h−1 (close to the CAA maximum limit of 18.5 km h−1or 10 knots) at 14.5–16◦C with 80–85% RH. Site 2 was sprayed at a mean wind speed of 11.1 km h−1at 19–20◦C with 78–91% RH.
2.4. Comparative data for tractor-operated spraying
Lloyd and Bell (1983) measured drift to 200 m downwind of multiple passes of a 12 m tractor-drawn boom-sprayer running cross-wind along a single track. Data for airborne drift (retained on 11 m verti-cal 2 mm ‘strings’) and fallout (retained on horizontal 2 mm ‘strings’) were measured at mean wind speeds of 14.6–17.9 km h−1. To compare these data with those measured in the current study, it was necessary to make corrections for the much larger total area sprayed by the helicopters upwind of the monitoring positions.
Equations were fitted to the drift characteristics for the single-track tractor spraying (Table 1). By sub-stitution at successive 12 m intervals, these equations predicted the increments of fallout expected at the same fixed monitoring positions for 12 m bouts of the tractor sprayer made successively upwind of the original track. The 22 helicopter passes in the current work equated to upwind distances of 231 m and 187 m at Sites 1 and 2, respectively. These distances were equivalent to approximately 19 and 15 cross-wind passes of the 12 m tractor sprayer respectively, giv-ing the number of incremental substitutions required. Assessed at 8 m downwind, this procedure generated values which compared favourably with those cal-culated by Lloyd and Bell by their own graphical methods.
Computed fallout values were converted to a per-centage of the applied volume rates per ha according the nozzle sizes on the tractor sprayer. Estimated fall-out from the helicopter at the same monitoring posi-tions were calculated as means of the values shown in Fig. 2 and corrected to a percentage of the estimated quantities of asulam applied per ha.
Table 1
Mean values for drift from a single pass of a tractor-drawn 12 m boom sprayera
(A) Data for airborne drift (ml per 1 m wide×11 m tall window)
Nozzles, Volume rate Mean wind Airborne drift at distances Equation for drift R2
and pressure (l ha−1) speed (km h−1) downwind (m) characteristicb
Nozzles, Volume rate Mean wind Drift fallout at distances Equation for drift R2
and pressure (l ha−1) speed (km h−1) downwind (m) characteristicb aData from Lloyd and Bell, Tables 5 and 6 (1983).
bx=distance downwind (m) from the edge of the sprayed area.
to percentages of the weights of asulam applied to the same 1 m strip.
3. Results
Timed video recordings at both sites confirmed that the combinations of nozzles, pressures and flow-rates were close to nominal, tabulated values. At Site 1, these checks indicated an applied total volume rate of 30 l ha−1and a mean asulam dose of 3.6 kg a.i. ha−1. Although this reduced dose may be critical to control of bracken, it did not compromise the drift study itself. At Site 2, the checks showed an applied total volume rate of 35 l ha−1 and a mean asulam dose of 4.4 kg a.i. ha−1(recommended for bracken eradication). The total quantities of asulam applied were estimated as 26.4 and 19.1 kg at Sites 1 and 2, applied to estimated areas of approximately 7.4 and 4.3 ha, respectively.
3.1. Visual droplet fallout on papers and cards
The water-sensitive cards positioned directly under-neath the helicopter confirmed the large droplets and
few fines associated with typical RD Raindrop nozzle applications by helicopter. At Site 1, irregular deposits upwind of the base-line revealed a ‘missed-strip’ (con-firmed by the pilot). The droplet impacts at Site 1 were generally elongated and ‘tailed’ due to the wind. At both sites, every card showed some impacts, although their size and number were extremely small furthest from the sprayed areas, consistent with drift fallout.
3.2. Asulam deposits and drift fallout measured on cards
Fig. 1. Asulam dosage recovered from cards close to the helicopters.
rapidly downwind of the treated zones, falling be-low 2% of the recommended dose approximately 15 m downwind of the base-line at both sites.
Fig. 2 shows the asulam fallout recovered from cards downwind of the base-line in semi-log format.
Fig. 2. Asulam drift (fallout) recovered from cards.
200 m downwind. Although similar patterns of drift were recorded at both sites, higher levels of fallout were recovered at Site 1 beyond approximately 25 m, attributed to greater wind speeds during application.
Fig. 3. Linear regression of asulam fallout (log–log plot).
Fig. 3 shows estimated equations for the drift fall-out characteristics. To avoid the exaggerated fallfall-out of heavier droplets in the spray ‘displacement’ zone immediately downwind of the base-line (arguably not
cap-ture efficiency of smaller droplets on flat papers with increasing distance from the source.
Total asulam fallout outside the sprayed areas was estimated by integration of the regression equations in Fig. 3, for an area downwind of, and the same width as, the sprayed blocks. Between limits of 10 m and 1 km, for block widths of 320 and 232 m at Sites 1 and 2, estimated total fallout was 0.61 and 0.40% of the total asulam applied at each site, respectively. It is coincidence that these estimates reflect the percent of driftable fines (droplets<100mm diameter) quoted for RD Raindrop nozzles (Ware et al., 1975; Anon., 1980). With mean wind speeds of 16.6 and 11.1 km h−1, re-spectively, the two total drift estimates appeared to conform to the linear relation between drift and wind speed predicted by Hobson et al. (1993). This seems confirmed by the ratio of 1.4 between the gradients of the two lines in Fig. 3 (the indices for the power equations shown) compared with a ratio of 1.5 for the mean wind speeds. Using the two equations in Fig. 3, the mean distance at which fallout dropped below 1% of the applied mean dose of asulam was estimated as 36.0 m and 27.4 m for Sites 1 and 2, respectively.
3.3. Airborne drift of asulam captured on vertical ‘strings’
Fig. 4 shows the quantities of asulam recovered from the duplicate 2 m ‘string’ sections on each mast after adjustment of data for Site 1 where the masts were bowed by the wind. Significant trends towards zero did not appear on any of the masts at any string position. This suggested that turbulent air-mixing had occurred at both sites, resulting in driftable droplets exceeding 8–10 m height, before the air had reached 50 m downwind of the spray release point. This effect is commonly seen for tractor-operated spraying as well as aerial application (Parkin and Merritt, 1988).
Compared with Site 2, higher levels of airborne drift were captured at Site 1, attributed to greater wind speeds during spraying, and where there was also greater variation with sampling height. At Site 1, least drift was picked-up on the ‘strings’ nearest the ground which was attributed to the filtering effect of the bracken covering this site. At Site 2, where bracken was largely absent downwind of the sprayed block, this effect was not apparent.
Fig. 5 shows the mean levels of airborne asulam recovered per 10 m ‘string’ at each mast position. It is assumed that each ‘string’ sampled a 2 mm×10 m cross-sectional air-stream or ‘window’. Table 2 shows the overall airborne drift off the block (estimated to 10 m height) with the lateral dimension of this win-dow extended to the width of the sprayed block. As-suming no loss of drift over the tops of the masts, differences in the measured quantity of drift passing through one window and the next ought to account for the fallout observed on the cards laid out between the same two masts. Table 3 makes a comparison of such fallout estimates with measured values, showing that the ‘string’ data tended to overestimate fallout mea-sured on the cards, although there was good agree-ment between the two estimates at Site 2. At Site 1, however, data for the masts predicted double the fall-out compared with measured values from cards. This discrepancy may be the result of higher wind speeds at Site 1 causing more drift to be lost over the tops of successive masts, especially as the masts were known to have been bowed. The greater wind speeds at Site 1 may also have enhanced droplet capture efficiency on the ‘strings’ and reduced the impaction of droplets onto flat cards.
3.4. Bioassay results
Assessed in the greenhouse after spraying, the pot-ted Rumex seedlings showed expecpot-ted, high levels of damage in pots which had been closest to the sprayed areas but with damage decreasing rapidly with dis-tance downwind. This pattern was consistent with measured fallout while most of the plants (except those nearest the treated areas) showed rapid recovery with time.
Fig. 4. Asulam recovery from drift mast strings. Y-axes refer to duplicate 2 m strings at each of 5 lvels (5=level nearest ground).
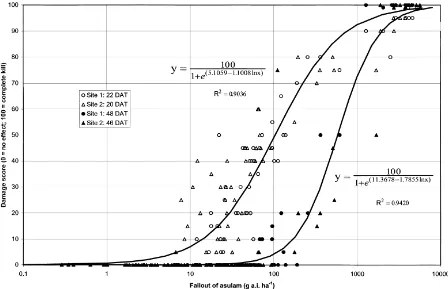
Growth-responses over the assessment period were established from the scores for each pot compared with the asulam fallout recovered from the card adjacent to each pot. Fig. 6 shows logistic dose-response curves (function described by Pestemer and Pucelik-Günther, 1997) fitted for assessments at 3 and 7 weeks post-spray (intermediate assessments omitted). The level of correlation and the±homogenous mix of data between both sites (sprayed 2 days apart), suggest a
valid assay for predicting potential effects of asulam fallout.
asu-Fig. 5. Mean recovery of airborne drift of asulam.
lam would also recover. However, doses over 1000 g a.i. ha−1 would be mostly lethal to R. acetosa under the conditions of the assay.
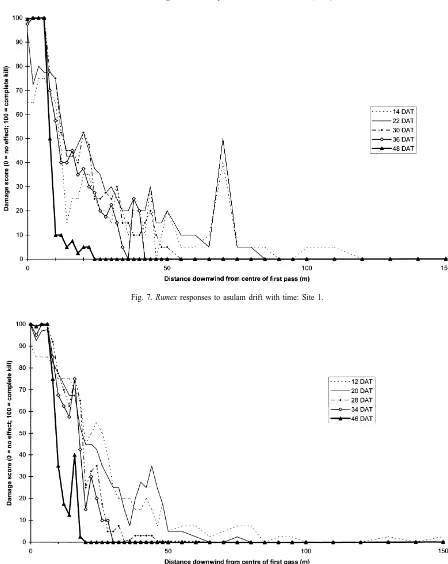
Figs. 7 and 8 summarise the Rumex responses to fallout (means of duplicate transects) in relation to
Table 2
Estimated airborne drift of asulam
Distance from base-line (m) Airborne drift (grams asulam) Airborne drift (% total asulam applied)
Site 1a Site 2b Site 1a Site 2b
50 73.14 12.46 0.28 0.07
100 36.61 5.94 0.14 0.03
150 19.97 2.51 0.08 0.01
aSite 1: data for window 320 m wide×8 m tall; 26.4 kg asulam applied. bSite 2: data for window 232 m wide×10 m tall; 19.1 kg asulam applied.
conditions, marginal observations at this range and timing were considered indeterminate. At 4 weeks, no effects were evident more than 50 m downwind and, as the assay matured, all plants except those within 10 m of the base-line continued to recover. At 7 weeks, no effects were evident beyond 20 m of the base-line (approximately 15 m from the end of the spray boom). This corresponded with the no-effect level of approximately 100 g a.i. ha−1 shown in Fig. 6. All lethal effects were confined to within 10 m of the base-line (or approximately 5 m from the end of the spray boom).
3.5. Comparison of drift data for tractor-operated spraying
Fig. 9a and b compare fallout values derived for the tractor sprayer data with values from the helicopter applications. It is seen that fallout from the helicopters exceeded that from typical tractor spraying within a limited zone only, to approximately 15 m downwind of the treated areas (taking the worst case at Site 1). This effect is attributed to the lateral ‘displacement’ of spray resulting from the greater height of spray-release from the helicopters and the turbulence associated with the rotors. This deposition is not representative of fall-out of finer droplets over greater distances, beyond
Table 3
Drift fallout: predicted values (masts) vs measured values (cards)a
Site 50–100 m zone 100–150 m zone
Data for cards (measured)b Data for masts (predicted)c Data for cards (measured)b Data for masts (predicted)c
1 15.6 36.5 8.0 16.6
2 6.8 6.5 2.3 3.4
aData for grams asulam.
bIntegrated values using regression equations from Fig. 3. cValues by subtraction — data from Table 2.
say 15 m of the edge of the treated area. At greater distances, the fallout values for the helicopters were consistently below those for the tractor sprayer 11003 nozzle data (BCPC ‘Medium’ spray quality).
The fitted exponential curves in Fig. 5, for the air-borne levels of asulam recovered during the helicopter work, were used to extrapolate these data to the same downwind monitoring positions as the tractor sprayer data of Lloyd and Bell in Table 1. Power equations offered poorer fits and were not used. Tooby (1997) also suggested that power equation extrapolations can be misleading when attempting to set appropriate safe distances for buffer zones. Fig. 9c and d compare the derived airborne drift for multiple passes of the tractor sprayer with data for the helicopters from Sites 1 and 2, respectively. At both sites, data from the three mast positions (50, 100 and 150 m) fell within the range of values predicted for the tractor sprayer. The greater levels of airborne drift at Site 1 are attributed to the greater wind speeds at this site.
4. Discussion
Fig. 6. Regression of Rumex growth responses with asulam fallout.
methods in each case and under a similar range of wind speeds. However, the use of airborne drift data to predict potential contamination of non-target vege-tation is not straightforward because the nature of the deposition is dependent on many interacting variables (Schaefer and Allsopp, 1983; Hall et al., 1993; Marrs and Frost, 1997; Haughton et al., 1998).
The aspect of drift more easily studied, as an indi-cator of potential contamination of water-courses or conservation areas, is fallout, whether measured on flat cards (current work) or horizontal strings (Lloyd and Bell). Caution is necessary when comparing drift data from different sampling methods (Miller et al., 1989) but, in view of the good prediction of the fallout on cards based on ‘string’ data in at least one case (Site 2; Table 3), it seems that the two methods can be mu-tually accountable. Further, where airborne drift levels have already been shown to be similar (tractor versus helicopter data based on the same sampling methods),
it is unlikely that the corresponding fallout patterns will be very different.
It is noted that profiles of drift fallout presented by Ganzelmeier et al. (1995), for tractor spraying over open land, suggest much lower fallout levels than those predicted here from the data of Lloyd and Bell. This difference can be explained by the former studies be-ing undertaken in much lower mean wind speeds and where fallout was measured using petri-dishes, not ‘strings’ or exposed cards. Comparison of data from these two studies is thus no basis to assume that the fallout levels calculated for tractor spraying in the cur-rent study have been overestimated.
It is concluded that helicopters, working over bracken and fitted exclusively with RD Raindrop noz-zles, produced levels of drift similar to tractor-operated sprayers at distances of 15 m or more downwind of the sprayed areas. The bioassay also suggested that
Fig. 7. Rumex responses to asulam drift with time: Site 1.
Fig. 9. Comparisons of drift from helicopter vs tractor spraying (data from Lloyd and Bell, 1983).
of asulam drift beyond the same critical 15 m distance downwind of the treated areas. Marrs et al. (1993) proposed a 20 m buffer zone to protect seedlings from glyphosate drift from a tractor sprayer, a similar distance which may not be coincidence.
Marrs et al. (1989) proposed that seedlings are sen-sitive to drift, requiring larger buffer zones than more established plants. The current bioassay used a 1–2 leaf growth stage, not older plants as used by Marrs and Frost (1996), and might therefore be considered more sensitive. However, it may also be argued that different growth stages in the two studies may have experienced different exposure to drift and that the as-says were not therefore comparable. This impasse was avoided by the demonstrated equivalence between he-licopters fitted with RD Raindrop nozzles and tractor
spraying for which buffer zones are already well es-tablished in general agriculture.
apply, not the 160 m value proposed by Marrs and Frost. The question was by how much could this value be reduced?
Applications by helicopter are not reliably as ac-curate as those by tractor sprayer. Although an em-pirical ‘safe’ distance of 15 m was indicated by the
Rumex assay, the missed-strip at Site 1 highlighted a
need to double this value to at least 30 m to account for inaccurate flying, over-spray events, late shut-off and dosage errors. Of equal importance is the need to protect species downwind that may have greater sensi-tivity to asulam than Rumex, especially Pteridophytes other than bracken (Robinson and Page, 2000). The 30 m value is also approximately coincident with the distance at which fallout dropped below 1% of the ap-plied dose (Fig. 3).
After an initial proposal of a 30 m buffer zone to the Environment Agency, further consultations (Zaman, 1998) indicated a need for added protection of private water abstractions in rural areas. A decision was there-fore made by the EA, followed by the Scottish Envi-ronmental Protection Agency, to adopt a 50 m buffer zone which would further reduce the incident fallout by one-half compared with a 30 m buffer. The safety margin built into the 50 m buffer zone would also of-fer protection where spraying might be undertaken in higher wind speeds than those measured and where proportionally higher levels of drift would occur.
Space precludes a full discussion of the helicopter application methods described herein which represent ‘placement’ spraying of herbicide where steps are taken to minimise downwind drift off-target. In ad-dition to RD nozzles, successful bracken control de-pends on pilot experience in flying close to the ground in hill country to minimise spray-release height, a crit-ical factor controlling spray drift as identified by May-bank (1984). This type of work is entirely different from conventional aerial application to crops where finer droplets may be released at greater heights to enhance swath width and target coverage. Fixed-wing aircraft, which may lead to drift levels over 10 times those recorded in the current work at 30 m (Maybank et al., 1975), requiring buffer zones of 200 m or more for herbicides (Grumbles et al., 1980), are not used to apply asulam to bracken. The scale of drift and the potential risks to the environment from conventional aerial application are of a much higher order than those from the helicopter placement work described.
Acknowledgements
Mr. N. Hawkings-Byass of MFH Helicopters Ltd., and Mr. D. Agar of Rhône-Poulenc Agriculture Ltd., played key roles in this study. Critical guidance was provided by Mr. A. Barndon, Dr. A. Croxford and Mr. N. Zamon of the Environment Agency. The two sites, provided by Mr. R. Sword (Wykham and Danby Trusts) and Mr. W.N. Baldwin (Wheeldale and Goath-land Estate), were treated by ESA-Howden and MFH Helicopters Ltd., respectively. The drift masts and strings were supplied by Dr. S. Parkin, Silsoe College, Cranfield University.
References
Anon., 1980. Raindrop nozzles: drift control through nozzle design. Delavan Ltd. Bulletin E1493C.
Bouse, L.F., Carlton, J.B., Merkle, M.G., 1976. Spray recovery from nozzles designed to reduce drift. Weed Sci. 24 (4), 361– 365.
Ganzelmeier, H., Rautmann, D., Spangenberg, R., Streloke, M., Herrman, M., Wenzelburger, H-J., Walter, H-F., 1995. Studies on the spray drift of plant protection products. Mitteilungen aus der Biologischen Bundesanstalt für Land- und Forstwirtschaft, Heft 305, Berlin-Dahlem.
Gilbert, A.J., Bell, G.J., 1988. Evaluation of the drift hazards arising from pesticide spray application. Aspects Appl. Biol. 17, 363–376.
Grumbles, J.B., Jacoby, P.W., Wright, W.G., 1980. Deposition of herbicides from fixed-wing aircraft. Down to Earth 36 (3), 9–17. Hall, F.R., Chapple, A.C., Downer, R.A., Kirchner, L.A., Thacker, J.R.M., 1993. Pesticide application as affected by spray modifiers. Pesticide Sci. 38, 123–133.
Haughton, A.J., Wilcox, A., Chaney, K., Cooper, S.E., 1998. Spray drift into field margins: the effect of width of buffer strip and plant species on the interception of spray drift. Proc. 1998 Br. Crop Prot. Conf. Weeds, pp. 285–290.
Hobson, P.A., Miller, P.C.H., Walklate, P.J., Tuck, C.R., Western, N.M., 1993. Spray drift from hydraulic spray nozzles: the use of a computer simulation model to examine factors influencing drift. J. Agric. Eng. Res. 54, 293–305.
Horsnail, G.B., Robinson, R.C., 1984. Further developments in the use of asulam for the control of bracken. Proc. Crop Protection in N. Britain 1994, 315–320.
Lloyd, G.A., Bell, G.J., 1983. Hydraulic nozzles: comparative spray drift study. MAFF Operator Protection Group report, Harpenden.
Marrs, R.H., Frost, A.J., Lunnis, P., 1993. Determination of buffer zones to protect seedlings from the effects of glyphosate spray drift. Agric. Ecosyst. Environ. 45, 283–293.
Marrs, R.H., Frost, A.J., 1997. A microcosm approach to the detection of the effects of herbicide spray drift in plant communities. J. Environ. Manage. 50, 369–388.
Marrs, R.H., Williams, C.T., Frost, A.J., Plant, R.A., 1989. Asse-ssment of the effects of herbicide spray drift on a range of plant species of conservation interest. Environ. Pollut. 59, 71–86. Maybank, J., 1984. A review of the factors affecting pesticide drift.
Saskatchewan Research Council Publication E-190-2-B-84, SRC Technical Report 150.
Maybank, J., Yoshida, K., Grover, R., 1975. Droplet drift and downwind deposition from aerially applied herbicide sprays. Saskatchewan Research Council Publication P75–14. Miller, P.C.H., Walklate, P.J., Mawer, C.J., 1989. A comparison
of spray drift collection techniques. Proc. 1989 Br. Crop Prot. Conf. Weeds, pp. 669–676.
Parkin, C.S., Merritt, C.R., 1988. The measurement and prediction of spray drift. Aspects Appl. Biol. 17, 351–361.
Pestemer, W., Pucelik-Günther, P., 1997. Standardised bioassay for the determination of ED10 (NOEL) and ED50 values
for herbicides and selected following crops in soil. Federal Biological Research Centre for Agriculture & Forestry (BBA), Report 29, 1997 Germany.
Robinson, R.C., 1984. Systems of bracken control using asulam. Aspects Appl. Biol. 5, 321–332.
Robinson, R.C., Page, C.N., 2000. Protection of non-target ferns during extensive spraying of bracken. In: Taylor, J.A., Smith, R.T. (Eds.), ‘The Bracken Problem: Risks and Challenges’. International Bracken Group, Leeds.
Schaefer, G.W., Allsopp, K., 1983. Spray droplet behaviour above and within the crop. Proc. 10th Int. Cong. Plant Protection, Brighton, 1057–1065.
Stewart, R.E., Gratkowsky, H., 1976. Aerial application equipment for drift reduction. USDA Forest Service General Technical Report PNW-54.
Tate, R.W., 1977. Droplet size distributions for drift reduction nozzles. ASAE Paper No. 77–1503.
Tooby, T.E., 1997. Buffer zones: their role in managing environmental risk. Proc. 1997 Br. Crop Prot. Conf. Weeds, pp. 435–442.
Ware, G.W., Cahill, W.P., Estesen, B.J., 1975. Pesticide drift: aerial application comparing conventional flooding vs. Raindrop nozzles. J. Econ. Entomol. 68 (3), 329–330.
Wilson, C., 1995. USDA Spray Drift Task Force — 1995 Bulletin. European Crop Protection Association Circular C/95/TR/395 (12/5/95), 8 pp.