ALL-IN-ONE LASER SCANNING METHODS FOR SURVEYING, REPRESENTING AND
SHARING INFORMATION ON ARCHAEOLOGY. VIA FLAMINIA AND THE FURLO
TUNNEL COMPLEX
P. Clini a, *, R. Nespeca a, A. Bernetti a
a DICEA, Dept. of Civil and Building Engineering, and Architecture, Polytechnic University of Marche, Ancona, Italy -
(p.clini, r.nespeca)@univpm.it, [email protected]
KEY WORDS: Laser scanner, Archaeological survey, Cultural heritage, Documentation, Historical infrastructure
ABSTRACT:
The aim of this paper is to describe the results of the laser scanner survey of an archaeological complex, aimed at knowledge, documentation and diagnostic operations to make premises secure. Archaeology has always been the most complex subject where the discipline of surveying is continually being put to the test and experimented with. The development in laser scanner technologies has led to an extremely important turning point in this field. Complex geometrical shapes or irregular surfaces, such as those in archaeology, are defined through surfaces that can be directly extrapolated from the point cloud with extremely high precision, allowing even the finest details to be mapped. The precision of this surveying technique together with the wide range of data that can be acquired and represented provide several opportunities for communication and investigation. This experimental work has concentrated on the Furlo tunnel complex, located along one of the most important infrastructural arteries from Roman antiquity, the Via Flaminia. The need in this case was to be able to acquire the entire rocky complex, extending the scan area as far as possible so as to assess the whole system in its entirety. The results of our metric and morphological survey provide an excellent basis for record the situation as it is today, so as to establish the initial temporal step to be used in future monitoring programmes. The accuracy of the survey allows static assessments and effective planning for future safety-oriented projects.
* Corresponding author. This is useful to know for communication with the appropriate person in cases with more than one author. 1. INTRODUCTION
“In the field of archaeology there are, in my opinion, no buildings or monuments to survey, but just buildings or monuments to be studied that cannot be understood without the survey.” These are the words of Prof. Cairoli Fulvio Giuliani in his preface M. Bianchini’s work entitled “Manuale di rilievo e di documentazione digitale in archeologia”. Archaeology has, because of its specific fragmentary dimension, always represented the most complex subject in which the discipline of surveying is continually engaging and putting itself to test. The development of scanner laser technology marks a very important development in this field. It has paved the way to unthinkable surveying and documentary possibilities. Any other surveying methodology demonstrates its actual limitations here, whilst the potential associated with the numerous and well structured elaborations of the point cloud and the photographic data associated with it are appreciated in full. So it is that fragmented and irregular volumes, such as those in archaeology, can easily describe themselves through the creation of surfaces obtainable from the cloud point with accuracy levels that are so very high as to allow a reading right down to the finest detail without having to incorporate any further surveying methods or instruments (Bini et al., 2006). In addition to providing a complete and unitary knowledge of an object, the full-dome scan of an archaeological artefact in its entirety also allows its reading in its unitary context of which, in archaeology in general, it is an integral part. The accuracy of surveying combined with the multitude of data that can be acquired and depicted is expressed in different communicative and investigative forms. Our work group has been trying out a methodology for around a year that, by exploiting the new
all-in-one laser scanner technologies, seeks to demonstrate the possibility of handling large quantities and qualities of the data acquired by one single instrument in the shortest possible time, focusing on the use of a tool traditionally considered as being costly and complicated to use in a logic of low-cost and expeditiousness. The laser scanner employed was a Leica ScanStation C10, a time-of-flight instrument, with resolution down to the millimetre, a 300 metre range and topographic functions for creating polygonals, with a built-in high-resolution photographic camera that acquires full-dome panoramics already aligned with the point cloud. The case study illustrated here in this work, has as its subject an archaeological complex that is almost impossible to survey using traditional surveying and photogrammetric techniques. We are in fact looking at the ancient tunnels of the Furlo, along the consular via Flaminia that are part of a single undifferentiated rock complex that that flanks a deep channel crossed by the Candigliano. In addition to its extraordinary morphological complexity, this rocky complex is characterised by systems of cracks of particular importance that directly involve the two tunnels as a whole (the large one, i.e. Vespasian’s tunnel and the smaller one, i.e. the Etruscan). Our survey set itself the goal of restoring the three-dimensional morphometric condition to the actual status of the complex at the end of its description for documentation and communication purposes, of its detailed morphometric analysis and the preparation of monitoring systems focussing specifically on the criticalities that only this type of survey can bring to light. What is more the survey aims to support the static evaluations and the plans for the works for making safe, allowing all the phenomena affecting the rocky area in its entirety to be treated and evaluated in an integrated way.
2. THE FURLO TUNNEL COMPLEX
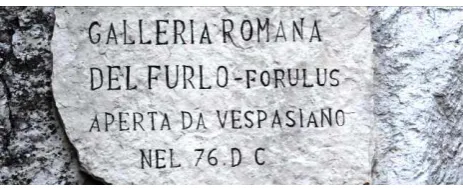
The Romans built a truly vast network of roads which has been estimated at 90,000 km in the case of larger roads and 200,000 for the smaller ones (Gille, 1985). Italy has only a few (less than twenty) tunnels that are datable to Roman times: some belonged to the network of major roads. Because of its location and its morphology, the Furlo tunnel is considered one of the most extraordinary examples of Roman civil engineering and is still used today by vehicles using the Via Flaminia. It is located close to the river Candigliano, 35 km from Fano and 248 km from Rome, in the section where the Via Flamia crosses the Apennine range. The route wended its way from the south-west to the north-east across a territory that in several places would have put even the most expert skills of roman road engineering to the test. To this day the Furlo Pass still presents itself as a mixture of ad hoc solutions designed to cope with a series of complex and unfriendly environments. An artificial terrace supported by imposing substructures was created between the vertical walls of the pass, with cuts into the rock and, where even these solutions were unworkable, with tunnels that for a long time aroused the amazement of travellers. To overcome a rocky spur that in the initial stage blocked the way, imposing terracing walls were created, almost 30 metres high, on which the road for bypassing the spur was to be laid. Subsequently a first smaller Etruscan age passage, 8 metres long, 3.30 metres wide and 4.45 metres high was created. It represented a connection with the two irregular surface texture entrances obtained using chisels on the upper walls, accurately cut on the vertical and well smoothed. The entrance to the east has a larger opening compared to that on the western side and the parallel tracks formed by the wheels of the carts are still visible on the rock’s surface (Luni, 1993). But the final solution only came with Vespasian who initiated the excavation of a second tunnel which since then has been in constant use, ensuring a way through the pass for two thousand years and giving its name to the place: firstly Petra Pertusa (pierced rock), then Forulus (tunnel). The work, completed between 76 and 77 AD, entailed the excavation of a 38-metre long, 5.47-metre wide section, with a height averaging over 5 metres. This tunnel, still in use, was carved out of compact limestone using a chisel, the step cuts of which remain visible. It now presents itself without any lining (De Sanctis, 2010). An inscription, still visible to this day above the western entrance of the big tunnel, recalls Vespasian’s work across the centuries (Fig. 2). The work called for the creation of an imposing cut of the rocky formation positioned immediately to the right of the first tunnel. The cut is clearly visible, as is the edge of the road’s original level, higher compared to today. In the 1920s an ashlar arch was created with the intention of strengthening the western entrance of Vespasian’s tunnel, and at the time of its construction it became the focus of criticism. The two entrances were originally embellished with pilasters carved into the rock, of which only one is still visible today at the western entrance (Agnati, 1999).
Figure 1. A clip from the equirectangular image showing the tunnel’s interior surface in detail.
Figure 2. Inscription wanted by Vespasian in 77 AD to commemorate the work carried in accordance with his
instructions
Figure 3. Eighteenth-century drawing showing the western entrance which had not yet undergone any work, the smaller
tunnel and the terracing.
3. FROM SURVEY TO 3D MODEL
Faced with such complexity there is also a need to carry out surveys in very short periods of time, given the continuous use of the tunnel that can only be closed for very short periods of time. Using a unique instrument, therefore, meant it was possible to schedule a survey run that could be completed in just one single day. A polygonal of ten full-dome scans was produced with a resolution grid of 1cm to 10m, and at the same time as the acquisition of the cloud, the related full-dome panoramas were obtained directly by the built-in high-resolution photographic camera (260 shots with the high-resolution of a single shot equal to 1920 x 1920 pixels). Thanks to the polygonal method, the alignment of the scans took place directly in situ and was only optimised in the post processing stage. Figure 4 shows the positioning of the stations in the topographic network created with the same instrument. The Mean Absolute Error value resulting from the Registration is equal to 0.001m. Considering the accuracy on the single point and the dimension of the spot in relation to the distance, a final
instrumental accuracy can be calculated that is equal to 8mm to 50mm, derived from the formula:
2
x, y = angular accuracies, depending on the angular accuracy of the instrument that is equal to 0.00006 mrad
z = accuracy over the distance and is worth 4mm
To evaluate the resolution adopted, we chose the qualitative parameter chosen by Bryan and Blake (Bryan et al., 2003):
s m
Q=1− (2)
where Q = quality of data
m = density of points on the object
s = minimum feature size or required point density
The Q value indicates minimum level at which the object should be scanned.
In this case, given the resolution chosen, the average distance from the object equal to 5 m and seeking to acquire the detail to the centimetre, a quality factor was calculated
5
that indicates a good confidence level of 50% with the object surveyed.
From the aforementioned values, considering the accuracy of acquisition, error in alignment and quality parameter of the resolution, we can affirm that the points cloud acquired had an accuracy that was below the centimetre and proved adequate for representing the surface surveyed.
Project Name: Galleria del Furlo, Date 18/09/2012, Start Time : 10.40 a.m. SW
Table 4. Log of the settings for the scans carried out in the campaign
Figure 5. Positioning of the scanning stations
Combined with the acquisition of the point cloud, the scanner also acquired high-resolution spherical panoramas, through the use of a built-in camera. The RGB value derived can be applied to single points or in the texturising phase of the continuous model. The navigation of the point cloud already allows for a first analysis consisting in the measurement of the morphological elements, through the navigation of the solid image with software such as Truview, then implementable by subsequent processing (Bianchini et al., 2010) .
Figure 6. Screenshots of the Truview software for navigating the solid image
Figure 7. Screenshots of the point cloud of the tunnel complex: prospect view of the western entrance.
The equirectangular images obtained, even with some of the limitations resulting from the characteristics of the built-in cameras, have enormous potential. First and foremost, that of mapping the discrete model with high detail. What is more, we find in literature a detailed demonstration of their metric content that could compensate some deficiencies in the laser survey (Barazzetti et al., 2010). But above all, they are essential instruments for visually inspecting, investigating and documenting, both for maintenance and repair work and for the publicising of the architectural heritage, which is the case study for this work.
Figure 8. Equirectangular image obtained from the spherical panoramic view taken by the integrated camera.
The usual cleaning and decimation phases were followed by the two-dimensional and three-dimensional elaborations.
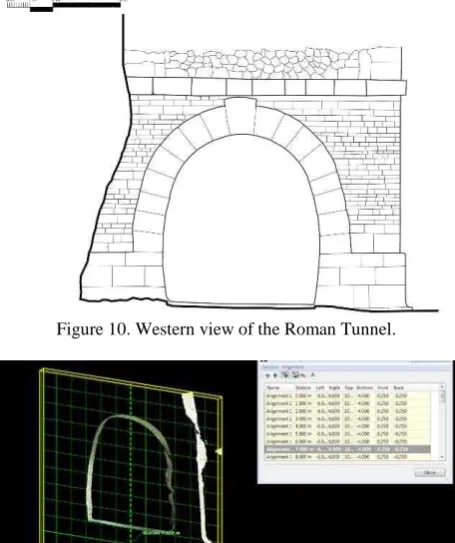
In order to correctly describe the interior surface of the tunnels, consisting of infrastructural arteries with a gangling development, sections with a constant step of 50cm were extrapolated over the entire length. Having pinpointed the median generating line, the surface sections chosen were the perpendicular ones. The contours of the tunnel can be described as a segmental arch, almost horizontal at the centre line, (as in Figure 10). Whilst the inclination of the north sidewall was particularly evident in the small tunnel. The continuous model was created with the triangulation of the cloud. The numerical model exported contained approximately 125 million points. The point cloud was then decimated into phases of importance, setting a low percentage of reduction and the automatic elimination of sound. The resulting DTM (Digital Terrain Model) contained 50 million triangles. The surface thus preserved a high detail and so maintained a significant metric quality. It was decided to divide the model into lighter partitions, in order to make manipulation easier. All the elaborations useful for knowledge, the planning of the work and the documentation of this astounding work - a display of ancient skills and know-how - were created from the solid image, the cloud and the photos.
Figure 9. Plan and cross-sections of the entire complex.
Figure 10. Western view of the Roman Tunnel.
Figure 11. Sections from the plot generated from within the proprietary software
Figure 12. Overall view of the sections on the plot for the geometric analysis of the interior excavated surface of the two
tunnels.
Figure 13. Three-dimensional model with mesh surfaces of the Etruscan tunnel.
4. DIAGNOSTIC INVESTIGATIONS USING A REFLECTION MAP
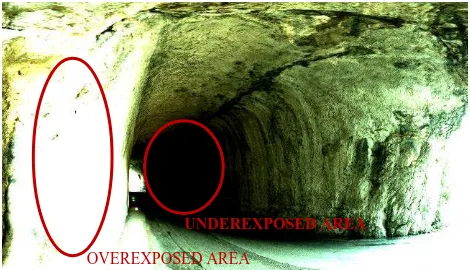
If, on the one hand, the interior’s lack of light did not allow the best photographic shots, on the other the reflectance maps generated by the laser helped to compensate for this instrumental limitation, to the point of providing highly valuable additional data. The C10 Leica laser scanner has a laser beam with a wavelength of 532nm in the visible spectrum. Even while being aware that it would not be possible to use the reflectance datum (R) from the laser in an absolute way - it not representing the response across the entire spectrum - but on one single waveband, we know that the application of R to the diagnostic field is a matter of investigation that is still in the process of being developed. Some tests, above all on the stone materials, have demonstrated the effectiveness of the datum even for evaluating the quantitative type of the phenomena of degradation (Zimbardo, 2011). In the case study presented in this work, the analytical-visual type potential of this datum is shown below. The painstaking choice of the chromatic scale, varying the parameters of the tonal range, resulted in the creation of significant reflectance maps that highlighted the status of the cracks and degradation of the material due primarily to moisture. The following image shows, even in greyscale, how by only varying the contrast of the image, it is possible to inspect visually, with a high detail, phenomena of variation of the reflectance, that photographic images would have had difficulty in capturing, given the lack of light and the need to take the shots quickly.
Figure 14. An image in false colours transformed into B&W highlighting the summit cracks and the degraded areas of the
excavated surface.
Figure 15. A clip from the equirectangular image taken by the laser scanner’s internal camera, showing the problems
associated with the exposure.
5. STATIC MONITORING AND STATIC EVALUATION – MAKING SAFE
A large crack in the rock was detected at the highest point of the arch that runs along the tunnel’s entire length. A crack located at such a significant point was bound to make us think about the static type aspects and the possible implications due to the site’s geological conditions. By processing the data provided through the scanner it was possible to investigate the actual situation in greater detail with regard to cracking situation with a view to tracking down the possible causes. What emerged from the observations on the three-dimensional model was that all the points that describe the fracture are almost all contained in a plane tangent to the arch of the tunnel, at the highest point and almost parallel with the surface of the road. This information, borne out by the metric findings made it possible to put forward hypotheses on the static situation of the complex of tunnels. If there were in fact any movements between the two limestone blocks close to the fracture, which were capable of compromising the static condition of the complex, what we might have expected was a displaced fracture, highlighted by a gap between the two sections. This is a phenomenon that it would not have been possible to describe through the pinpointing of a single plane containing all the points of the fracture. Thrusting or spreading between the limestone blocks would in all likelihood have generated an obvious misalignment close to the fracture, which however had not been appreciated even following an in-depth investigation of the points surveyed close to the crack. What is more, an inspection of the points surveyed in the intrados of the structure located at the western entrance of the tunnel, did not reveal any signs that pointed to a continuous lesion with the fracture, nor points that show the minimum deformations or an irregularity between the installed blocks. In conclusion, from the observations of the metric models obtained to this point it has been possible to put forward a hypothesis that the actual fracture represents a possible plane of discontinuity between the limestone formations, which probably preceded the construction work and which were nevertheless such as to not jeopardise its stability.
Figure 16. The use of the DTM to identify the plane of discontinuity that generated the crack visible in the intrados of
Vespasian's tunnel. OVEREXPOSED AREA
UNDEREXPOSED AREA
Figure 17. Reflectance images that show how the summit crack is not characterised by a perpendicular slippage between the two
fractures.
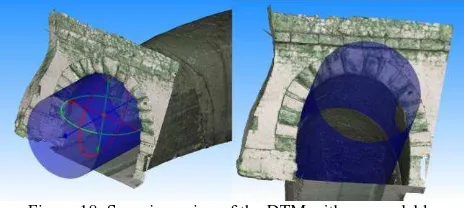
Figure 18. Superimposing of the DTM with a recordable cylinder in the intrados of the excavation, close to the western
entrance. Even this more recent structure shows no signs of perpendicular slippages on the surface.
6. CONCLUSIONS
The advantages of this method of working concern both the speed of the acquisition phase as well as the associated reduction in operating costs. In addition to having demonstrated the potential of the scanner survey in archaeological and geological field, in this study the intention is that of highlighting the possibility of an integrated use of all the data acquired.
The point cloud, the high-resolution spherical panoramas and the reflectance maps constitute a wealth of miscellaneous and complete data that allow repeatable and comparable analyses to be conducted over time. They provide operators with wide ranging possibilities for conducting metric, morphological and qualitative analyses. The vast quantity and quality of available data represents a database that can be adapted to different types of analyses in different fields of application. One need only think of the documentation possibilities available. Using viewing and navigation systems that are already commercially available, the dissemination and promotion of the historical heritage become noticeably easier. These advantages are easily applied to archaeological assets, the survey and modelling of which have always produced the greatest difficulties.
If, on the one hand, the numerous elaborations resulting from the laser scanner’s data have allowed us to make some suppositions on the actual static situation tied to the site’s geological features (that would otherwise not be obtainable using other comparable survey methods) on the other, they allow us to monitor the complex of tunnels in order to exclude the presence of alterations in the current equilibrium. Although the analyses conducted to this point do not show any particular emergencies concerning the safety of the rocky installation, these have been deduced from non-invasive type investigations that do not replace the traditional invasive investigative methods, but allow critical situations to be identified with speed and at low cost. We cannot totally rule out that stability could be compromised in the medium term, but through this unique instrument, it has been possible to put in place actions that will
allow possible changes in the actual situation to be monitored (Biason et al, 2004).
This paper has demonstrated how it is possible to conduct evaluations on the stability of a rocky installation, an archaeological artefact or extraordinary value, through the use of a 3D model that describes the object in detail. The outcome obtained provides us with the possibility of steering the choices for structural monitoring, and constitutes a guide for calibrating the subsequent stages of investigation.
7. REFERENCES
Adorno, V., Barnobi, L., La Rosa, F., Leotta, A., Paratore, M., 2009. Contributo della tecnologia laser scanner e termografia IR nella caratterizzazione geomeccanica di un costone roccioso. In: Atti 13a Conferenza Nazionale ASITA 2009.
Agnati, U., 1999. Per la storia romana della provincia di Pesaro e Urbino. L’erma di Bretschneider, Roma, pp. 499-510;
Barazzetti, L., Fangi, G., Remondino, F., Scaioni, M., 2010. Automation in Multi-Image Spherical Photogrammetry for 3D Architectural Reconstructions. In: The 11th International Symposium on Virtual Reality, Archaeology and Cultural Heritage VAST -2010. A. Artusi, M. Joly-Parvex, G. Lucet, A. Ribes, and D. Pitzalis (Editors);
Bianchini, C., Senatore, L.J., 2010. Metodi speditivi per la visualizzazione ed esplorazione interattiva di nuvole di punti. In: Metodologie integrate per il rilievo, il disegno, la modellazione dell’architettura e della città, Ricerca PRIN, ROMA: Gangemi Editore;
Biason A., Bornaz L., Rinaudo F., 2004. Monitoraggio di eventi franosi in roccia con tecniche laser scanner. in Bollettino Sifet,3/2004, pp.47-59;
Bini, M., Verdiani, G., 2006. Il rilievo delle archeologie monumentali: esperienze del laboratorio di rilievo della Sezione Architettura e Disegno di Firenze. In: Laser Scanner e GPS, paesaggi archeologici e tecnologie digitali, Ed. all'insegna del Giglio;
Bryan P.G., Blake B., 2003. An addendum to the metric survey specification for English Heritage - the collection and archiving of point cloud data obtained by terrestrial laser scanning or other methods. http://www.english-heritage.org.uk/upload/pdf/metric_extraction_scanning_ addendum_2.pdf;
De Sanctis, L., 2010. Quattro passi lungo la Flaminia. Itinerari di viaggio alla scoperta dell’antica via consolare in terra marchigiana. Grapho 5, Fano, pp. 56-61;
Gille, B., 1985. Storia della tecniche. Editori riuniti, Roma, pp.230-231;
Luni, M., 1993 La Flaminia nelle gole del Furlo e del Burano. Quattro venti, Urbino;
Zimbardo M. 2011. Valutazione dell’alterazione con laser scanner negli ammassi a struttura orientata e nella diagnostica dei beni monumentali”, Meccanica dei Materiali e delle Strutture, Vol. 2 no.1, pp. 41-51;