Innovation Technologies and Applications for Coastal Archaeological sites
FP7 - ITACA
A. Di Iorio a, *, D. Biliouris b, R. Guzinski c, L. B. Hansen c, M. Bagni d
a
ALMA Sistemi sas, Via Dei Nasturzi 4, 00012 Guidonia (Rome), Italy [email protected] b
Planetek Hellas EPE, 44 Kifisias Avenue, 15125 Marousi, Athens, Greece: [email protected]
c
DHI GRAS A/S, Agern Allé 5 DK-2970 Hørsholm Denmark,, [email protected]
d
Kell Srl, Via E. Q. Visconti, 8 00193 Roma, Italy [email protected]
KEY WORDS: Remote Sensing, Underwater archaeology, shape detection, SAR, Multispectral
ABSTRACT:
Innovation Technologies and Applications for Coastal Archaeological sites project (ITACA) aims to develop and test a management system for underwater archaeological sites in coastal regions. The discovering and monitoring service will use innovative satellite remote sensing techniques combined with image processing algorithms. The project will develop a set of applications integrated in a system pursuing the following objectives:
Search and location of ancient ship wrecks;
Monitoring of ship wrecks, ruins and historical artefacts that are now submerged;
Integration of resulting search and monitoring data with on-site data into a management tool for underwater sites;
Demonstration of the system’s suitability for a service.
High resolution synthetic aperture radar (TerraSAR-X, Cosmo-SkyMed) and multispectral satellite data (WorldView) will be combined to derive the relative bathymetry of the bottom of the sea up to the depth of 50 meters. The resulting data fusion will be processed using shape detection algorithms specific for archaeological items. The new algorithms, the physical modelling and the computational capabilities will be integrated into the Web-GIS, together with data recorded from surface (2D and 3D modelling) and from underwater surveys. Additional specific archaeological layers will be included into the WebGIS to facilitate the object identification through shape detection techniques and mapping. The system will be verified and validated through an extensive on-ground (sea) campaign carried out with both cutting edge technologies (side-scan sonar, multi beam echo sounder) and traditional means (professional scuba divers) in two test sites in Italy and Greece.
The project is leaded by Planetek Hellas E.P.E. and include ALMA Sistemi sas for the “shape detection” and dissemination tasks, DHI-GRAS and Kell Srl for multispectral and SAR bathymetry. The complete consortium is composed by eleven partners and the project Kick-Off has been held in January 2014. The present contribution aims to present the project research achievements and finding at the mid-term review.
1. INTRODUCTION
1.1 Project Consortium
ITACA is a project funded by European Union’s Seventh Framework Programme (FP7) started on January 2014 and it will last for 27 months. The Consortium is coordinated by Planetek Hellas E.P.E. (GR) and complemented by the following companies and organizations: ALMA Sistemi Sas (I), ANESTI Ltd (UK), CODEVINTEC Srl (I), DHI GRAS (DK), FFCUL (PT), I.EN.A.E. (GR), Kell Srl (I), NAIS Srl (I), Regione Sicilia (I), SME4SPACE VZW (B). For more information about ITACA project please visit the project website (http://www.itaca-fp7.eu ).
1.2 Statement of the problem
The universal value of the underwater patrimony of Mediterranean area is recognized internationally, since it witnesses historical relations and exchanges between peoples, states and territories. The transnational dimension of the underwater cultural heritage, as determined by the diverse origins of ships and their cargoes, imposed the codification of measures and definition of adequate protection instruments
even in view of its particular characteristics and the specific risks to which it is exposed. Underwater archaeological sites are threatened by a series of factors such as: a) alteration of shorelines, seabed or currents, due to human works and natural phenomena; b) the action of sediment and pollutants and c) the abuse and exploitation of natural resources. Organizations and international institutions involved in the stages of protection, conservation and development, in recent years have used models and experiences to encourage the active participation of the cultural heritage in the process of local development through the use of non-invasive technologies effectively available, positively repeatable and easy to use. The monitoring of the underwater cultural heritage is a priority of the competent Public authorities (Ministry of Cultural Heritage, Institutions and local entities) that shall assess their state of conservation and program restoration activities when required. These public bodies need cost effective, reliable and systematic means to accomplish their mission. In fact the survey activities should not affect the underwater site more than necessary, and the overarching aim is to preserve and protect a site as much and as best as possible.
makes possible the production of systematic survey of wide coastal areas. This information can be integrated with in-situ data providing the target end-user with an important management tool for underwater archaeological sites. This will improve their ability to look for, identify and preserve archaeological remains and will increase the size and complexity of data sets made available to the scholar and expert’s community. Furthermore the enhanced “virtual” fruition of the underwater site by using the ITACA results and products will also contribute to the general growth of tourism and associated industry.
1.3 System overview
In the frame of the ITACA project, high resolution synthetic aperture radar and multispectral satellite data will be combined to derive the relative bathymetry of the bottom of the sea up to the depth of 50-70 meters. The resulting data fusion will be processed using shape detection algorithms specific for archaeological items.
The availability of the above remote sensing data, combined with innovative processing techniques and optimized for archaeological site, enable the provision of a location and monitoring service for underwater archaeological sites in coastal zones.
The new algorithms, the physical modelling and the computational capabilities will be integrated into the Web-GIS, together with data recorded from surface (2D and 3D modelling) and from underwater surveys Additional specific archaeological layers will be included into the WebGIS to facilitate the object identification through shape detection techniques and mapping.
The system will be verified and validated through an extensive on-ground (sea) campaign carried out with both cutting edge technologies (side-scan sonar, multi beam echo sounder) and traditional means (submarine exploration with professional scuba divers). Test sites has been identified in Italy and Greece. A six months trial service on a selected coastal zone will be performed to provide a service demonstration; which will benefit the participant End-Users. The dissemination activities will include one international workshop and a final conference, organized in cooperation with the End-Users with the aim to let ITACA stakeholders be aware of the benefits of the developed technologies and service.
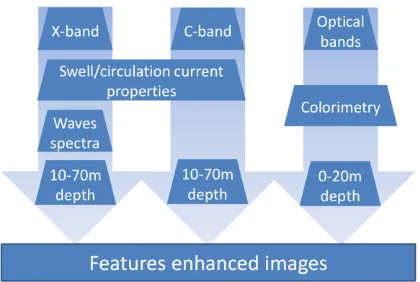
Regarding the relative sea bottom bathymetry extraction we need to mention that microwaves emitted by SAR can penetrate into seawater only to a depth which is small in comparison to the electromagnetic wavelength (mm scale). However, the underwater bottom topography is ‘imaged’ by synthetic aperture radar indirectly via surface effects based on the observation of hydrodynamic processes. Only relative spatial changes of the bottom relief can be estimated up to 50-70 m depth using new high resolution SAR data. Panchromatic and multispectral data of the same area will be used to integrate and overlap the SAR methodology for shallow water in the range 0-20 meter deep to build up a complete relative bathymetry layer in raster format. The following schema summarizes the processing chain proposed for the generation of a relative bathymetry map.
Figure 1. Remote sensing image processing chain
Input data come from three different kinds of sensors and, at first step, they are processed separately by using the methodologies identified in the following paragraphs. In the case of SAR, X-band sensors (TerraSAR-X or Cosmo SkyMed) and C-band sensors (ASAR) will be employed. Because the spatial resolution of X-band data is higher, it has been foreseen that the processing of wave spectra analysis for the computation of sea wave lengths will be applied only on these data. The spatial resolution of C-band data would not let algorithm track the same detailed changes of wave dynamics due to bathymetry. The data fusion of the above described processing chains presupposes a preliminary and necessary step of co-registration. The resulting bathymetry layer will be processed according to shape detection techniques tuned for underwater targets. Finally the resulting detection layer is integrated in a WebGIS system to display the results and providing monitoring capabilities of the site.
1.4 Web GIS
The ITACA Web GIS sub-system is the application in charge of visualizing the geographic layers and information produced and managed in the context of the ITACA project through a geographic viewer. The Web GIS sub-system, therefore, aims at offering a user friendly interface through which end users can map data in an interactive manner. They can zoom in, zoom out and move the map with high interaction to seek and identify areas of interest. This continuous user interaction produces, at the software level, subsequent requests from the Web GIS client to the map server. In order to increase the performance of the server and make the consultation of the data more efficient and fluid, in the Web GIS sub-system development the following techniques will be implemented to display the data:
• Tiling maps
Thanks to TMS (Tile Map Service), it is possible to call up a map dividing it into multiple pieces (tiles) and rebuilding, through the various pieces, the requested map on the client side. This offers huge benefits in terms of increased performance of the map server.
• Caching maps
information already shown to the user in the past. This technique is very important to increase the speed of interaction between the user and the display of maps. Access to the Web GIS client is allowed upon authentication. Once logged in, the user is shown an index page, which shows the site areas for which the user is authorized. With one click on the link to the area of interest, the user accesses the Web GIS viewer. A default page or a default area might be shown to anonymous users.
Figure 2. Example of WebGIS
An example of Web GIS snapshot is shown in the above figure.
2. SAR BATHYMETRY
In 1969 the capability of radars to detect underwater bottom features, such as sandbanks or shoals, down to depths of tens of meters below sea surface, was discovered. Further studies have shown that this phenomenon appears in ocean regions with strong tidal currents (≥0.5 m/s) and under moderate wind speed (3-12 m/s). Several theoretical models have been developed in order to relate hydrodynamic processes to sea bottom topography in case of shallow water. Some proposed procedures use the observed wave dynamics for the definition of depth map: they use the effects of modification of surface currents and ocean waves due to bathymetry. The general phenomenon can be decomposed in the following three steps:
o Interaction between tidal flow and bottom topography produces variations in the current velocity at the sea surface.
o Variations in the surface current velocity give rise to
modulations in the wind generated spectrum of water waves and therefore in sea surface roughness.
o Modulations in the surface roughness cause variations in the radar backscatter and therefore they show up as amplitude modulation in radar images.
Obviously, each step of the reported imaging process must be properly modeled to have quantitative bathymetric data retrieval from SAR images. The first example of quantitative complete modeling of bathymetric imaging by SAR has been developed by Alpers and Hennings in 1984 and, despite some oversimplifications, their model became the basis for the development of SAR based products for bathymetric reconstruction. The model proposed by Alpers and Hennings [1] explains the observed modulation of sea surface roughness, which affects the radar backscatter, with the presence of underwater structures, when strong (tidal) currents are present. The spatial change of the strong currents induced by bathymetric variations and explained in the model with the mass conservation law produces the modulation of surface short waves, which in turn gives rise to changes in radar reflectivity.
Thus, underwater bottom topography becomes visible in radar images by variation of image brightness [2]. Alpers and Hennings verified the applicability of their model and used bathymetric information derived from nautical charts to estimate the expected image intensity modulation. Measured and theoretical modulations were found to coincide for specific values of relaxation rates which were in agreement with previous studies on that parameter. The approximations introduced by Alpers and Hennings are very useful to describe qualitatively what is then observed in SAR images but their analytical model represents an extremely strong simplification if SAR images have to be used for cartographic purposes, that is to derive bottom bathymetry. The linear model underestimates the modulation depth, especially for high-frequency (C-, X-band) SAR images; the location of the peak of SAR backscattering is often mis-modelled by the linear relation with respect to the peak of current velocity, i.e. to the peak of bottom topography; the Action Balance Equation (ABE) is the crucial aspect in bathymetric reconstruction since the effects of surface current velocity on the surface short wave spectrum is the less assessed modeling step. In order to overcome this limitation, Inglada and Garello proposed an inverse approach: this model relates the SAR image to surface current or current gradient and it can be inverted [3] [4]. Inglada and Garello developed this model by resolving the ABE with the expansion of the action
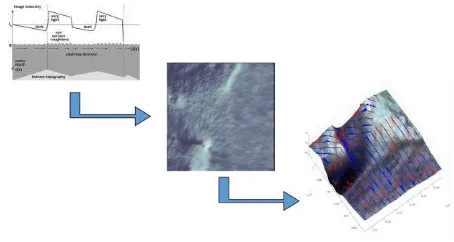
Figure 3. SAR bathymetry process and results
Figure 4. Levanzo island, Sicily. Reference Bathymetry (100x100m) on the left and SAR Computed Bathymetry
(25x25m) on the right
The increase in the details can be better appreciated in the following image where the comparison is performed superimposing the contour lines generated from the two DEM.
Figure 5. . Levanzo island, Sicily. Contour Lines: Reference (coarse) vs. Computed (fine)
3. MULTISPECTRAL BATHYMETRY
The multispectral bathymetry mapping method is based on the principle of minimising the difference between observed and modelled water-leaving reflectance in a number of spectral bands. The observed reflectance is collected by satellite-based very-high resolution multispectral sensors, e.g. WorldView-2 with spatial resolution of 1.6 m and 6 spectral bands in the visible part of the spectrum. The modelled spectrum is derived based on benthic albedo, water depth and three water quality parameters following the semi-analytical methods introduced by the studies of Lee [14] and Klonowski [15]. Bathymetry is extracted from the set of values of the model parameters which achieve the minimum difference between the two spectra. Due to the complexity of the minimization search space, and due to the limited information content provided by multispectral sensors (as opposed to hyperspectral sensors for which the semi-analytical methods were designed), the minimization has to be performed using a constrained, global optimization algorithm with the constraints chosen on scene-by-scene basis. The spectral matching approach requires accurate values of the observed water-leaving reflectance. Therefore, it is important to perform careful atmospheric correction of the satellite-observed top-of-atmosphere reflectance. This is achieved by employing the 6SV radiative transfer model 16]. Furthermore, sun-glint effects on the water surface, caused by waves or illumination
and observation geometry, are minimised using a number of established techniques [14] [17].
Certain amount of noise is to be expected in the output bathymetry maps, even after careful input data pre-processing and proper parameterization of the bathymetry retrieval algorithms. Therefore, the derived bathymetric maps undergo post-processing before being passed further down the ITACA processing chain. This involves impulse pixel removal, which is based on comparing each pixel’s value with the values of its neighbours. If the value differs by more than a certain threshold with more than a certain number of neighbours, then that pixel’s value is replaced by the median of the values of its neighbours [18]. Additionally, the bathymetry quality layer produced by the semi-analytical models can be used to treat low-quality pixels as impulse pixels and replace their values by those of their neighbours or to mark them as invalid.
Figure 6. Example of WorldView-2 based derived bathymetry for a shallow water Fjord in Denmark.
4. SHAPE DETECTION
A shape recognizer has to identify an object shape according to a set of predefined shapes contained in a limited database. It receives an object, described in raster or vector format, ideally of arbitrary size and with any orientation, and outputs a result. Traditional approaches for shape recognition always try to achieve the best recognition rate for the identification of the object under analysis. However, the majority of them have limitations either in terms of the orientation of the shape, supporting only objects aligned with the axes, or in terms of the completeness of the shape, requiring that the shape is completely defined without missing parts, or in terms of similar shapes, not offering a mechanism to deal with ambiguities in the recognition process.
The basic principle is the a priori knowledge of the searched shape and the use of a tailored version of the optimal step edge operator. However the adaptation to different orientation was limited to manual operations [11]. Figure below illustrate some of the results of the HORUS project in Egypt.
Figure 7. Detection of Archaeological Sites within the End-user GIS System: Serapeum test case. Quckbird data res 1 m (the
researched shape is shown on the left).
In the ITACA project we need to recognize partial shapes, which correspond to objects that are partially buried, arbitrarily rotated objects, imprecise contours of the shapes and objects that could present similar shapes. We plan to innovate in the shape recognition part of the ITACA project by enhancing the shape matched operator used in HORUS and combine it with new algorithms for shape recognition and feature extraction such as Hu’s moment and log-polar algorithms and Fuzzy Logic techniques. These techniques were already used in the past, with success, by one of the partners to recognize regular shapes, such as, rectangles, triangles, circles, etc. [12]. Here we plan to take advantage of these algorithms to recognize more general shapes, disambiguate similar shapes and also to deal with incomplete shapes. Fuzzy logic is a good tool to deal with uncertainties since it allows the definition of fuzzy “regions” where an object can be more than one shape. In particular we plan to use fuzzy sets to describe the different geometric features that will be used to describe the different elements of the potential vocabulary of shapes related to the context of the project.
The idea is to use a combination of algorithms to recognize shapes regardless of their orientation, scale and completeness. With the introduction of the fuzzy logic we will also transfer the final decision of the recognition process to the user side. Instead of having the system taking the decision of selecting only one shape for the object under analyses, it can suggest to the user two or more shapes for the object and give the user the freedom for selecting the correct shape. The user decision will be supported by the recognition system, which will provide a list of possible shapes and the correspondent degree of certainty associated to each shape.
The actual implementation of the algorithms has started and preliminary results are hereunder shown. Three different algorithms (Hu moments, log-polar and DOuble Derivative Exponential-DODE) have been tested on the same sample images for searching a specific “fish tale” in a picture full of fishes oriented in all the directions and with different size.
Figure 8. Shapes to be searched. “Fish tale” (left) and Amphora (right)
Log-polar and Hu moments successfully detected five instances of “fish tales” (see fig. 8 left) in different subjects and condition
of illumination (see fig.9, red squares). Please note the algorithms has been instructed to stop after having found five instances of the shape to be searched for computational time.
Figure 9. Results of shape detection for log-polar algorithm
As expected the DODE algorithm is much faster but only identified the exact match with the fish tale used for shape to search (see fig 10 below).
Figure 10. Results of shape detection for log-DODE algorithm
Preliminary test results and comparison between the three algorithms are shown in the following table.
DoDE HU’s o e ts Log polar
Orientation NO best results good results
Scale NO YES YES
Performance It only matches shapes according the edge, with the same orientation
Includes colors in the search.
Better response on different size of the shape to be found
Speed faster slow slow
Res. Consuming low high high
Gen Performance low high medium
Table 1. Comparison between different shape detection algorithms
shape with a good likelihood (more than 60%), it will mark the object recognized.
In a second step, we will convert the raster images (in particular the boundaries of the objects identified previously) into a vectorial format, using for instance the chain coding algorithm or a more specific technique like the Freeman technique [13]. This conversion will make the images suitable for the application of the new recognition algorithms based on Fuzzy Logic, which will take advantage of the vectorial format of the objects by exploring their geometric features [19].
An example of results of this algorithm is shown in the figure below where the shape to be found in the one shown in figure 8 (right).
Figure. 11. Results of shape detection for Fuzzy Logic algorithm
We also plan to use Fuzzy Logic techniques to solve ambiguities among similar shapes and to associate degrees of certainty to the identified shapes.
It has been planned in the frame of the project to apply the same algorithms to both satellite images for search of shipwreck and to sub bottom profile images derived by side scan for detail search of small objects i.e. amphora’s, cannons, ship rosters and the like.
5. SEA CAMPAIGN
The demonstration campaign can be divided into three steps: verification using existing or procured data sets, validation including real trial cases (field campaign) and six months of trial services for the selected areas. These steps will address two user test cases: a) Search and location of ancient ship wrecks and b) Monitoring of ship wrecks, ruins and historical artefacts that are now submerged. Validation of the project results will be provided in the following test sites:
o Italy (Egadi Islands, Sicily) where a detailed field campaign will provide detailed 3-D maps.
o Greece (Metohi, Northen Greece) targeting both user test cases a) and b) where possible new discoveries are expected and field campaign will be provided using both 3-D technique and traditional methodologies (e.g. scuba diving exploration). The above mentioned underwater sites have been selected after a preliminary analysis and shall be regarded as a preliminary selection. The demonstration task includes the implementation of 6 months of detection and monitoring trial service for the End User Coordinator on selected sites. A selected area will be kept under monitor control to demonstrate the pre-operational readiness of the proposed service.
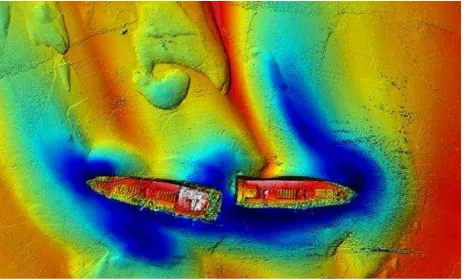
The field campaign will be carried out by Codevintec Srl under the supervision of “Soprintendenza del Mare della Sicilia” for the Italian Test Case and Hellenic Institute of Marine Archaeology for the Greece test case. For each test site will be carried out a low and high resolution survey using sounder radar (Multibeam: RESON Seabat 7125 Sv2 200/400Khz), measurement probe, water column probe and navigation and data processing software (Reson PDS2000 MB Survey and Office w/ Cube). Data will be processed in order to produce: for low resolution survey a 2D map with contour line and depth in regular grid and for high resolution survey the 3D images of the object (see example below).
Figure. 12. Ship wreck recorded using side-scan and processed
6. CONCLUSION
ITACA will provide innovative, affordable solutions and novel “tools” to improve the management of underwater sites of archaeological interest.
The project will mainly focus on the technical aspects of the proposed innovative methodologies but it will also take into account their impact in terms of cost savings, new products for the markets and improved response of the public authorities in charge of the underwater cultural heritage safeguard. In this respect it is worth noting the participation of “Soprintendenza del Mare della Sicilia” (public authority in charge of safeguard of the Italian underwater cultural heritage along the cost of Sicily,
http://www.regione.sicilia.it/beniculturali/archeologiasottomarin a/ ) and the Hellenic Institute of Marine Archaeology (HIMA, www.ienae.gr ) representing the scientific community, both of them as full member of the consortium.
The project started in January 2014 and activities are currently on-going. The present article summarize the results achieved by the project at the mid-term review and before the start of the demonstration campaign.
REFERENCES
1. Alpers, W. and I. Hennings: A theory of the imaging mechanism of underwater bottom topography by real and synthetic aperture radar. Journal of Geophysical Research, 99, pp 10529-10546 (1984).
3. J. Inglada and R. Garello. Volterra model for the imaging mechanism of ocean surface currents by synthetic aperture radar, Proc. Proc. IEEE Int. Geoscience Remote Sensing Symp. IGARSS’99, 1999, pp. 2551-2553 (1999).
4. J. Inglada, R. Garello, On rewriting the Imaging Mechanism of Underwater Bottom Topography by Synthetic Aperture Radar as Volterra Series Expansion, IEEE Journal of Oceanic Engineering, Vol. 27, No. 3, pp. 665-670, (2002). 5. Lee, Z.; Carder. K.; Mobley, C.; Steward, R.; Patch, J.
Hyperspectral remote sensing for shallow waters: Deriving bottom depths and water properties by optimization. Applied Optics, 1999, V.38 N.18, 3831-3843 (1999). 6. Lyzenga, D.; Malinas, N.; Tanis, F. Multispectral
Bathymetry Using a Simple Physically Based Algorithm IEEE Trans. GeoSci. Remote Sens. 2006, 44, 2251-2259 (2006).
7. Lyzenga, D. Passive remote sensing technique for mapping water depth and bottom features. Applied Optics, 1978, 17, 379-382 (1978).
8. Stumpf, R.; Holderied, K.; Sinclair, M. Determination of water depth with high-resolution satellite imagery over variable bottom types. Limnology and Oceanogr., 2003, 48, 547-556 (2003).
9. A. Di Iorio and others: ESA Data User Element project HORUS (Heritage, Observation and Retrieval Under Sand) web page http://due.esrin.esa.int/prjs/prjs89.php
10. I. Bridgwood, A. Di Iorio: Heritage, Observation and Retrieval Under Sand Final Report.
http://due.esrin.esa.int/prjs/Results/131-176-149-30_200852141443.pdf
11. Di Iorio A., Straccia N., Carlucci R.: Advancement in automatic monitoring and detection of archaeological sites using a hybrid process of Remote Sensing, GIS techniques and a shape detection algorithm Proceeding of the 30° EARSel Symposium, Paris, France (2010).
12. M. J. Fonseca, J. A. Jorge, Using Fuzzy Logic to Recognize Geometric Shapes Interactively, 9th International Conference on Fuzzy Systems (FUZZ-IEEE'00), pp. 191-196, San Antonio, USA, (2000).
13.H. Freeman, “Computer Processing of Line-Drawing Images,” ACM Comput. Surv., vol. 6, 1974, pp. 57-97 (1974).
14. [Lee] Lee, Zhongping, Kendall L. Carder, Curtis D. Mobley, Robert G. Steward, and Jennifer S. Patch. "Hyperspectral remote sensing for shallow waters. 2. Deriving bottom depths and water properties by optimization." Applied Optics 38, no. 18 (1999): 3831-3843.
15. [Klonowski] Klonowski, Wojciech M., Peter R. Fearns, and Mervyn J. Lynch. "Retrieving key benthic cover types and bathymetry from hyperspectral imagery." Journal of Applied Remote Sensing 1, no. 1 (2007): 011505-011505.
16. [Vermote] Vermote, E., D. Tanré, J. L. Deuzé, M. Herman, J. J. Morcrette, and S. Y. Kotchenova. "Second simulation of a satellite signal in the solar spectrum-vector (6SV)." 6S User Guide Version 3 (2006).
17. [Lyzenga] Lyzenga, David R., Norman P. Malinas, and Fred J. Tanis. "Multispectral bathymetry using a simple physically based algorithm." Geoscience and Remote Sensing, IEEE Transactions on 44, no. 8 (2006): 2251-2259.
18. [Garcia] Garcia, Rodrigo A., Peter RCS Fearns, and Lachlan IW McKinna. "Detecting trend and seasonal changes in bathymetry derived from HICO imagery: A case study of Shark Bay, Western Australia." Remote Sensing of Environment 147 (2014): 186-205.