Gadjah Mada International Journal of Business
Vol. 20, No. 1 (January-April): 33-58
Do We Need a Mandatory Dividend Regulation?
The Case of the Indonesian Capital Market
Leo Indra Wardhana,
1*and
Eduardus Tandelilin
21 Department of Economics and Business Vocational College. Universitas Gadjah Mada, Indonesia 2 Faculty of Economics and Business - Universitas Gadjah Mada, Indonesia
Abstract: This study examines the dividend life-cycle hypothesis and the propensity of non-financial firms listed on the Indonesia Stock Exchange (IDX) to pay dividends, in light of a recent idea by the IDX to regulate dividend payments. Using several proxies of the life cycle, the results consistently show that Indonesian listed firms follow the dividend life-cycle hypothesis. Our results recommend that if the authority insists on regulating dividend payments, the regulation should take into account the firms’ life cycles. Firms should only be required to pay dividends when they reach a certain stage and/or meet defined characteristics, according to their stage or characteristics.
Keywords: dividend life cycle; dividend policy; earned/contributed capital; Indonesia Stock Exchange; propensity to pay dividends
Introduction
Developing countries have characteris-tics which include having a transitional economy, high economic growth, and some play a bigger role in the world economy as emerging markets. One of their particular characteristics is that most of the emerging market countries have weaker rules, and their corporate governance practices vary widely from one firm to another (Black 2001). Con-sequently, this influences how firms behave with their strategic decision making, for in-stance in their dividend policy (Mitton 2004). A vast literature of studies on dividend poli-cies in the developed countries is readily available, yet it is still one of the most puz-zling subjects in corporate finance over the past fifty years. Meanwhile, there is less em-pirical evidence available from developing countries, taking into consideration that there might be significantly different practices and phenomena between the two. Besides the dif-ferent practices of corporate governance and the macroeconomic environment, different legal constraints also make dividend policies vary widely among countries (La Porta et al. 2000; Goyal and Muckley 2013).
In their seminal paper, La Porta et al. (1998) argued that countries with a civil law origin tend to have lower investor protection and have higher barriers to the development of their capital markets. Such a situation im-plies a social cost, and thus it is necessary for civil law countries to find alternative ways to reduce this social cost (Martins and Novaes 2012). In fact, to deal with this situation, some civil law countries i.e. Brazil, Chile, Colom-bia, Venezuela and Greece, have adopted some alternative ways, for example by using a rule that mandates companies to pay
divi-dends. The low adoption of this rule is be-cause other countries believe that mandatory dividend rules might limit companies’ abili-ties and opportuniabili-ties to invest and to grow further, and therefore there is a trade-off be-tween costs and benefits, i.e. protecting mi-nority shareholders’ rights vs. firms’ growth opportunities (Martins and Novaes 2012). Furthermore, recent findings show that divi-dend policies follow the life cycle (DeAngelo et al. 2006; Denis and Osobov 2008; Von Eije and Megginson 2008; Fatemi and Bildik 2012; and Fama and French 2001), which implies that if the regulator sets a mandatory dividend rule, it may harm the firms that are in the early life-cycle stage. However, the findings of Martins and Novaes (2012) indi-cate that this is not the case in Brazil, as the mandatory dividend rule does not significantly interfere with companies’ investment plans. Based on this experience, other civil law coun-tries might want to start regulating dividends and making them mandatory. Indonesia, for instance, has been pondering the idea of making such a rule since 2013. Indonesia is a developing country and the largest economy in Southeast Asia. Like many other develop-ing countries with relatively weak corporate governance, the regulator has been concerned about corporate governance practices in In-donesia. The most recent case is about the dividend payments of firms listed on Indonesia’s capital market, i.e. the Indonesia Stock Exchange (IDX).
growing number of listed firms on the IDX, the percentage of firms that pay a dividend seems to remain the same. The IDX’s author-ity finds this to be an unfavorable situation, especially for good corporate governance practices and ultimately for Indonesia’s invest-ment climate. They argue that paying divi-dends is one of the indicators of good cor-porate governance practice, and investors do not only want capital gains but also dividends. Therefore, in early 2013 the IDX proposed to enact a stricter regulation on the payment of dividends, that included: (1) The minimum frequency for paying dividends in a particu-lar period of reported positive net income, (2) the minimum amount of net income to be distributed as dividends, and (3) the sanc-tions for non-compliance.2 Despite lacking empirical evidence, the authority seems to insist on making such a regulation. Yet, imple-menting this regulation is not a clear-cut is-sue, and there are pro and contra arguments from the stakeholders.
This mandatory dividend plan has been facing a great deal of opposition. The two largest stakeholders in the capital market, the Indonesian Securities Company Association (Asosiasi Emiten Indonesia/AEI) and the Indonesia Corporate Secretary Association (ICSA) were not immediately on board with the idea of regulating dividend payments, but they finally agreed to consider the plan sub-ject to the content.3 However, as we are now at the beginning of 2016, the IDX has still not produced a finalized draft containing the technical and operational terms of the pro-posed regulation, for further review and
dis-cussion. This provides us with the opportu-nity to investigate the situation further. Be-fore implementing the mandatory dividend, first we need to comprehend why firms do not pay dividends and understand the pros and cons of the mandatory dividend regula-tion.
From the corporate finance point of view, there are reasons why a mandatory divi-dend is necessary and why it also can be harmful for firms. Paying a dividend can re-duce the agency conflicts, which means im-proving corporate governance while at the same time it may hamper firms in realizing their growth opportunities, as it reduces their internal capital (Martins and Novaes 2012).
Like many other emerging market coun-tries in Asia, Indonesia has been experienc-ing high economic growth, with average GDP growth of 5.66 percent during the last ten-year period while the rest of the world was in an economic downturn between 2009 and 2012.4 Indonesia has emerged from the 2008 financial crisis without any substantial dam-age, signaling recognition of its strong eco-nomic growth. Yet, Indonesia is also facing corporate governance problems, such as weak investor protection (La Porta et al. 2000; and La Porta et al. 1998), concentrated ship (La Porta et al. 1999), pyramidal owner-ship (Faccio et al. 2001), family business en-trenchment (Bennedsen et al. 2007; and Cucculelli and Micucci 2008) and the issue of massive corruption that might exacerbate the risk of expropriation, where the majority shareholders tend to maximize their benefit by diverting their firms’ cash flows at the
ex-2 Indonesian Stock Exchange aims to finalize regulations on dividend payments this year (BEI Target Aturan Dividen Selesai Tahun Ini ). Republika Online, 23rd of February 2013.
3 Market participants responding to regulations on dividend payments (Pelaku Pasar Merespons Aturan Pembagian Dividen ), Indonesia Finance Today, 19th of March 2012.
pense of the minority shareholders. These all suggest a vulnerability to high agency prob-lems between the majority and minority share-holders. Data from 2014 shows that the cor-ruption perception index ranked Indonesia 107th out of 174 countries.5 Moreover, Indo-nesia adopts French civil law, which is asso-ciated with poor investor protection (La Porta et al. 1998). For the ownership structure problem, a report by BAPEPAM-LK (2011)6 shows that the average public ownership from 2007 to 2011 was only 25 percent, indicat-ing a concentrated ownership structure. In such an ownership structure, the controlling shareholder usually has power over the man-agers and the AGM to decide the dividend policy (Gugler and Yurtoglu 2003). Some empirical findings for developing countries show that the majority owners or insiders do indeed influence the dividend policies (Fairchild et al. 2014; Hamill and Al-Shattarat 2012; and Mitton 2004). Mahadwarta and Ismiyanti (2008); and Carney and Hamilton-Heart (2015) show that the majority owner-ship on the IDX is dominated by corporate ownerships that are related to the founding family, which may exacerbate the expropria-tion risk. The current situaexpropria-tion implies that Indonesia has promising growth opportuni-ties, while investors may perceive the expro-priation risk is still relatively high. Will man-datory dividends fix the governance issue or impede the realization of high growth oppor-tunities?
From the agency theory perspective, not paying dividends might suggest an expropria-tion by the majority shareholder, i.e. paving the way to divert the firm’s free cash flow for their private benefit (Faccio et al. 2001; and
La Porta et al. 2000). In this instance, not paying dividends alleviates the agency prob-lems. The expropriation risk is even higher, particularly in countries with weak investor protection, since investors do not have enough power to disgorge the free cash flow from firms (La Porta et al. 2000). Thus, pay-ing dividends could be the solution to this agency problem as it reduces the free cash flow at the insiders’ disposal for their private benefit (Jensen and Meckling 1976). To some extent, paying dividends is signaling to the minority shareholders that the insiders do not expropriate them. In other words, paying divi-dends is a way to protect the cash flow rights of the minority shareholders. One might also argue that dividends are shareholders’ rights, and paying dividends might help to keep long-term investors and reduce the speculators in the stock market. In such a case, mandatory dividends could be the solution (Martins and Novaes 2012).
One can also argue that in an emerging market with a high economic growth rate like Indonesia, forcing firms to pay dividends might distort their investment plans, espe-cially when firms face high growth opportu-nities. The high growth rate of the country indicates that the growth rates of the firms, in general, are also high. In this case, retain-ing earnretain-ings to finance abundant investment opportunities might best serve the interest of all the shareholders. Firms possibly have dif-ferent circumstances, depending on their maturity and stage in the life cycle, e.g. the need for more capital for business expansion in the earlier phases of the life cycle, while in the later stages firms have abundant free cash flows as there are fewer investment
opportu-5 Source: transparency.org
nities (DeAngelo et al. 2006). Finally, one cannot expect all companies with positive earnings to pay dividends, as in the proposed regulation, because this may impede the firms from realizing their growth opportunities, and thus harm the shareholders. The later argu-ment might explain why many listed firms in Indonesia have not paid dividends. Clearly, there are two opposing views that do not make implementing mandatory dividends a clear-cut issue.
Although agency problems and low in-vestor protection can be the strongest argu-ments for a mandatory dividend rule, we need to ensure that such a regulation will not hinder the optimal growth of the firms. De-signing dividend regulations will prolong the endless debate between the stakeholders, as the purpose of the regulation itself is not aimed at an optimal dividend policy that maximizes the firms’ values, but to ensure the minority shareholders’ protection. Mean-while, there is less empirical evidence avail-able from developing countries, taking into consideration that there might be a signifi-cant difference in the practices of corporate governance and the dividend policy decision (Mitton 2004). Beside the different practices of corporate governance, the different legal constraints also make dividend policies vary widely among countries (La Porta et al. 2000; and Goyal and Muckley 2013). Therefore, this study uniquely investigates the propensity to pay dividends and its determinant on listed firms in Indonesia to seek an empirical ex-planation why many firms on the IDX have not paid dividends, and to assess if we need to apply a mandatory dividend regulation, and if the authority wants to apply the rule, what aspects must be considered in the regulation.
Dividend Life-Cycle
Hypothesis
Lease et al. (2000) illustrate a more com-plex dividend life-cycle scenario by consid-ering several market frictions that evolve throughout the life cycle: The severity of the agency problem, information asymmetry lev-els, shareholders’ equity tax, the flotation costs of issuing new equity, and the transac-tion costs, at each stage. A firm designs its optimum dividend policy, and adjusts it throughout its life cycle, depending on each condition it faces (the market frictions) to maximize its value. Lease et al. (2000) divided the life cycle into five stages: The first stage is start-up firms, followed by going public (IPO), rapid growth, maturity, and finally the declining stage. Figure 2 shows the dividend policy’s evolution through a firm’s life cycle. At the very beginning (stage) of the firm (start-up), the investment opportunities are very promising, and thus firms pursue a high growth strategy. Consequently, their capital requirements are enormous. Meanwhile, as a new small business, floatation costs and trans-action costs are still very high. Hence, issu-ing new stocks will be very costly. Sharehold-ers’ tax during this stage is also high, and thus paying dividends would make the owners pay even higher taxes. In such conditions, financ-ing the investment needs usfinanc-ing internally gen-erated capital (retained earnings) is the best option to optimize firm value. At this stage, the asymmetric information between insid-ers and outsidinsid-ers is extremely high, but the agency costs are almost nonexistent as the managers and the owners are still the same and the free cash flows are most likely nega-tive. Thus, again, dividends are also not nec-essary as there is no need to reduce the agency costs through dividend payments. Whereas in the more mature stages, investment oppor-tunities are declining and the agency conflict is getting higher as the operating cash flow is exceeding that required for investment. At the
same time, shareholders’ equity taxes are de-clining through institutional and corporate ownership, while floatation costs and trans-action costs are also getting lower. In such a situation, firms will pay more dividends to reduce the agency conflicts, thus maximizing the value of the firm.
The explanation above implies that the dividend life-cycle hypothesis may also give some hints as to when a firm is expropriating its minority shareholders through its dividend policy and when it is not. For instance, when a firm reaches the mature stage, where its cash flows are relatively abundant due to its in-creasing profitability and low investment op-portunities, it should have generous dividend payouts to maximize the firm value. Thus, when a mature firm does not pay dividends,
ceteris paribus, one might suspect expropria-tion. On the other hand, it is normal for an early stage firm to have no or very low divi-dend payouts, as in this stage it tends to be small, less profitable, and have abundant in-vestment opportunities. At this stage, a gen-erous dividend policy might indicate tunnel-ing. The life-cycle framework shows how firms design their optimal dividend policy accordingly; based on each situation they face during each life-cycle stage.
Data and Methods
Data and Sample
We use the year 1995 as a starting point for our observations, taking advantage of the availability of more accurate and reliable data, due to the automated system, as well as the fact that it was the year the capital mar-ket system was legally established. Moreover, by doing so, we were also able to examine the impact of the Asian crisis in 1997-1998 and the global financial crisis in 2008-2009. We use information from the firms’ an-nual reports to find their accounting and own-ership data, the Bloomberg database for mar-ket data, and the IDX’s summary of company performance for dividend information. Fol-lowing Fama and French (2001), we exclude highly regulated industries, such as the finan-cial and utility industries, and we also exclude firms with negative equity. The number of firms that meet our requirements is different for each year, due to newly listed firms. After excluding the financial and utility industries, firms with negative equity, those with incom-plete financial statement data, and those with extreme values, the final number of our sample for 1995 is 132 industrial firms and this number had become 309 by 2011. Our final sample is 2,600 firm-years.
Variable Definition
Dependent variables
The aim of this study is to provide em-pirical evidence to support the regulation’s formulation. Therefore, first we must under-stand why many firms listed on the IDX do not pay dividends or in other words, why the firms’ propensity to pay dividends is declin-ing. Following Fama and French (2001), we measure the propensity to pay dividends by
using a dummy variable, taking the value of one if the firm pays dividends and zero oth-erwise. We carefully trace the dividend infor-mation from the firms’ summary reports on the Indonesia Stock Exchange’s database, which report the precise dividend payments for each period, and assign the dummy vari-able accordingly.
Independent variables: Life-cycle proxies
Finding a life-cycle proxy that accom-modates various market imperfections as in the model of Lease et al. (2000) is difficult and tricky. The existing literature provided some measures of the life cycle, but the re-sults are inconsistent. First, we discuss the life-cycle measures in the literature.
infusion stage of its life cycle, rather than a later stage.7
Von Eije and Megginson (2008), using a sample of European firms, show that a firm’s age is a better proxy for the firm’s life cycle than earned equity. They do not find that RE/TE is able to explain firms’ propen-sities to pay dividends. The progress of the firms’ life-cycle stage is a function of time. The longer the firm continues to operate, the more mature it will be. Therefore, a firm’s age also can measure where the firm may be at in its life cycle. However, it is difficult to assign a company to the mature or declining phase based merely on a single proxy, and it cannot tell us in what phase of its life cycle the firm is at. Moreover, unlike RE/TE, age might be industry sensitive. Two firms with the same age but from different industries might be at different stages of maturity.
Finally, we consider the agency conflict in the cycle measure. Following the life-cycle model, we argue that more mature firms will have a higher free cash flow as they are more profitable and have less investment opportunities. Thus, firms with a high level of free cash flow are more mature than firms with a low level of free cash flow, regardless of the industry they are in. When free cash flow is high the agency problems between the majority and the minority are more severe because a high free cash flow would become the source of the agency conflict (Jensen 1986). For this reason, we use the amount of free cash flow to capture the life-cycle stage that incorporates the extent of the agency conflict’s severity.
Each of the three measures discussed previously catches a different aspect of the
firms’ maturity, which may be complemen-tary to each other. Nevertheless, although the correlations among them are significant at the 5 percent level, the coefficients of the corre-lation itself are small (see the correcorre-lation matrix in Table A1). This indicates that each measure captures a different aspect of the firms’ life cycles. Therefore, we combine these various aspects to capture the firms’ matu-rity by composing a life-cycle index (L-C In-dex). Another advantage of composing this life-cycle index is that we would have a simple index whose value could show the relative stage of development in the life cycle and more appropriately represent the firms’ rela-tive maturity level in the Indonesian market. We discuss the construction of the index in the following paragraph.
First, we divide our sample, from 1995 to 2011, into quartiles based on earned eq-uity, firm’s age, and free cash flow. We divide the firms into four groups, which represent the four stages of the dividend life-cycle framework of Lease et al. (2000), i.e. start-ing from the IPO to the declinstart-ing stage. We measure earned equity as retained earnings to equity (RE/TE), age as how many years the firm has been established (Age), and free cash flow as the net operating cash flow mi-nus capital expenditure divided by total as-sets (FCF/TA). Since three of them have the same direction, the higher the value, the more mature a firm is, we assign a value equal to one for firms that are in the first quartile, two for the second quartile, and so on. Then, we sum these three variables and divide by three, resulting in an index that has value ranges from 1 to 4, with the higher value indicating firms at a more mature stage of their life cycle on the IDX.
Although we have combined the exist-ing measures of the life cycle from the litera-ture to have a better one, as we explained earlier, the index comes with several limita-tions. The index does not take into account the industry difference, although we will con-trol for the industry effect on the estimation. It does not address several market imperfec-tions such as tax and firms’ financial con-straints directly, and it depends heavily on the assumption of Lease et al.’s model. The in-dex captures the severity of agency conflicts only through the free cash flows, but it is possibly also influenced by the ownership structure and other internal governance mechanisms of the firms, although we will also control for ownership structure as the internal governance mechanism in our esti-mations.
Control variables
We also include variables influencing dividend policies from the literature in our model specification. First, concerning the concentrated ownership structure of Indone-sian firms, where the controlling shareholder has the power to lead the Annual General Meeting (AGM) of shareholders and decide the firm’s strategic decisions, including the dividend policy, we use the voting rights of the largest shareholder to control its effect (Largest SH). Following Fama and French (2001), we control for the three firm charac-teristics i.e. profitability, investment oppor-tunities, and size. We used the return on as-set (ROA), market value of equity to its book value (M/B), and market capitalization of the firm over total market capitalization (Size) as the measures of profitability, investment op-portunities, and firm size respectively. We expect profitability and size to have a posi-tive relationship with the propensity to pay dividends, and be negative for investment opportunities. The literature shows that debt
Empirical Results
Univariate Analysis
Dividend payment trend
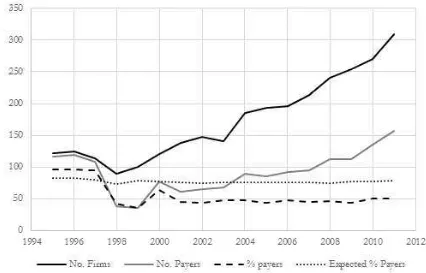
First, we display the dividend paying firms’ pattern to show the declining trend of dividend payments. Figure 1 presents the divi-dend paying firms’ trend on the Indonesia Stock Exchange for financial and non-utility firms from 1995 to 2011. The number of dividend payers shows a sharp decline in the years 1997 and 1998, which is possibly due to the financial crisis. It rebounds in 1999,
and since then it has had an increasing trend up to 2011, following the growing number of firms listed on the IDX. We can see from Figure 1 that the gap between the number of dividend payers and the number of firms is widening over the observation period. It in-dicates that the growth in the number of firms that pay a dividend is not as high as the growth in the number of firms. The line that shows the percentage of payers (% payers) gives us another clue. Despite the vast and growing number of firms, the percentage of dividend paying firms remains low and is noticeably stagnant after a sharp decline in
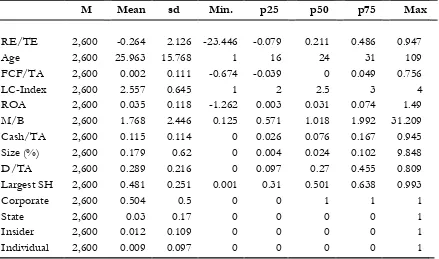
M Mean sd Min. p25 p50 p75 Max
RE/TE 2,600 -0.264 2.126 -23.446 -0.079 0.211 0.486 0.947
Age 2,600 25.963 15.768 1 16 24 31 109
FCF/TA 2,600 0.002 0.111 -0.674 -0.039 0 0.049 0.756
LC-Index 2,600 2.557 0.645 1 2 2.5 3 4
ROA 2,600 0.035 0.118 -1.262 0.003 0.031 0.074 1.49 M/B 2,600 1.768 2.446 0.125 0.571 1.018 1.992 31.209 Cash/TA 2,600 0.115 0.114 0 0.026 0.076 0.167 0.945 Size (%) 2,600 0.179 0.62 0 0.004 0.024 0.102 9.848 D/TA 2,600 0.289 0.216 0 0.097 0.27 0.455 0.809 Largest SH 2,600 0.481 0.251 0.001 0.31 0.501 0.638 0.993
Corporate 2,600 0.504 0.5 0 0 1 1 1
State 2,600 0.03 0.17 0 0 0 0 1
Insider 2,600 0.012 0.109 0 0 0 0 1
Individual 2,600 0.009 0.097 0 0 0 0 1
DDIV = dummy variable equals one if firm pays dividend and zero otherwise; Div/TA = dividends related to the period to total assets; RE/TE = retained earnings to total equity RE/TE = retained earnings to total equity; Age = firms’ age; FCF/TA = free cash flow to total assets; L-C Index = life-cycle index; ROA = return on assets; M/B = market value of equity to its book value; Size = firm market capitalization to total market capitalization; Debt/TA = long term debt to total assets; Cash/TA = cash holding to total assets; Largest SH = the percentage of shares of the largest shareholder; Corporate, State, Insider, and Individual are dummy variables equal one if the controlling shareholder (ownership >50%) is corporate, state, insider, or individual respectively.
1998. We also compute the expected prob-ability of paying a dividend during the obser-vation period (Expected % payers). Following Fama and French (2001), we predict the prob-ability of paying a dividend by using a logis-tic regression as a function of the firms’ fun-damental characteristics DDIV = f(ROA, M/ B, Size). We use a base period of 1995-19978 to estimate the coefficients for each firm’s characteristics. From the estimation, we use the estimated coefficient to get the expected percentage of payers each year from 1998 to 2012. The result, as in Figure 2, shows that it has a declining trend, although the slope is small. This indicates the declining propensity to pay a dividend. Whereas, the gap between
the expected payers and the real percentage of firms that pay dividends means that the firms’ characteristics are slowly changing. Using the dividend life-cycle framework, we propose a testable hypothesis that not many newly listed firms pay dividends while possi-bly not many older firms start paying divi-dends. In other words, this result provides the first indication that the firms’ dividend poli-cies on the IDX follow the dividend life-cycle hypothesis. In addition, Figure 2 adds another perspective to the phenomenon.
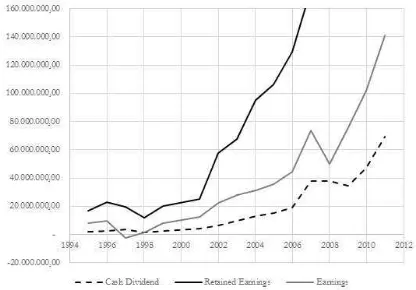
In Figure 2, there is an increasing trend of cash dividend amounts over the observa-tion period. Yet, as Figure 1 suggests, the percentage of payers seems to have no sig-Figure 1. Dividend Paying Firms on the Indonesia Stock Exchange (IDX) 1995-2011
Figure 1 describes the number of dividend payers in the period from 1995 to 2011, compared to the total number of firms on the Indonesia Stock Exchange (IDX). We excluded the financial and utility industries, and firms with negative equity.
Source: Authors computation
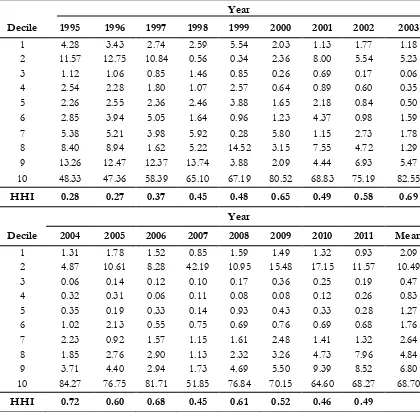
nificant growth, and may even be stagnant. It may also suggest that there is a concentra-tion of dividend payments. To examine this dividend payment concentration, following Von Eije and Megginson (2008), we calcu-late the Herfindahl-Hirschman Index (HHI) for the years 1995 to 2011. We present the result in Table 2. We sort a cash dividend payment by size, which is the firm’s market capitalization to the overall market. Then we divide it into deciles and calculate the per-centage of the cash dividend amount to the total cash dividend payment for the year on each decile to obtain the HHI. Table 2 shows that dividend payments are concentrated in the largest firms group (10th decile), with the highest concentration in year 2004. This
re-sult confirms that the cash dividend payments have been concentrated since 1995, and they were getting more concentrated until they reached a peak in 2004. After 2004, the con-centration gets lower but the average HHI is still higher than the HHI before the year 2000. However, we find something puzzling in Table 2. The firms in the second decile always became the second group whose divi-dend concentration is the highest while they were among the smallest firms on the IDX. We argue that size alone cannot be used as an indicator of firms’ maturity, and therefore we need a measurement that better catches a more comprehensive aspect of the firms’ life cycle. However, it is clear that Table 2 shows a consistent result regarding the dividend Figure 2. Cash Dividend and Earnings for IDX’s Firms 1995-2011
Figure 2 depicts the amount of the cash dividend and the earnings of firms listed on the Indonesia Stock Exchange (IDX) for the period from 1995 to 2011.
concentration. It may indicate that the divi-dend life-cycle hypothesis might be able to explain the dividend behavior on the IDX and why many firms do not pay dividends.
Life-cycle measures and propensity to pay dividends
Next, we analyze the relationship be-tween life-cycle measures and the propensity
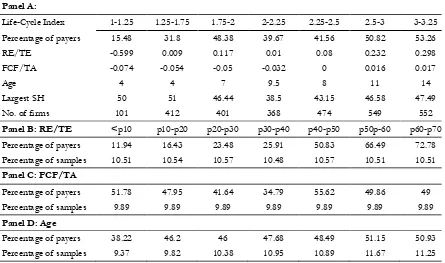
to pay dividends. We sort RE/TE, FCF/TA, and Age by the nine ranges of the life-cycle index and report the median of each range. The result is reported in Table 3 Panel A. RE/ TE, Age, and FCF/TA all indicate a strong positive relationship with the life-cycle index. This result confirms that three of the life-cycle measures have the same direction. How-ever, for the largest shareholder ownership
Year
Decile 1995 1996 1997 1998 1999 2000 2001 2002 2003
1 4.28 3.43 2.74 2.59 5.54 2.03 1.13 1.77 1.18 2 11.57 12.75 10.84 0.56 0.34 2.36 8.00 5.54 5.23 3 1.12 1.06 0.85 1.46 0.85 0.26 0.69 0.17 0.06 4 2.54 2.28 1.80 1.07 2.57 0.64 0.89 0.60 0.35 5 2.26 2.55 2.36 2.46 3.88 1.65 2.18 0.84 0.50 6 2.85 3.94 5.05 1.64 0.96 1.23 4.37 0.98 1.59 7 5.38 5.21 3.98 5.92 0.28 5.80 1.15 2.73 1.78 8 8.40 8.94 1.62 5.22 14.52 3.15 7.55 4.72 1.29 9 13.26 12.47 12.37 13.74 3.88 2.09 4.44 6.93 5.47 10 48.33 47.36 58.39 65.10 67.19 80.52 68.83 75.19 82.55
HHI 0.28 0.27 0.37 0.45 0.48 0.65 0.49 0.58 0.69
Year
Decile 2004 2005 2006 2007 2008 2009 2010 2011 Mean
1 1.31 1.78 1.52 0.85 1.59 1.49 1.32 0.93 2.09 2 4.87 10.61 8.28 42.19 10.95 15.48 17.15 11.57 10.49 3 0.06 0.14 0.12 0.10 0.17 0.36 0.25 0.19 0.47 4 0.32 0.31 0.06 0.11 0.08 0.08 0.12 0.26 0.83 5 0.35 0.19 0.33 0.14 0.93 0.43 0.33 0.28 1.27 6 1.02 2.13 0.55 0.75 0.69 0.76 0.69 0.68 1.76 7 2.23 0.92 1.57 1.15 1.61 2.48 1.41 1.32 2.64 8 1.85 2.76 2.90 1.13 2.32 3.26 4.73 7.96 4.84 9 3.71 4.40 2.94 1.73 4.69 5.50 9.39 8.52 6.80 10 84.27 76.75 81.71 51.85 76.84 70.15 64.60 68.27 68.70
HHI 0.72 0.60 0.68 0.45 0.61 0.52 0.46 0.49
Table 2. Dividend Concentration (HHI)
Panel A:
Life-Cycle Index 1-1.25 1.25-1.75 1.75-2 2-2.25 2.25-2.5 2.5-3 3-3.25
Percentage of payers 15.48 31.8 48.38 39.67 41.56 50.82 53.26
RE/TE -0.599 0.009 0.117 0.01 0.08 0.232 0.298
FCF/TA -0.074 -0.054 -0.05 -0.032 0 0.016 0.017
Age 4 4 7 9.5 8 11 14
Largest SH 50 51 46.44 38.5 43.15 46.58 47.49
No. of firms 101 412 401 368 474 549 552
Panel B: RE/TE <p10 p10-p20 p20-p30 p30-p40 p40-p50 p50p-60 p60-p70
Percentage of payers 11.94 16.43 23.48 25.91 50.83 66.49 72.78
Percentage of samples 10.51 10.54 10.57 10.48 10.57 10.51 10.51
Panel C: FCF/TA
Percentage of payers 51.78 47.95 41.64 34.79 55.62 49.86 49
Percentage of samples 9.89 9.89 9.89 9.89 9.89 9.89 9.89
Panel D: Age
Percentage of payers 38.22 46.2 46 47.68 48.49 51.15 50.93
Percentage of samples 9.37 9.82 10.38 10.95 10.89 11.67 11.25
Table 3. Life-cycle Proxies and the Proportion of Firms Paying a Dividend
In Panel A we split the 15 years of the sample into quartiles for each of the variables, earned capital to total equity (RE/ TE), free cash flow (FCF/TA), and Age. Then we assigned a value equal to 1 for the first quartile, 2 for the second, and so on for each of the variables, and we sum these values of the three variables resulting in an index that has values ranged from 1 to 4. Then we sort RE/TE, FCF/TA, Age, and the largest shareholder by the 9 range life-cycle index and report the median on each range.
In Panel B, C, and D we sorted the percentage of dividend payers by the decile of RE/TE, FCF/TA, and Age respectively.
Mean comparison of dividend payers and non-dividend payers. We divided our sample into dividend payers and non-payers and calculated the mean value of each firm’s characteristic variable for both dividend payers and non-payers to obtain the numbers in the Table 4.
Table 4. Dividend Payers vs. Non-dividend Payers
Payers Non-Payers Diff. t
(n = 1,414) (n = 1,236)
L-C Index 2.64 2.35 0.29 13.67***
RE/TE 0.21 -1.01 1.217 16.05***
ROA 0.07 0.01 0.055 7.37***
Age 27.99 23.73 4.265 7.99***
FCF/TA 0.01 -0.01 0.023 5.87***
M/B 1.99 1.84 0.156 1.64
Size (%) 0.30 0.08 0.215 9.33***
DTA 26.63 30.28 -3.648 -5.08***
Cash/TA 0.15 0.09 0.06 15.20***
and the life-cycle index, we can see a ‘U-shape’ pattern. The life-cycle index also shows a positive relationship with the percentage of dividend payers. Next, we sort the percent-age of dividend payers by each of these vari-ables in deciles as reported in Table 3 Panel B, C, and D. RE/TE and Age show a positive relationship with the percentage of dividend payers, as suggested by the dividend life-cycle hypothesis. Meanwhile, FCF/TA shows a non-linear pattern towards the percentage of dividend payers although it still has a posi-tive trend. To sum up our findings in Table 3, the proportion of firms paying dividends is higher in more mature firms, and it shows a positive linear pattern. However, it also re-veals that there are some firms in the more mature life stage that do not pay dividends. Following the life-cycle theory, firms that do not pay dividends at the end of the life-cycle stage could be suspected of expropriation while those which are at the beginning of their life cycle, but generously pay dividends, could be thought to be dividend tunneling. We will discuss this issue further in the discussion section.
Next, to see if the propensity to pay dividends is different from one firm to an-other, depending on each firm’s characteris-tics, we divided the sample into two subsamples, i.e. dividend paying firms and non-dividend paying firms. In Table 4, the dividend paying firms have significantly higher RE/TE, ROA, Size, FCF/TA, Cash/ TA and Largest SH, but lower Debt/TA than the non-dividend paying firms. The dividend paying firms are also older than the non-divi-dend paying ones. We find that M/B does not have a significant difference for both groups.9
Again, the result in Table 4 indicates that Indonesian listed firms’ dividend policies fol-low the firms’ life cycles. The results from Tables 3 and 4 may be influenced by indi-vidual and industry heterogeneity correlated with the life-cycle measures. In the next sec-tion, we will control the heterogeneity in the regression analyses.
Regression Analysis
Dividend life-cycle hypothesis test
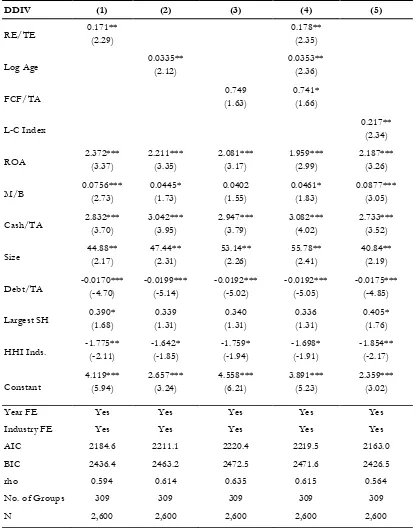
As our dependent variable is a categori-cal variable, which is a dummy variable tak-ing the value of one if the firm paid a divi-dend and zero otherwise, we follow Von Eije and Megginson (2008) and test the life-cycle hypothesis using a panel probit regression with random effects. The standard error cal-culation is adjusted for the clustering of firms. Table 5 presents the main results that indi-cate the impact of life-cycle measures on the propensity to pay dividends. First we estimate each of our life-cycle measures (RE/TA, Log Age, FCF/TA, and LC-index) on the dummy dividend payment (DDIV) separately (Speci-fications 1 – 3). The results show that RE/ TE and Age have a positive coefficient and significance at the five percent level. In Speci-fication 3, we have a positive coefficient for
FCF/TA, but the coefficient is not signifi-cant. In Specification 4, we include the three life-cycle measures in the estimation, and all of them have a positive and significant coef-ficient. Finally, we estimate our life-cycle in-dex (L-C Index) in Specification 5. The result shows that the L-C Index has a significant positive coefficient as well. These findings suggest that the propensity of firms listed on
DDIV (1) (2) (3) (4) (5)
RE/TE 0.171** (2.29) 0.178** (2.35)
Log Age 0.0335** (2.12) 0.0353** (2.36)
FCF/TA (1.63) 0.749 0.741* (1.66)
L-C Index 0.217** (2.34)
ROA 2.372*** (3.37) 2.211*** (3.35) 2.081*** (3.17) 1.959*** (2.99) 2.187*** (3.26)
M/B 0.0756*** (2.73) 0.0445* (1.73) 0.0402 (1.55) 0.0461* (1.83) 0.0877*** (3.05)
Cash/TA 2.832*** (3.70) 3.042*** (3.95) 2.947*** (3.79) 3.082*** (4.02) 2.733*** (3.52)
Size 44.88** (2.17) 47.44** (2.31) 53.14** (2.26) 55.78** (2.41) 40.84** (2.19)
Debt/TA -0.0170*** (-4.70) -0.0199*** (-5.14) -0.0192*** (-5.02) -0.0192*** (-5.05) -0.0175*** (-4.85)
Largest SH 0.390* (1.68) (1.31) 0.339 (1.31) 0.340 0.336 (1.31) 0.405* (1.76)
HHI Inds. -1.775** (-2.11) -1.642* (-1.85) -1.759* (-1.94) -1.698* (-1.91) -1.854** (-2.17)
Constant 4.119*** (5.94) 2.657*** (3.24) 4.558*** (6.21) 3.891*** (5.23) 2.359*** (3.02)
Year FE Yes Yes Yes Yes Yes
Industry FE Yes Yes Yes Yes Yes
AIC 2184.6 2211.1 2220.4 2219.5 2163.0
BIC 2436.4 2463.2 2472.5 2471.6 2426.5
rho 0.594 0.614 0.635 0.615 0.564
No. of Groups 309 309 309 309 309
N 2,600 2,600 2,600 2,600 2,600
Table 5. Baseline Regression: Propensity to Pay a Dividend and the Firm’s Life Cycle
z statistic in parentheses. * p< 10%, **p < 5%, ***p < 1%
the IDX to pay dividends tends to follow their life cycle. The more mature the firm is, the higher the propensity to pay. Next, we used the index for the new analyses.
Following DeAngelo et al. (2006), we also consider the sticky dividend phenomena by introducing the lag dummy dividend.10 We find that all life-cycle measures consistently keep the significance and the sign. This also means that the lagged dependent variable does not take all of the effects of the other variables.
The findings discussed above are also supported by the positive and significant ef-fects of ROA and Size, indicating that the more profitable and bigger sized firms, whose characteristics belong to more mature firms, have a higher propensity to pay dividends. However, investment opportunity, measured by M/B, has the opposite sign from what we expected. Instead of a negative relationship, we find a positive relationship between M/B
and the propensity to pay dividends. It may suggest that they also use dividends as a sig-nal to the market, in line with the sigsig-naling hypothesis. However, from the five specifi-cations, only two had strongly significant co-efficients (p-value less than 0.05). This find-ing of M/B is in line with the finding of Denis and Osobov (2008) for Germany, France, and Japan, while at the same time they found their empirical findings also supported the dividend life-cycle hypothesis. As we expected, Debt/ TA has a negative and significant effect on the probability to pay dividends, and it is con-sistent for all the specifications. This suggests that the use of debt lessens the probability of firms’ paying dividends. We find Cash/TA
has a positive and significant relationship with the probability to pay dividends, supporting
the finding of DeAngelo et al. (2006), that larger cash holdings indicate a build-up of excess funds, which are suitable for distribu-tion. Another possible explanation is that when a firm is in the high growth stage, it will shift its cash into operating assets.
Different industries might influence the dividend policies, due to the industries’ char-acteristics. The results in Tables 5 and 6 show a consistent result of variable HHI Indus. We can conclude that industry competition has a positive influence on firms’ propensity to pay dividends, supporting the dividend outcome model of Grullon and Michaely (2012), which demonstrated that dividend policy is also an outcome of external disciplinary mechanisms. We also test if each life-cycle measures’ ef-fect on the propensity to pay depends on in-dustry characteristics. We interact each of the life-cycle measures with the industry compe-tition variable, and we do not find such de-pendency. Besides controlling for industry competition, which may change throughout the observation period (e.g. due to new firms entering the market), we also use the indus-try dummy to control the indusindus-try fixed ef-fect in all the specifications. To see if there are any differences among industries, we com-pute the marginal effect of the dummy in-dustry coefficients from the estimation of Specification 5. The result suggests that the propensity to pay dividends is different from one industry to another. We find the indus-tries that have the biggest negative and sig-nificant coefficients are the software & ser-vices industries and the technology and hard-ware industries. This suggests that firms in the software and technology related indus-tries have less probability of paying dividends than firms in other industries have, because
these industries need a lot of investment in research and development, and always face abundant investment opportunities and prod-uct innovations. This is similar to the finding of Denis and Osobov (2008) for US and Ca-nadian samples. Whereas the industries that have the highest coefficients are the house-hold & personal products industries, which indicates that firms in these industries have a greater probability of paying a dividend.
Regarding year effects, we use 1995 as the reference base for all of the estimations. Confirming the declining propensity to pay dividends, all the estimations show that each dummy year always has a negative and sig-nificant coefficient.
We do not find consistent results that the ownership level of the largest shareholder has a positive relationship with the propen-sity to pay dividends. We only have two sig-nificant coefficients of the ownership vari-able out of the five estimations in Tvari-able 5. There is a possibility that different ownership types might behave differently towards a divi-dend policy. Thus, we will examine this issue further later in the next subsection, as well as introducing the importance of corporate ownership’s role in the dividend policy.
Ownership type and propensity to pay dividends
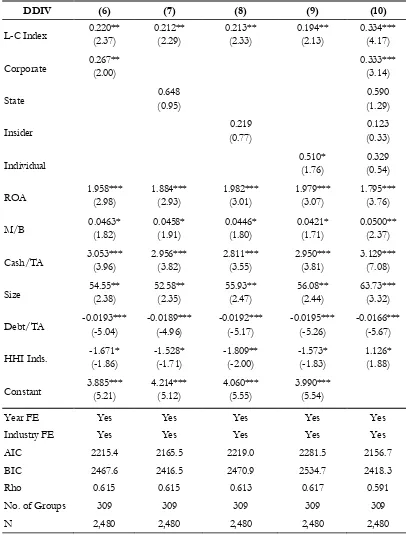
In the baseline regression, we find an indication that ownerships’ concentration has a positive relationship with the propensity to pay dividends. As aforementioned, one of the characteristics of the IDX is that most of the controlling shareholders are corporations. Therefore, we investigate further into the is-sue of this particular type of ownership, com-pared to the other types. We define this own-ership type as any corporation that owns the majority of the shares. The literature shows
that such investors will take the role of the monitoring agent, thus reducing the agency conflict between managers and owners. Therefore, paying high dividends is no longer necessary. However when the conflict is be-tween the majority and minority sharehold-ers, the majority shareholders often have the discretion and the incentive to extract private benefits through their control (Gugler and Yurtoglu 2003). Barclay et al. (2009) found that non-financial corporate investors actively influenced firms’ policies. In such cases, the corporate majority shareholder might need a dividend to mitigate the agency conflict be-tween the majority and the minority share-holders. Thus, we should find a positive rela-tionship between corporate ownership and the propensity to pay dividends. On the contrary, if the monitoring hypothesis holds, we should find that corporate ownership is negatively associated with the propensity to pay divi-dends.
DDIV (6) (7) (8) (9) (10)
L-C Index 0.220** (2.37) 0.212** (2.29) 0.213** (2.33) 0.194** (2.13) 0.334*** (4.17)
Corporate 0.267** (2.00) 0.333*** (3.14)
State (0.95) 0.648 (1.29) 0.590
Insider (0.77) 0.219 (0.33) 0.123
Individual 0.510* (1.76) (0.54) 0.329
ROA 1.958*** (2.98) 1.884*** (2.93) 1.982*** (3.01) 1.979*** (3.07) 1.795*** (3.76)
M/B 0.0463* (1.82) 0.0458* (1.91) 0.0446* (1.80) 0.0421* (1.71) 0.0500** (2.37)
Cash/TA 3.053*** (3.96) 2.956*** (3.82) 2.811*** (3.55) 2.950*** (3.81) 3.129*** (7.08)
Size 54.55** (2.38) 52.58** (2.35) 55.93** (2.47) 56.08** (2.44) 63.73*** (3.32)
Debt/TA -0.0193*** (-5.04) -0.0189*** (-4.96) -0.0192*** (-5.17) -0.0195*** (-5.26) -0.0166*** (-5.67)
HHI Inds. -1.671* (-1.86) -1.528* (-1.71) -1.809** (-2.00) -1.573* (-1.83) 1.126* (1.88)
Constant 3.885*** (5.21) 4.214*** (5.12) 4.060*** (5.55) 3.990*** (5.54)
Year FE Yes Yes Yes Yes Yes
Industry FE Yes Yes Yes Yes Yes
AIC 2215.4 2165.5 2219.0 2281.5 2156.7
BIC 2467.6 2416.5 2470.9 2534.7 2418.3
Rho 0.615 0.615 0.613 0.617 0.591
No. of Groups 309 309 309 309 309
N 2,480 2,480 2,480 2,480 2,480
z statistic in parentheses. *p < 10%, **p < 5%, ***p < 1%
Dependent variable is DDIV = dummy variable equals one if the firm pays a dividend and zero otherwise. L-C Index = life-cycle index; Corporate, State, Insider, and Individual are dummy variables equal to one if the controlling shareholder (ownership >50%) is corporate, state, insider, or individual respectively; ROA = return on assets; M/B = market value of equity to its book value; Size = firm’s market capitalization to total market capitalization; Cash/TA = cash holdings to total assets; Debt/TA = long term debts to total assets; HHI Inds.=HHI of total assets industry k. Standard error is adjusted for clustering of firms.
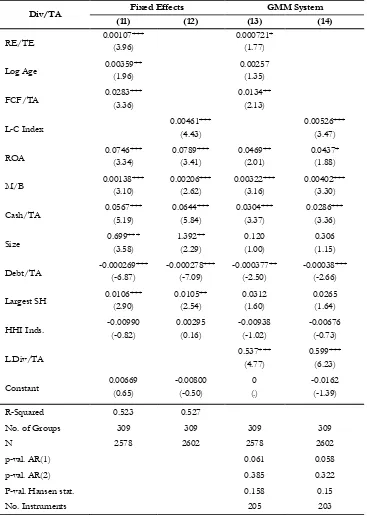
Table 7. Cash Dividend and the Firm’s Life Cycle
Div/TA Fixed Effects GMM System
(11) (12) (13) (14)
RE/TE 0.00107*** (3.96) 0.000721* (1.77)
Log Age 0.00359** (1.96) 0.00257 (1.35)
FCF/TA 0.0283*** (3.36) 0.0134** (2.13)
L-C Index 0.00461*** (4.43) 0.00526*** (3.47)
ROA 0.0746*** (3.34) 0.0789*** (3.41) 0.0469** (2.01) 0.0437* (1.88)
M/B 0.00138*** (3.10) 0.00206*** (2.62) 0.00322*** (3.16) 0.00402*** (3.30)
Cash/TA 0.0567*** (5.19) 0.0644*** (5.84) 0.0304*** (3.37) 0.0286*** (3.36)
Size 0.699*** (3.58) 1.392** (2.29) (1.00) 0.120 (1.15) 0.306
Debt/TA -0.000269*** (-6.87) -0.000278*** (-7.09) -0.000377** (-2.50) -0.00038*** (-2.66)
Largest SH 0.0106*** (2.90) 0.0105** (2.54) 0.0312 (1.60) 0.0265 (1.64)
HHI Inds. -0.00990 (-0.82) 0.00295 (0.16) -0.00938 (-1.02) -0.00676 (-0.73)
L.Div/TA 0.537*** (4.77) 0.599*** (6.23)
Constant 0.00669 (0.65) -0.00800 (-0.50) (.) 0 -0.0162 (-1.39)
R-Squared 0.523 0.527
No. of Groups 309 309 309 309
N 2578 2602 2578 2602
p-val. AR(1) 0.061 0.058
p-val. AR(2) 0.385 0.322
P-val. Hansen stat. 0.158 0.15
No. Instruments 205 203
t statistic in parentheses. * p< 10%, **p < 5%, ***p < 1%
Table 6 shows that corporate ownership always has a significant and positive coeffi-cient. It means that when the share of corpo-rate ownership is more than 50 percent, the propensity to pay dividends is higher than the other ownership types. When we introduce the other types of ownership, i.e. government, individual/family, and insider (managerial and board of directors), we find that corpo-rate ownership has a positive and significant coefficient at the 5 percent level, and we also find a positive and significant coefficient of government, but only at the 10 percent level. We also run the estimation using other mea-sures of the life cycle, and we find the result for corporate ownership is robust, but not for government ownership. We conclude that the most influential type of owners for the pro-pensity to pay dividends were the corporate owners, and they used dividends as a tool to reduce the agency conflict, sending the sig-nal that they would not expropriate the mi-nority shareholders.
Dividend amounts
Now we investigate if the amount of dividend paid by firms also follows the firms’ life cycles. We measure the amount paid by firms in dividends over total assets. We use panel data regression with industry fixed ef-fects to test this hypothesis. The results are reported in Table 7. In Estimation (11) the variables RE/TE and FCF/TA are positively significant, indicating that both measures of the life cycle positively influence the amount of dividends paid by firms. Our life-cycle in-dex, in Estimation (12), also has a positive and significant coefficient, supporting the other measures of the life cycle. Finally,
fol-lowing DeAngelo et al. (2006), we include the lag of the dividend to consider the sticky dividends. We use the GMM system estima-tion to deal with the endogeneity problem from the lagged dependent variable.11 Esti-mations (13) and (14) show that variables
RE/TE, FCF/TA, and L-C Index have posi-tive and significant coefficients, again con-firming all the results we previously dis-cussed. However, we do not find that age sig-nificantly influences the amount of dividends paid. To sum up, the amount of dividends paid by firms listed on the IDX follows the dividend life-cycle hypothesis. The results are robust with many specifications, including when we introduce the lagged value of the dividend.
Robustness Check
We performed several robustness checks both in the estimation and our index.12 To ensure the accuracy of the random effect probit estimation, we performed the estima-tion using a different number of integraestima-tion points. We compare the results in Table 5 with 8 and 16 integration points, and we do not find substantial differences in the coefficients and significances.13 We replace RE/TE with
RE/TA in the life-cycle index and repeat all the estimations above, and we find similar results. We also run all the estimations with-out firms that have negative profitability (ROA), and our results remain steady. Finally, we run all the estimations with either asset or sales growth rates as the investment op-portunities measure instead of M/B, and we find similar results.
11 We assume the lagged dividend payments, leverage, and market to book ratio as endogenous in the GMM system estimation.
12 The results are not reported but can be provided on request by the authors.
The declining dividends could be due to share repurchases, as in the study by Von Eije and Megginson (2008). We also attempt to collect information on share repurchasing, but the number of observations is relatively small. For instance, before the change to the share repurchase regulation in 2007, there had only been 30 share repurchase transac-tions since 2000. Most of the firms that fre-quently buy back their shares are big firms, their RE/TE always being above the median and always positive. Nevertheless, they pay dividends on a regular basis. For instance, the firms whose ticker symbols are BLTA, HMSP, and TLKM, who repurchased most frequently compared to the other firms during 2000-2007, almost never skip paying dividends. This might indicate that share repurchasing is not a substitute for a cash dividend pay-ment with agency problem motives, but to increase the stock price when it is underval-ued.
Discussion
While Indonesia has weak investor pro-tection, the country has a relatively high eco-nomic growth. To further expand this high growth rate, Indonesia needs to provide bet-ter investor protection. From the government’s point of view, the main reason for the mandatory dividend regulation is to provide better governance and investor pro-tection, particularly for the minority share-holders. Yet, most of the listed firms on the IDX are owned by corporate investors who actively influence their firms’ policies. Such a situation may indicate that investors are facing a high risk of expropriation. More im-portantly, these large shareholders usually also own the related upstream or downstream in-dustries through pyramidal ownership which exacerbates the risks of expropriation.
Un-derstandably, the government is concerned that low dividend payouts will demotivate public investment and cause fewer trading transactions. Ultimately, this will worsen the investment climate, which in turn slows down economic growth. Nevertheless, there is an empirical finding from a country that has been applying mandatory dividend rules, which finds that mandatory dividends did not have a negative effect on growth.
Indo-nesia are not aware of the rules and regula-tions that can protect them from expropria-tion.
From the firms’ points of view, the gov-ernment should not issue a mandatory divi-dend regulation since their dividivi-dend policies are already stated in their firms’ charters, and it is decided by the AGM. For the firms, re-tained earnings are the cheapest source of capital, since there are no costs associated with debt or new share issues. Our findings show that firms in Indonesia follow the life-cycle hypothesis. This means that the firms have specific conditions at any given stage and adjust their dividend policies accordingly, to maximize firm value. Hence, firms that do not pay dividends are not necessarily expro-priating their minority shareholders. We might suspect expropriation if the firms are in the most mature stage of our life-cycle index and have net positive incomes but do not pay divi-dends.
Ownership concentration can be the substitute for internal corporate governance in countries with weak shareholder protec-tion. However, at the same time the majority shareholders could easily take private ben-efits i.e. expropriation. Our findings show that, on average, the largest shareholder has a positive effect on the propensity to pay divi-dends. This indicates that they tend to use their dividend policy to mitigate the agency conflict. We can also argue that they, as the insiders of the firms who have the most take on the firm, will design the dividend policy in such a way so that it will maximize the firm’s value. Hence, applying mandatory divi-dends could be redundant.
However, the findings on the largest shareholder’s stake are not robust. It will be interesting for future research to investigate this further by examining each type of
con-trolling shareholder. Different shareholder types might have different incentives regard-ing the dividend policy.
dividends, as firms that are already in the most mature stage in this study (e.g. the L-C Index > 3.5), will not go back to the early infusion stage of the life cycle.
Summary and Conclusion
This study explains the recent concern of the IDX as to why many firms have not paid dividends. Even though the number of dividend payers is actually increasing, the percentage of firms that pay dividends is rela-tively stagnant. At the same time, we find that the amount of the dividends paid is increas-ing, indicating a dividend concentration that is similar to what happens in other countries. As shown in our results, we argue that the reason is due to the changes in the firms’ char-acteristics through their life cycle.
Overall, the dividend policy of the firms listed on the IDX is mostly consistent with the dividend life-cycle hypothesis, and this might explain why some firms do not pay divi-dends. Earned or contributed equity, firms’ age, and free cash flow consistently have significant explanatory powers on the prob-ability of paying a dividend. Our life-cycle proxy, namely the life-cycle index, which cap-tures several aspects of the firms’ maturity, also consistently has significant influence on the firms’ probability to pay dividends. We also find that firms controlled by corporate shareholders use dividends to reduce the se-verity of any agency conflict with the minor-ity shareholders. This confirms that agency conflict still plays a major role in explaining the firms’ dividend policies in Indonesia. Fi-nally, we also find that the dividend life-cycle hypothesis explains the amount of dividends paid by Indonesian firms. These results are robust for the various control variables and estimations.
References
BAPEPAM-LK. 2011. Efektivitas PP Nomor 81 Tahun 2007 dan PMK Nomor 238/PMK.03/2008 Terhadap Peningkatan Jumlah Emiten [Effectiveness of Government Regulation No. 81 year 2007 and Ministry Regulation No. 238/PMK.03/2008 on the Increase of Listed Firms]. Indonesia: BAPEPAM-LK.
Barclay, M. J., C. G. Holderness, and D. P. Sheehan. 2009. Dividends and corporate shareholders.” The Review of Financial Studies 22 (6): 2423-2455.
Bennedsen, M., K. M. Nielsen, F. Perez-Gonzalez, and D. Wolfenzon. 2007. Inside the family firm: The role of families in succession decisions and performance. The Quarterly Journal of Economics 122 (2): 647-691.
Black, B. 2001. The Corporate governance behavior and market value of Russian firms. Emerging Markets Review 2: 89-108.
Brockman, P., and E. Unlu. 2011. Earned/contributed capital, dividend policy, and disclosure quality: An international study. Journal of Banking and Finance 35 (7): 1610-1625. doi: http://dx.doi.org/10.1016/ j.jbankfin.2010.11.014.
Carney, R. W., and N. Hamilton-Heart. 2015. What do changes in corporate ownership in Indonesia tell us? Bulletin of Indonesian Economic Studies 51 (1).
Cucculelli, M., and G. Micucci. 2008. Family succession and firm performance: Evidence from Italian family firms. Journal of Corporate Finance 14 (1):17-31. doi: http://dx.doi.org/10.1016/ j.jcorpfin.2007.11.001.
DeAngelo, H., L. DeAngelo, and D. J. Skinner. 2004. Are dividends disappearing? Dividend concentra-tion and the consolidaconcentra-tion of earnings. Journal of Financial Economics 72 (3):425-256.
DeAngelo, H., L. DeAngelo, and R. Stulz. 2006. Dividend policy and the earned/contributed capital mix: A test of the life-cycle theory. Journal of Financial Economics 81 (2):227-254. doi: 10.1016/ j.jfineco.2005.07.005.
Denis, D., and I. Osobov. 2008. Why do firms pay dividends? International evidence on the determinants of dividend policy. Journal of Financial Economics 89 (1):62-82. doi: 10.1016/j.jfineco.2007.06.006. Faccio, M., L. H.P Lang, and L. Young. 2001. Dividends and expropriation. The American Economic Review
91 (1):54-78.
Fairchild, R., Y. Guney, and Y. Thanatawee. 2014. Corporate dividend policy in Thailand: Theory and evidence. International Review of Financial Analysis 31:129-151. doi: 10.1016/j.irfa.2013.10.006. Fama, E. F., and K. R. French. 2001. Disappearing dividends: Changing firm characteristics or lower
propensity to pay? Journal of Financial Economics 60: 3-43.
Fatemi, A., and R. Bildik. 2012. Yes, dividends are disappearing: Worldwide evidence. Journal of Banking
and Finance 36 (3): 662-677. doi: 10.1016/j.jbankfin.2011.10.008.
Fidrmuc, J. P., and M. Jacob. 2010. Culture, agency costs, and dividends. Journal of Comparative Economics 38 (3): 321-339. doi: 10.1016/j.jce.2010.04.002.
Goyal, A., and C. Muckley. 2013. Cash dividends and investor protection in Asia. International Review of Financial Analysis 29:31-43. doi: 10.1016/j.irfa.2013.03.009.
Grullon, G., R.Michaely, and B. Swaminathan. 2002. Are dividend changes a sign of firm maturity? Journal of Business 75 (3):387-424.
Gugler, K., and B. B. Yurtoglu. 2003. Corporate governance and dividend pay-out policy in Germany.
European Economic Review 47 (4):731-758. doi: 10.1016/s0014-2921(02)00291-x.
Hamill, P. A., and W. Al-Shattarat. 2012. What determines the dividend payout ratio for Jordanian indus-trial firms. Journal of Emerging Market Finance 11 (2):161-188.
Jensen, G. R., D. P. Solberg, and T. S. Zorn. 1992. Simultaneous determinant of insider ownership, debt, and dividend policies. Journal of Financial and Quantitative Analysis 27 (2): 247-263.
Jensen, M. C. 1986. Agency cost of free cash flow, corporate finance, and takeovers. American Economic Review 76 (2):323-329.
Jensen, M. C., and W. H. Meckling. 1976. Theory of the firm: Managerial behavior, agency costs and ownership structure. Journal of Financial Economics 3 (4): 305-360.
La Porta, R., F. Lopez-de-Silanes, A. Shleifer, and R. W. Vishny. 2000. “Agency Problems and Dividend Policies around the World.” The Journal of Finance 55 (1):1-33.
La Porta, R., F. Lopez-de-Silanes, and A. Shleifer. 1999. Corporate ownership around the world. The Journal of Finance 54 (2): 471-517. doi: 10.2307/2697717.
La Porta, R., F. Lopez-de-Silanes, A. Shleifer, and R. W. Vishny. 1998. Law and finance. Journal of Political
Economy 106 (6):1113-1155.
Lease, R. C. , K. John, A. Kalay, U. Loewenstein, and O. H. Sarig. 2000. Dividend Policy: Its Impact on Firm
Value. Boston: Harvard Business School Press.
Lintner, J. 1956. Distribution of incomes of corporations among dividens, retained earnings, and taxes.
The American Economic Review 46 (2):97-113.
Mahadwarta, P. A., and F. Ismiyanti. 2008. Debt policy, free cash flow hypothesis, and balancing of agency theory through ownership: Evidence from Indonesia. Corporate Ownership and Control 5 (2): 256-263.
Martins, T. C., and W. Novaes. 2012. Mandatory dividend rules: Do they make it harder for firms to invest? Journal of Corporate Finance 18 (4): 953-967.
Mitton, T. 2004. Corporate governance and dividend policy in emerging markets. Emerging Markets Review
5 (4): 409-426. doi: 10.1016/j.ememar.2004.05.003.
Von Eije, H., and W. L. Megginson. 2008. Dividends and share repurchases in the European Union.
Journal of Financial Economics 89 (2): 347-374. doi: 10.1016/j.jfineco.2007.11.002.
Windmeijer, F. 2005. A finite sample correction for the variance of linear efficient two-step GMM esti-mators. Journal of Econometrics 126 (1):25-51.
Web Sources:
http://www.indonesiafinancetoday.com/read/24004/Pelaku-Pasar-Merespons-Aturan-Pembagian-Dividen, accessed December 2013.
http://pasar modal.inilah.com/read/detail/1960834/bei-godok-aturan-pembagian-dividen#.Up9kCsTuLX4, accessed December 2013.