THE MODERATING EFFECT OF AGE, INCOME, GENDER,
EXPERTISE, LOYALTY PROGRAM, AND CRITICAL INCIDENT ON
THE INFLUENCE OF CUSTOMER SATISFACTION TOWARDS
CUSTOMER LOYALTY IN AIRLINE INDUSTRY: A CASE OF PT. X
Dionisius Kenny Sugianto
International Business Management Program, Petra Christian University Jl. Siwalankerto 121-131, Surabaya
E-mail: [email protected]
ABSTRACT
Customer loyalty has been the end purpose for every company. Researchers have acknowledged that a loyal customer always comes from a satisfied customer. Many companies and researchers alike find satisfied customer still abandon and switch to others. This encourages the notion that satisfaction and loyalty is not straight forward. This research shows how the relationship between satisfaction and loyalty has advanced into a stage that requires reexamination of moderating variables. The purpose of the research is to present empirical evidence of variables in which the satisfaction and loyalty relationship becomes stronger or weaker particularly in service sector in Indonesia.
Using a sample of 125 customers of airline industry (PT. X) and Moderated Regression Analysis, the researcher examine moderating activity of 6 variables which includes (1) age, (2) income, (3) gender, (4) expertise, (5) loyalty program and (6) critical incident. The results suggest not all variable moderates the relationship. Age, income, expertise and critical Incident are relevant moderators while loyalty program and gender are not.
Keywords: Customer Loyalty, Customer Satisfaction, Moderating, Service, Airline, Indonesia
ABSTRAK
Loyalitas pelanggan telah menjadi tujuan akhir bagi setiap perusahaan. Berbagai peneliti telah mengakui bahwa pelanggan setia selalu berasal dari pelanggan yang puas. Namun, banyak perusahaan dan peneliti menemukan bahwa konsumen yang puas masih meninggalkan dan beralih ke yang lain. Hal ini mendorong anggapan bahwa hubungan anatara kepuasan dan loyalitas tidaklah simpel. Penelitian ini menunjukkan bagaimana hubungan antara kepuasan dan loyalitas telah berevolusi ke dalam tahap yang memerlukan pemeriksaan ulang dengan menambahkan variabel moderasi. Tujuan dari penelitian ini adalah untuk menyajikan bukti empiris tentang variabel dimana hubungan kepuasan dan loyalitas menjadi lebih kuat atau lebih lemah terutama di sektor jasa di Indonesia.
Dengan menggunakan sampel 125 pelanggan di industri maskalapai penerbangan (PT. X) dan Analisis Regresi Moderat, peneliti menguji aktivitas moderasi dari 6 variabel yang meliputi (1) usia, (2) pendapatan, (3) jenis kelamin, (4) keahlian, (5) Program loyalitas dan (6) kejadian kritis. Hasilnya menunjukkan tidak semua variabel memoderasi hubungan anatra kepiasan dan loyalitas. Usia, pendapatan, keahlian dan Insiden kritis adalah moderator yang relevan terhadap relasi utama sedangkan program loyalitas dan jenis kelamin tidak.
Kata Kunci:Loyalitas Pelanggan, Kepuasan Pelanggan, Moderating, Service, Airline, Indonesia.
INTRODUCTION
Customer loyalty is an important aspect for a company in a competitive market. It is generally more profitable for a company to maintain its customers rather than to replace them with the new ones (Hawkins & Mothersbaugh, 2013). Furthermore, customer loyalty will increase the purchasing frequency of certain products or services, which translate into greater profit (Anderson & Mittal, 2000; Hallowell, 1996). Not only that, customer loyalty will also produce a positive word of mouth (Gremler & Brown, 1999; Griffin, 1995). Therefore, without a doubt, loyal customers are important and essential for any business to survive, flourish and grow.
These phenomena may occur because the relationship between customer satisfaction and customer loyalty is not as simple as it used to be. Walsh, Evanschitzky, and Wunderlich (2008) argue that the satisfaction-loyalty model has advanced to a period that highlights the important influence of moderating variables. Moderating variables will modify the traditional relationship of the independent and dependent variable (Sekaran & Bougie, 2016). Hence, there is a need to re-examine the traditional satisfaction-loyalty relationship by exploring the moderating variables that may influence the customer satisfaction-loyalty relationship.
This paper therefore, will use moderating variables adopted from Walsh, Evanschitzky, and Wunderlich (2008). Their model includes six moderating variables which are (1) age, (2) income, (3) gender and (4) expertise, (5) loyalty program, and (6) critical incident.
While the previous research is conducted on the retail industry, this research will be conducted on the airlines industry in Indonesia. Airlines industry is chosen because of the importance of airlines industry in Indonesia. Indonesia is an archipelagic nation that consist of more than 17,000 island spread over 113,700 square miles. As Indonesia tries to increase GDP by linking resources, people and industries, connectivity is becoming more and more important. However connectivity cannot be done by road or rail due archipelagic nature of Indonesia. Also connectivity cannot be efficient using ship or ferry due to the time consumed. Therefore, the next logical answer would be aviation.
This research will use PT. X to represent the airlines industry. PT. X is one of the oldest Indonesia airlines. PT. X is famous for having a very high rating of customer satisfaction. With a high customer satisfaction, the research feels that PT. X is a good object to use in explaining the satisfaction and loyalty relationship. Second, PT. X is the only Indonesia’s airline which has the biggest combined market share in international and domestic flight compared to any other Indonesian airlines (PT.X, 2016). Therefore, with those two reasons, PT. X should be a good start in reflecting the airline industry.
THEORETICAL BACKGROUND Customer Satisfaction
Kotler and Keller (2012) define customer satisfaction, as “a person’s feelings of pleasure or disappointment that result from comparing a product’s perceived performance (or outcome) to expectations” (p. 150). Meanwhile, Oliver (2010) states “satisfaction is the consumer’s fulfillment response. It is a judgment that a product/service feature, or the product or service itself, provided (or is providing) a pleasurable level of consumption-related fulfillment, including levels of
under-or over-fulfillment” (p. 8). Fornell (1992) on the other hand, defines customer satisfaction as an “Overall evaluation after purchase”.
There are two most popular conceptualization of customer satisfaction. First, customer satisfaction is portrayed as an outcome of a certain consumption experience for a particular transaction, encounter or ‘transaction-specific’ satisfaction (Oliver, 1981; Howard & Sheth, 1969). Transaction-specific satisfaction is a post-choice evaluative judgment of a customer on his or her single transaction or consumption (Oliver, 2010). Second, customer satisfaction is portrayed as an outcome of cumulative evaluation of the whole consumption experiences or ‘cumulative’ satisfaction (Oliver, 2010; Fornell, 1992; Tse & Wilton, 1988; Cadotte, Woodruff, & Jenkins, 1987; Kotler & Keller, 2012).
Oliver (1999) suggest that cummulative approach is more appropriate to the analysis of satisfaction loyalty relationship. Cumulative customer satisfaction gives a better predictive power because it aggregates past experiences or other experiences that may lead to a unique and subjective measurement of customer satisfaction (Oliver, 2010). With that line of reasoning, cumulative satisfaction should better predict customer intentions and behaviour. Therefore, this research will adopt the definition from Oliver (2010). This definition follows the concept of cumulative satisfaction, which may give better power in predicting customer loyalty.
The evaluation aspect of the definition focuses on comparing perceived product or service performance with the pre-purchase expectation and desire. This theory of measurement is known as the “Disconfirmation model” which is a popular way to measure customer satisfaction (e.g. Kotler & Keller, 2012; Oliver, 2010; Fornell, 1992; Bae, 2012).
what a customer percieve a product or service “should” be.
The theory approaches customer satisfaction as the comparison between perceived performances of a product or service with what was expected and desired. Positive disconfirmation will occur if the perceived performance (P) is better or the same with what was expected (E) which in the end increases satisfaction. Meanwhile, Negative disconfirmation will occur if (P) falls short then (E) which in the end increases dissatisfaction.
Customer Loyalty
Oliver (2010) defines customer loyalty as “a deeply held commitment to rebuy or re-patronize a preferred product or service consistently in the future, despite situational influences and marketing efforts having the potential to cause switching behavior” (p. 432). Griffin and Lowenstein, (2001) define a loyal customer as “one who makes regular repeat purchases, purchases across product and service lines, refers others, demonstrates an immunity to the pull of the competition and can tolerate an occasional lapse in the company’s support without defecting, owing to the goodwill established through regular, consistent service and provision of value” (p. 23).
In recent literature, customer loyalty is conceptualized as having two dimensions, which are (1) behavioral and (2) attitudinal (Day, 1969; Yi Y. , 1990). Behavioral loyalty refers to the actual repurchase behavior of a customer (Griffin & Lowenstein, 2001). The repurchase behavior indicates a loyalty for a brand or service consistently over time. On the other hand, attitudinal loyalty refers to the attitude of a customer towards the product or service in the future (Dick & Basu, 1994). When the customer shows an attitudinal loyalty, they have emotional attachment towards the brand, which signifies, repurchase intentions.
Looking at the two conceptualization, it is desirable to integrate the two dimensions. This will create a construct that covers the disadvantages of adopting only one conceptualizations. Therefore, the research will try to incorporate the two conceptualization of both behavioral and altitudinal loyalty. This integration is reflected by the definition of loyalty by Oliver (2010) that is previously mentioned and will be adopted by this research.
Therefore, measuring customer loyalty should incorporate the two conceptualizations, which are imbedded in the definition. Behavioral and attitudinal loyalty can be measured by looking at the outcome of each loyalty’s behavior. The behavioral loyalty is indicated by (1) repurchasing behavior from the same service provider (Jones, beatty, & Mothersbaugh, 2000), (2) lower switching intentions (Bansal & Taylor, 1999). While attitudinal loyalty is indicated by (1) recommending behavior (Butcher, Ken, Sparkes, & O'Callaghan, 2001), (2) Strong affection with the
service providers (Mitra & Lynch, 1995) and (3) repurchase intention in the future (Narayandas, 1997).
The relationship between concepts can be seen in figure 1.
Figure 1: Relationships between Concepts Satisfaction and Loyalty
Based on figure 1, it can be seen that customer satisfaction and customer loyalty will be the main link in this research. The relationship between satisfaction and loyalty has been the highlight of many researches. As customer satisfaction increases, the costs of searching and comparing other companies eventually will increase and outweigh the benefits. At some point customers shift from problem solving (searching for the best alternatives) to more routinized behavior where they rely upon a smaller consideration of alternatives based on experience that drive their purchase behavior (Oliver, 2010).
Moderators Age (A)
This research will define age as in its form of practical definition, which is number of years a person has lived.
Income (I)
Income taken in this research will be defined as an amount of increase in economic benefits in a particular time-period. This definition is adapted from IFRS (2012) to suit the needs of the research.
Walsh, Evanschitzky and Wunderlich (2008) show that income have a significant moderating effect on the satisfaction and loyalty relationship. They suggest that high income consumers will be less loyal than the low income people. The argument for this is that high income people is generally a well educated people (Homburg & Giering, 2001). Thus, based on the information processing theory, they have the ability and capability to seek more information before purchasing a product and service (Mithal & Kamakura, 2001; Walsh, Evanschitzky, & Wunderlich, 2008; Yusuf, Moeljadi, Rohman, & Rahayu, 2015). Whereas low income people will shun the cost of thinking (Shugan, 1980), they will accept lower level of satisfaction rather than the cost of searching and moving to a new service and company.
Gender (G)
According to World Health Organization (WHO) (2016) Gender refers to the socially constructed characteristics (i.e. norms, roles, and relationships) of a person’s biological sex (i.e. man and woman).
Along with age, Walsh, Evanschitzky and Wunderlich (2008) fails to show a significant moderating effect of gender towards the satisfaction and loyalty relationship. However, many research proposed gender as one of the moderating variable (e.g. Srivastava, 2015; Mithal & Kamakura, 2001; Saad & Gill, 2000). This argument is based on the social role theory which suggest that different groups of people behave differently in different situations and take on different roles (Eagly, 1987). Thus, having different social status (i.e. gender) will create different roles or behaviour. For example, it is argued that men are more willing than women to take risks because socially men are expected to engage in a risky behavior (Walsh, Evanschitzky, & Wunderlich, 2008). Because it is riskier to switch providers and try something new, men may be less loyal when their satisfaction level decreases.
Expertise (E)
Alba and Hutchinson (1987) defines expertise as “the ability to perform product-related tasks successfully” (p. 411). Thus, in the context of customer expertise, it refers to the level of understanding of what the service should or product needs to be successful.
In the previous research, Walsh, Evanschitzky and Wunderlich (2008) fail to show a significant moderating effect of expertise towards the satisfaction and loyalty relationship. However, with the same argument of information processing theory where information processing ability takes an important role,
customer with higher expertise should take a number of information cues or variables into account before evaluating a service or product. Thus, Walsh, Evanschitzky and Wunderlich (2008) suggest that experts will become less emotional and more objective in assessing or comparing service or products. Their information cues will be placed in higher importance to the quality of the product and service. In contrast, non-expert customer will have a non-objective measure when evaluating or comparing service or products. Walsh, Evanschitzky and Wunderlich (2008) suggest novices put more weight in discrete product information cues such as experience.
Loyalty program (LP)
Kotler and Keller (2012) define loyalty program or frequency program (FPs) as a program that is design to reward customers who buy frequently and in substantial amounts. Sharp and Sharp (1997) define Loyalty program as “a structured marketing efforts that rewards, therefore encourage loyal behavior” (p. 474). Behavior in the definitions refers to the repeat-purchase pattern that benefits the firm. Oliver (2010) mentions loyalty program as a strategy that firms applies to ensure future purchases. Liu (2007) defines loyalty program as “a program that allows consumers to accumulate free rewards when they make repeated purchases with a firm” (p. 20). The definitions emphasize loyalty program as to (1) foster customer loyalty over-time, which (2) creates future deals and implies a (3) substantial amount. Therefore, in this paper, loyalty program is defined as a program that allows customer to accumulate points, which later can be redeemed as rewards to customer who shows a frequent substantial repurchase behavior.
Critical Incidents (CI)
Bitner, Booms, and Tetreault (1990) defines critical incidents as “ a specific interaction between customer and service employees that are very satisfying or very dissatisfying” (p. 73). In this research, critical incident will refer to a sucessful recovery of a very dissatisfying incident Sucessful in the research will be defined subjectively by the customers. In other words, if the customer is satisfied with the recovery attempt, than it it is classified as sucessful.
In the previous research, Walsh, Evanschitzky and Wunderlich (2008) sucesfully shows critical incidents recovery as a moderating variable. They suggest that a recovered consumers from critical incidents will be more loyal in comparisson to customers who has never encountered a critical incidents. This is based on reasoning that the very dissatisfying incidents provide not only risk of losing customer but also an opportunity to satisfy them even more (Hui, Ho, & Wan, 2011). Thus, favourable recovery may often lead to a “service recovery paradox”. Basically, it refers to a phenomena where an excellent recovery may create a more satisfying expirience for the customer compared if they were satisfied normally (Michel, Bowen, & Johnston, 2006; Siu, Zhang, & Yau, 2013). Therefore, critical incidents which are very memorable to the customers will have higher weight for customers in their purchasing decision. A negative incident and a succesful recovery can contribute in the making of customer loyalty.
Based on the theoretical review of rationalizing relationship between concepts, the researcher would like to proposed several hypotheses:
H1: Age significantly moderates the relationship; specifically, the relationships are stronger for older customer compared to younger customer. H2: Income significantly moderates the relationship;
specifically, the relationships are stronger for low-income customer compared to high-income customer.
H3: Gender significantly moderates the relationship; specifically, the relationships are stronger for male customer compared to female customer. H4: Expertise significantly moderates the relationship;
specifically, the relationships are stronger for novices compared to experts.
H5: Loyalty Program significantly moderates the relationship; specifically, the relationships are stronger for customer that is involved in a loyalty program compared to the ones who is not. H6: Critical incident significantly moderates the
relationship; specifically, the relationships are stronger for recovered customer compared to customer who has never experience a critical incidents.
RESEARCH METHOD
Since the information processing theory recognizes only two sub category and in line with Walsh, Evanschitzky, and Wunderlich (2008), the research classifies the age groups into two which are young adults and adults. Therefore, the research classify young adults as people ranging from 18 until 34 and adults as people above 35 years old.
The information processing theory recognizes only two sub categories and in line with Walsh, Evanschitzky, and Wunderlich (2008) this research only recognizes two sub groups which are (1) middle - high income and (2) middle - low income. Therefore, the research classifies middle-low income as someone whose income is < 3,000,000 and 3,000,000 – 5,000,000 and middle-high income as someone whose income is 5,000,001 – 10,000,000 and > 10,000,000.
Gender is measured directly by classifying as either male or female. After that the research classifies male as one (1) and female as zero (0).
To operationalize expertise, the research adopts Walsh, Evanschitzky, and Wunderlich, (2008) method which is a self-rating. To help in evaluating the respondents, a statement “I understand what PT. X needs to have, show and improve regarding their product and service” is shown. Then, they were asked to rate themselves by picking one of these four sentences (1) disagree, (2) neutral, (3) agree, (4) strongly agree. Finally, the same reason with age and income, the statements is reclassified into two groups, low experienced and high experienced. Low experienced consists 1 & 2, high experienced consists of 3 & 4
To measure loyalty program, a nominal variable is constructed. Respondents will be asked if they are involved in a loyalty program where the answer would be either a yes or a no. After that, the respondents will be asked whether they really use the benefit of the loyalty program. If the respondents is involved, but do not use the program, they will be taken out.
To measure Critical incidents, the respondents will be asked two questions. First, whether the respondents has experienced a critical incidents. Second, whether the incidents have been resolved to his/her satisfaction. Respondents will answer with either answer with a yes or a no. Since the theory of the service paradox suggest that a positive recovery from a dissatisfying incident may be more satisfying compared to if customers were satisfied normally, the one who answers that they have experienced a critical incidents but not resolved will be taken out.
The data used for this research will be primary data which is acquired by conducting survey through distributing questionnaires.
population size. Since the population cannot be obtained, the size of the ideal sample cannot be known. However, Green (1991) suggests N > 50 + 8m, where m is the number of predictors, as an adequate number when determining regression sample size. This research will require a minimum of 75 respondents for each moderating model. Each model will have three predictors which are (1) Satisfaction, (2) Moderators and (3) Interaction term. Therefore, using Green (1991), 50 + 8 x 3 predictor = 74, so at least 75 respondents for each model.
After getting the data from the questionnaires, the data will then be processed using SPSS (Social Program for Social Science) for windows. The first process is to test the validity and the reliability of the questionnaires.
The validity of the questionnaires is established through a correlational analysis (Sekaran & Bougie, 2016). The indicators can be said as valid when they are strongly correlated with the concept. The reliability of the questionnaires is conducted to measure the level of accuracy and precision of the answers in measuring the concept. The reliability will be established by looking at the Cronbach’s coefficient alpha.
After testing the validity and the reliability, the data have to fulfill the Best Linear Unbiased Estimator (BLUE) classical assumptions. The model needs to pass the assumptions in order for the result to be reliable in explaining the relationships between the variables. The four test will be explained in table 1.
Table 1 : BLUE classical Test
Assumptions Elaboration
Normality (Kolmogorov-Smirnov Test)
Checks the assumption that the residuals are normally distributed.
Auto-Correlation (Durbin-Watson Test)
Checks the assumption that the residuals should not be correlated
Multicollinearity (VIF Test)
The data should have little or no multicollinearity which occurs when the independent variables are not independent from each other
Heteroscedasticity (Park Test)
The data have to share same variance in terms of error in all level of IV
Source: Ghozali (2004)
Finally, Moderated Regression Analysis (MRA) will be used in testing the moderating effect of the six variables (Z1-6) in altering the influence of
customer satisfaction (X) towards customer loyalty (Y). Fairchild and MacKinnon (2010) stated that moderation effects are tested with multiple regression analysis, where the predictors (X, Z) and their interaction term (XZ) are included to improve interpretation of regression coefficients. A single regression equation forms the basic moderation model:
Y=i+β1X+β2Z+β3XZ+e
Where β1 is the coefficient of the independent
variable (X) in predicting the outcome (Y), when Z = 0. While β2 is the coefficient of the moderator variable
(Z) in predicting the outcome (Y), when X = 0, i the intercept coefficient in the equation, and e is the error in the equation. Finally, β3 will represent the
coefficient of the interaction term (X.Z). This β3
represents the strength of the moderation activity, the effect of X on Y depends on the value of M.
RESULTS AND DISCUSSION
There are 25 (20%) respondents in the age between 18-24 years old, 25 (20%) respondents in the age between 25-34 years old, 75 (60%) respondents are in the age between 35-60 years old and 0 (0%) respondents are above 60 years old. In this research, the age range between 18-34 years old will be classified as young adults (40%) while the age range above 34 years old will be classified as adults (60%). Figure 2 will illustrate the age distribution that will be used for this research.
Figure 2: Age of Respondents
In this research, the respondents with income of < 3,000,000 and 3,000,000 – 5,000,000 will be classified as middle-low income (49.6%) while respondents with income of 5,000,001 – 10,000,000 and > 10.000.000 will be classified as middle-high income (50.4%). Figure 3 illustrates the income distribution that is used for this research.
Figure 3: Income of Respondents’
From the gender aspect, there are 59 (47.2%) male respondents and 66 (58.8%) female respondents. The percentage of the gender can be seen in figure 4.
40% 60%
Young Adults
Adults
49,60% 50,40%
Middle-Low Income
Figure 4: Gender of Respondents
Following Walsh, Evanschitzky and Wunderlich (2008), respondents which are ameteur and normal are classified as respondents that have a low experience (44%) and respondents which are advanced and professional is classified as respondents that have a high experience (56%). Figure 5 illustrates the expertise distribution that is used for this research.
Figure 5: Respondents' Level of Expertise
From 125 respondents used for the research, there are 8 respondents that is involved with the loyalty program but is not using the benefits of the program. Thus, the 8 respondents are taken out. Consequently, from 117 usable respondents, 32 (27.4%) respondents are involved and are using the benefits of the PT.X’s loyalty program, while 85 (72.6%) respondents are not involved in the PT.X’s Loyalty Program. We can see the huge imbalance between the ones that are involved in the loyalty program and the ones that are not. Huge uneven distribution across a moderator may reduce the power to detect moderating activity (Aguinis, 1995). The acceptable value according to Aguinis (1995) was a minimum of 30% and an optimum of 50%. Therefore, this research randomly takes out 42 respondents from 117 that is not involved in GFF to make the moderator sub-group more balance. The percentage of the loyalty program involvement that has been reduced can be seen in figure 6.
Figure 6: Respondents Loyalty Program Involvement (N=75)
From 125 respondents used for the research, there are respondents that are exposed to a critical incident but are not satisfied with PT. X’s effort. Thus, the 6 respondents are classified as non-recovered
customers and are taken out. This research tries to balance the sub group by taking out 44 from 119 respondents that have never been exposed to a critical incidents. The research can reduce only a maximum of 44 because the model needs a minimum sample of 75. The percentage of the respondent’s exposure that has been reduced can be seen in figure 7.
Figure 7: Respondents' Exposure to Critical Incidents
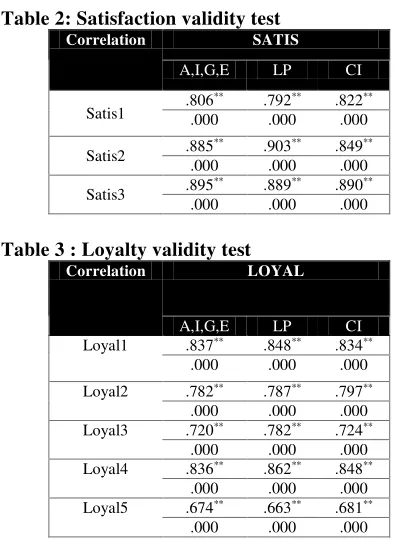
The validity of the data is established through a correlational analysis. The data can be considered as valid when they have strong and significant (p >0.05)
correlation (r> 0.475) with the concept. Table 2 and 3 illustrate the result.
Table 2: Satisfaction validity test
Correlation SATIS
A,I,G,E LP CI
Satis1 .806
** .792** .822**
.000 .000 .000
Satis2 .885
** .903** .849**
.000 .000 .000
Satis3 .895
** .889** .890**
.000 .000 .000
Table 3 : Loyalty validity test
Correlation LOYAL
A,I,G,E LP CI Loyal1 .837** .848** .834**
.000 .000 .000
Loyal2 .782** .787** .797**
.000 .000 .000 Loyal3 .720** .782** .724**
.000 .000 .000 Loyal4 .836** .862** .848**
.000 .000 .000 Loyal5 .674** .663** .681**
.000 .000 .000
The reliability of the data is established by looking at the Cronbach’s coefficient alpha. The data can be considered as reliable when the Cronbach’s coefficient alpha is more than 0.6. Table 4 and 5 illustrate the result.
Table 4 : Satisfaction Reliability Statistics
Reliability Statistics
Cronbach's Alpha (Model) N of Items
A,I,G,E LP CI
3 .826 .827 .813
47,20% 52,80%
Man
Woman
44,00% 56,00%
Low Experience High Experience
42,60% 57,400
%
Involved in GFF
Not Involved in GFF
74,70% 25,30%
No Exposure to Critical Incidents
Table 5 : Loyalty Reliability Statistics
Reliability Statistics
Cronbach's Alpha (Model) N of Items
A,I,G,E LP CI
5 .824 .849 .770
The first model is explaining loyalty with one predictor which is satisfaction. The second model is explaining loyalty with two predictors which are (1) satisfaction (X) and (2) moderator (Z). The third model is explaining loyalty with three predictors which are (1) satisfaction (X) and (2) moderator (Z) and (3) interaction term between satisfaction and moderator (XZ).
Based on Table 6, model 1 with no interaction produces R2 of 35.8%, this means that satisfaction can
explain 35.8 % of loyalty, while the other 64.2% is explained by other factors.
Table6 : Moderated Regression (Age)
Model R
Square
Adjusted R
Square F Sig.
Change Statistics
R Square
Change Sig. F
Change
1 .358 .353 68.701 .000b .358 .000
2 .371 .361 35.954 .000c .012 .123
3 .392 .377 25.964 .000d .021 .044
Predictors p value
3
(Constant) .000
X .000
Z .085
XZ .044
Model 3 with the interaction accounted for significantly (“Sig F change” below 0.05) more variance than model 2 or model 1. R2 change is 0.021
which means the interaction term increases the R2 by
2.1% and increases Adj R2 by 1.1% from model 2 to
model 3. Furthermore, the interaction term (XZ) is significantly able to predict or explain loyalty (p is 0.044), indicating a significant moderating activity.
Figure 8: Interaction Plot (Age)
Since there is proof of moderating activity, an interaction plot was conducted. Based figure 8, older group has steeper slope than the younger group which shows that age has an enhancing effect for the satisfaction and loyalty link.
The result in the regression analysis supports the research H1 and successfully answers the research question. The finding may reinforce the information processing theory which suggests that older consumer tend to not as competitively compare price and seek new information in their purchasing process. As people get older, they become more skeptical (Vyse, 1997; Leventhal, 1997). Thus, when an older customer group is already satisfied and trust their current service providers (e.g. airlines) they become reluctant to try finding better alternatives, which makes them more loyal.
Table 7 shows the result of the moderated regression with Income as the moderating variable.
Table 7: Moderated Regression (Income)
Model R
Square
Adjusted
R Square F Sig.
Change Statistics
R Square Change
Sig. F Change
1 .358 .353 68.701 .000b .358 .000
2 .394 .384 39.680 .000c .036 .008
3 .449 .435 32.837 .000d .055 .001
Predictors p value
3
(Constant) .000
X .000
Z .007
XZ .001
Model 3 with the interaction accounted for significantly (“Sig F change” below 0.05) more variance than model 2 or model 1, The interaction term (XZ) increases the R2 by 5.5% and Adj R2 by 5.1%
from model 2 to model 3. Furthermore, the predictor of the interaction is also significant at 0.001, indicating a significant moderation activity.
Since there is proof of moderating activity, an interaction plot was conducted. Based figure 9, higher income group has steeper slope than the lower income group which shows that Income has an enhancing effect for the satisfaction and loyalty link. In other words, the impact of customer satisfaction is greater for higher income group than the lower income group.
The result in the regression rejects the research H2. Apparently, income does moderate the relationship, however in contrast with the hypothesis, income acts as an enhancer where the relationships are stronger for higher income group compared to the lower income group as higher income group has steeper slope than the lower income group (refer to graph 4.13).
The result contradicts with Walsh, Evanschitzky, and Wunderlich (2008) because when lower income group do not shun the cost of thinking, the research predict that price sensitivity theory may be better in explaining the contrast. Soba and Aydin (2012) argue that low income customer will be more sensitive to the price, whereas high income customer will be less sensitive to the price. For lower income people, price will be the main determinants in purchasing behaviour (Sharma & Patterson, 2000). Therefore, when lower income people does not shun the cost of thinking, they would probably be more competitive in comparing price. This is supported by Farley and John (1964) which suggest that high income people perceive higher value of time compared to the lower income groups. Higher income people are willing to trade for time in exchange for limited evaluation. In other words, higher income people are less willing to waste their time in comparing prices, service and products compared to the lower income people.
Table 8 will show the result of the moderated regression with gender as the moderating variable.
Table 8: Moderated Regression (Gender)
Model R
Square Adjusted R Square F Sig.
Change Statistics
R Square Change
Sig. F Change
1 .358 .353 68.701 .000b .358 .000
2 .359 .348 34.149 .000c .001 .753
3 .360 .344 22.710 .000d .001 .617
Predictors p value
3
Constant .000
X .000
Z .756
XZ .617
Model 3 with the interaction accounted more variance than model 2 or model 1. However, it is not significant (“Sig F change” is 0.617) R2 change is 0.001.
Furthermore, it actually decreases the Adj R2 by 0.4%.
The interaction term (XZ) is also not significant at p =
0.617. Therefore, there is no indication of moderating activity.
The result in the regression rejects the research H3. The finding is aligned with Walsh, Evanschitzky and Wunderlich (2008) where they also fails to show a significant moderating activity by gender. The research takes the argument of Kuosuwan (2015) which is conducted in the Thailand’s airline industry using 400 respondents consisting of 52% male and 48% female. The result suggests that price is ranked number 1 as their reason of choosing airlines. In other words, it implies that regardless of males or female, price is still being used as their predominant decision.
Table 9 will show the result of the moderated regression with expertise as the moderating variable.
Table 9: Moderated Regression (Expertise)
Model R
Square
Adjusted R
Square F Sig.
Change Statistics
R
Square Change
Sig. F
Change
1 .358 .353 68.701 .000b .358 .000
2 .380 .370 37.416 .000c .022 .040
3 .422 .407 29.413 .000d .042 .004
Predictors p value
3
Constant .000
X .000
Z .027
XZ .004
Model 3 with the interaction accounted for significantly (“Sig F change” below 0.05) more variance than model 2 or model 1, it increases the R2
by 4.2% and increases the Adj R2 by 3.7%.
Furthermore, the predictor of the interaction (XZ) is also significant at 0.004, indicating a significant moderation activity.
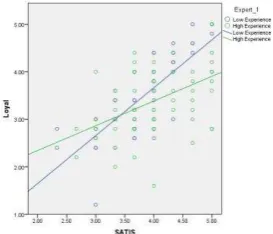
Based figure 10, lower experienced group has steeper slope than the higher experienced group which shows that expertise Income has a buffering effect for the satisfaction and loyalty link.
The result of the analysis supports H4. The findings may reinforce the suggestion made by Walsh, Evanschitzky and Wunderlich (2008) and Bell and Eisingerich (2007) that high experience group (experts) will take a number of information cues into consideration for evaluation of a service. Usually, technical aspect (service quality) will take precedence over relational benefit. Thus, they will be more objective and less emotional in comparing services.
Table 10 will show the result of the moderated regression with loyalty program as the moderating variable.
Table 8: Moderated Regression (Loyalty Program)
Model R
Square
Adjusted R
Square F Sig.
Change Statistics
R Square Change
Sig. F Change
1 .391 .382 46.778 .000b .391 .000
2 .429 .413 27.076 .000c .039 .030
3 .433 .409 18.081 .000d .004 .490
Predictors p value
3
(Constant) .000
X .001
Z .027
XZ .490
Model 3 with the interaction accounted more variance than model 2 or model 1, R2 change is 0.004.
However, it actually reduces the Adj R2 by 0.4% and
the change is not significant, Sig F Changeis at 0.490 which is above 0.05. Furthermore, the interaction term is also not significant at 0.490. Therefore, there is no indication of moderating activity. Since there is no significant moderation activity, further analysis will not be conducted.
The result in the regression rejects the research H5. The result questions the effectiveness of loyalty program in retaining customers. Apparently, loyalty program does not moderate the relationship. The result fails to significantly show any difference between the one who is involved in a loyalty program and the one who is not.
This may be explained with the perception of value that the customer have on their loyalty programs. The theory suggest that people involved in a loyalty program is faced with higher benefit and increased switching barrier. However, how big is the additional benefit and how high is additional switching barriers depends on how good the customers perceive the loyalty program. This research fails to capture the value given by the loyalty program. In other words, the insignificant of the moderating activity may be caused by the low perception of value of the loyalty program.
The non-moderating impact of Loyalty program on the satisfaction and loyalty link suggest that PT. X may need to reassess or abandon their PT.X’s Loyalty Program.
Table 11 will show the result of the moderated regression with critical incident as the moderating variable.
Table 9: Moderated Regression (Critical Incidents)
Model R Square Adjusted R
Square F Sig.
Change Statistics
R Square
Change Sig. F Change
1 .191 .180 17.260 .000b .191 .000
2 .264 .244 12.930 .000c .073 .009
3 .329 .301 11.608 .000d .065 .011
Predictors p value
3
(Constant) .000
Centered_SATIS .001
Critical_Incident .010
Moderation_CrtclInc .011
Model 3 with the interaction accounted for significantly (“Sig F change” below 0.05) more variance than model 2 or model 1 (p is 0.011). The interaction term increases the R2 by 6.5% and the Adj
R2 by 5.7%. Furthermore, the predictor of the
interaction is also significant at 0.011, indicating a significant moderation activity.
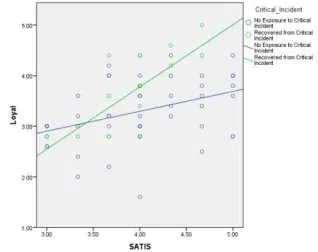
Figure 11: Interaction Plot (Critical Incident)
The result of the analysis support our H6. It is worth mentioning that the data was not of equal size between the moderator sub-groups with the majority of non-exposed customer (76.25%). However the result is still significant and critical incident acts as an enhancer to the relationship. Therefore, adding to the mindset that the impact of customer satisfaction will be higher for recovered customer compared to the unexposed group. In other words, recovered customer are far more loyal than customers who have never been exposed to a critical incidents.
A negative critical incident would pose an opportunity to satisfy customer even more. This is because intense consumer complaints enables consumers to vent their anger and negative feelings (Nyer, 2000). Thus, when a staff successfully listens and give satisfactionary alternatives to the customer, not only does the customer can relinquish their anger, but they also can experience the extra hardwork the company puts to re-satisfy them. This will make them feel as if they are important and creates a more staisfying experience.
CONCLUSIONS
The Objective of the research was to provide additional insight to the traditional consumer satisfaction and consumer loyalty relationship. First, in contrast with our prediction, gender does not moderate the relationship between satisfaction and loyalty. The findings of gender is align with the research conducted by Walsh, Evanschitzky, and Wunderlich (2008) where they also fail to show significant difference between male and females. Second, Loyalty porgram also does not moderate the relationship between satisfaction and loyalty. The findings is contrast to the preveious research where they found a loyalty program as a buffer in the relationship. However, sufficient evidence supports the notion of a less straight forward relationship between satisfaction and loyalty. The other 4 variables (Age, Income, Expertise, and Critical Incident) significantly moderate the relationship between satisfaction and loyalty. The finding implies that that the effect of customer satisfaction on customer loyalty is not the same between different groups.
As with all empirical studies, the research will acknowledge some limitations. First, the research is conducted to explain the airline industry, however because of the limited resources, the research were only able to research one particular airlines which decreases generalizability of the findings. Second, the research assumes that there is no lag time between satisfaction and loyalty. In other words the research did not conduct a longitudinal analysis using the same respondents. Therefore the research recognize that the satisfaction have lag effect on loyalty. Third, the research fails to show actual loyalty behaviour which is by getting actual repurchase data of the customers. Fourth, the measurement of expertise is also may not
be good because it is measured subjectively by the respondents. Finally, critical Incident does not have optimum propotion to be compared. Customers who has positive recovery from have only 25.3%. while 74.7% is not exposed to the critical incident. The unbalanced proportion may reduce the moderation activity of the variables.
These limitations also suggest further research opportunities. First, future research should incorporate other airlines operating in Indonesia. Second, future research may conduct a longitudinal analysis to address the lag effect of the satisfaction and loyalty link. Third, future research may want to include other moderating variable such as education. Since the theory uses processing capability, adding education as another variable does make sense. Fourth, measurement of expertise might be changed into how many times the respondents have used an airlines services. The more they experienced an airline service, the more familiar they are with the service and what to expect from certain airlines. Fifth, future research may want to try other industries such as the (FMCG) Fast Moving Consumer Goods. Since the industry offers goods instead of service, this would offer additional insight on whether the six variables are still relevant.
BIBLIOGRAPHY
Aguinis, H. (1995). Statistical Power Problems With Moderated Multiple Regression in Mangaement Research. Journal of
Management, 1141-1158.
Alba, J. W., & Hutchinson, J. W. (1987). Dimensions
of Consumer Expertise. Retrieved from
http://www.cfs.purdue.edu/richardfeinberg/cs r%20331%20consumer%20behavior%20%2 0spring%202011/grad/readings/4%20Dimen sions_of_Consumer_Expertise.pdf
Anderson, E., & Mittal, V. (2000). Strengthening the Satisfaction-Profit Chain. Service Research, 3(2), 107-120.
Anderson, E., Fornell, C., & Mazyancheryl, S. (2004). Customer Satisfaction and Shareholder Value.
Marketing, 68(4), 172-185.
Bae, Y. (2012). Three essays on the customer satisfaction-customer loyalty association. Retrieved October 29, 2016, from http://ir.uiowa.edu/etd/3255
Bansal, H., & Taylor, S. (1999). The Service Provider Switching Model: a Model of Consumer Switching Behavior in Service Industry.
Service Research, 2(2), 200-218.
Bell, S., & Eisingerich, A. (2007). The paradox of customer education: Customer expertise and loyalty in the financial services industry.
European Journal of Marketing, 466-486. Bettman, J. (1979). an Information Procession Theory
of Consumer Choice. Addison Wesley
Bitner, M., Booms, B. H., & Tetreault, M. S. (1990).
The Service Encounters: Diagnosing
Favourable and Unfavourable Incidents.
Retrieved February 5, 2017, from http://s3.amazonaws.com/academia.edu.docu ments/36040223/Article_6.pdf?AWSAccess KeyId=AKIAIWOWYYGZ2Y53UL3A&Ex pires=1488032771&Signature=edt02lnAPdm oySvcxeVCvz1P7og%3D&response-
content-disposition=inline%3B%20filename%3DThe _service_encounter_Diagnosing_favo Butcher, K., Ken, Sparkes, B., & O'Callaghan, F.
(2001). Evaluative and Rational Influences on Service Loyalty. International Journal of Service Industry Management, 310-327. Cadotte, E. R., Woodruff, R. B., & Jenkins, R. L.
(1987). Expectations and norms in models of consumer satisfaction. Journal of marketing Research, 305-314.
Day, G. (1969). A Two-Dimensional Concept of Brand Loyalty. Retrieved October 16, 2016, from http://www.ibrarian.net/navon/paper/A_Two _Dimensional_Concept_Of_Brand_Loyalty. pdf?paperid=11714029
Dick, A., & Basu, K. (1994). Customer Loyalty: Toward an Integrated Conceptual Framework.
Journal Of The Academy Of Marketing Science, 22(2), 99-113.
Eagly, A. (1987). Six Differences in Social Behaviour: a Social Role Interpetration. Lawrance Erlbaum Associates.
Fairchild, A., & MacKinnon, D. (2010). A General Model for Testing Mediation and Moderation Effects. Retrieved November 15, 2016, from https://www.ncbi.nlm.nih.gov/pmc/articles/P MC2908713/
Farley, & John, U. (1964). Brand Loyalty and the Economics of Indormation. Journal of Business, 370-381.
Fornell, C. (1992). A National Customer Satisfaction Barometer: The Sweedish Experience.
Marketing, 56(1), 6.
Garuda, I. (2016). Corporate Presentation Garuda Indonesia FY 2015. Garruda Indoneisa. Ghozali, I. (2004). Aplikasi Nalasis Multivariate
Dengan Program SPSS. Dipenogoro: Badan Penerbitan Universitas Diponegoro. Jogiyanto, H.M. 2007.
Green. (1991). How Many Subjects Does It Take To Do A Regression Analysis. Multivariate Behavioral Research, 26, 499-510.
Gremler, D., & Brown, S. (1999). The Loyalty Ripple Effect. Service Industry Management, 10(3), 271-293.
Griffin, & Lowenstein. (2001). Customer Winback.
San Francisco: Jossey-Bass.
Griffin, J. (1995). Customer Loyalty: How to earn it, How to keep it. New York: Lexcington Books.
Hallowell, R. (1996). The Relationships of Customer Satisfaction, Customer Loyalty, and Profitability: an Empirical Study.
International Journal of Service Industry
Management, 27-42.
Hawkins, D., & Mothersbaugh, D. (2013). Consumer Behavior: Building Marketing Strategy 12th Edition. New York: Mc Graw Hill.
Homburg, C., & Giering, A. (2001). Personal
characteristics as moderators of the
relationship between customer satisfaction and loyalty—an empirical analysis. Retrieved
from
10.1002/1520- 6793(200101)18:1<43::AID-MAR3>3.0.CO;2-I
Howard, J., & Sheth, J. (1969). The theory of buyer behavior. New York: Wiley.
Hui, M. K., Ho, C. K., & Wan, L. C. (2011). Prior Relationships and Consumer Responses to Service Failures: A Cross-Cultural Study.
International Marketing, 59-81.
IFRS. (2012, January 1). The Conceptual Framework for Financial Reporting. Retrieved February
25, 2017, from
http://www.ifrs.org/IFRSs/Documents/Englis h%20Web%20summaries/Conceptual%20Fr amework.pdf
Siu, M., beatty, S., & Mothersbaugh, D. (2000). Swtiching Barriers and Repurchase Intentions in Services. Retailing, 76(2), 259-274. Jones, T., & Sasser, W. (1996). Why Satisfied
Customers Defect. Retrieved from
https://hbr.org/1995/11/why-satisfied-customers-defect
Kandampully, J., & Suhartanto, D. (2000). Customer Loyalty in the Hotel Industry; The Role of Customer Satisfaction and Image.
Contemporary Hospitality Management,
12(6), 346-351.
Kannan, P., & Bramlett, M. (2000). Implications of Loyalty Program membership and Service Experiences for Customer Retention and Value. Journal of Academy of Marketing Science, 95-108.
Kotler, P., & Keller, K. (2012). Marketing
Management. Pearson.
Kuosuwan, B. (2015). Market Factors Influencing the Decision to Patronage Low Cost. Social and Behavioral Sciences, 2097-2102.
La, S., & Yi, Y. (2015). A Critical Review of Customer Satisfaction, Customer Loyalty, Relationship Marketing, and Customer Relationship Management. 30(1).
Laerd, S. (2017, 6 16). Laerd Statistic. Retrieved from
https://statistics.laerd.com/spss- tutorials/dichotomous-moderator-analysis-using-spss-statistics.php
Automobiles by Older Consumers; Empirical Evidence and Interpretations. Retrieved from http://dx.doi.org/10.1509/jmkg.69.2.97.6075 7
Leventhal, R. (1997). Aging consumers and their effects on the marketplace. Consumer Marketing, 276-281.
Liu, Y. (2007). The Long Impact of Loyalty Programs on Customer Purchase Behaviour and Loyalty.
Journal of Marketing, 71, 19-35.
Michel, S., Bowen, D., & Johnston, R. (2006). SERVICE RECOVERY MANAGEMENT: CLOSING THE GAP BETWEEN BEST PRACTICES .
Mithal, V., & Kamakura, W. A. (2001). Satisfaction, RepurchaseIntent, and Repurchase Behaviour: Investigating the Moderating Effect of Customer Characteristics. Marketing Research.
Mitra, A., & Lynch, J. (1995). Toward a Reconciliation of Market Power and Information Theories of Advertising Effects on Price Elacticity.
Consumer Research, 21(4), 644-660.
Moschis, G. P. (1984). Marketing to older adults: an updated overview of present knowledge and
practice. Retrieved from
http://dx.doi.org/10.1108/073637603104990 93
Narayandas, N. (1997). Measuring and Managing the Consequences of Customer Loyalty: an
Empirical Evidence. Harvard Business
School.
Nyer, P. (2000). An investigation into whether complaining can cause increased satisfaction.
Consumer Marketing, 9-19.
Oliver, R. (1981). Measurement and evaluation of satisfaction processes in retail settings.
Journal of retailing.
Oliver, R. (1999). Whence Customer Loyalty?
Marketing.
Oliver, R. (2010). satisfaction: A behavioral
perspective on the consumer. London:
Routledge.
Reichheld, F. (1996). Learning from Customer Defections. Harvard Business Review. Saad, G., & Gill, T. (2000). Applications of
Evolutionary Psychology in Marketing.
Retrieved February 8, 2017, from http://citeseerx.ist.psu.edu/viewdoc/downloa d?doi=10.1.1.604.2276&rep=rep1&type=pdf Sekaran, U., & Bougie, R. (2016). Research Methods
for Business: A Skill Building Approach Seventh Edition. John Wiley & Sons.
Sharma, N., & Patterson, P. (2000). “Switching costs, alternative attractiveness and experience as moderators of relationship commitment in
professional, consumer services. Service Industry management, 470-490.
Sharp, B., & Sharp, A. (1997). Loyalty Programs and their Impact on repeat-purchase loyalty patterns. Marketing Science, 473-486. Shugan, S. M. (1980). The Cost of thinking. Consumer
Research, 7(2), 99-11.
Siu, n. Y.-M., Zhang, t. J.-F., & Yau, J. (2013). The Roles of Justice and Customer Satisfaction in Customer Retention: A Lesson from Service Recovery . Business Ethics, 675-686. Soba, M., & Aydin, E. (2012). The role of Income level
on Sensitivity Levels for simmilar Product: A purchasing Behavioral Study. International Journal of Humanities and Social Science. Spreng, R. (2003). a test of alternative measures of
disconfirmation. Decision Sciences, 34. Srivastava, M. (2015). Influencers of Customer
Satisfaction - Customer Loyalty Relationship: A Conceptual Research Model. Retrieved
February 25, 2017, from
http://www.iimidr.ac.in/wp-content/uploads/Vol7-7-ICS.pdf
Tse, D., & Wilton, P. (1988). Models of Consumer
Satisfaction Formation: An Extension.
Retrieved October 29, 2016, from http://dx.doi.org/10.2307/3172652
Vavra, T. (1997). Improving your measurement of customer satisfaction. Milwaukee, Wis: ASQ Quality Press.
Vyse, S. (1997). Believing in Magic: The Psychology of Superstition. Oxford.
Walsh, G., Evanschitzky, H., & Wunderlich, M. (2008).
Identification and analysis of moderator
variables: Investigating the customer
satisfaction-loyalty. Retrieved from
http://dx.doi.org/10.1108/030905608108911 09
WHO. (2016). Gender, equity and human rights . Retrieved from World Health Organization:
http://www.who.int/gender-equity-rights/understanding/gender-definition/en/ Yi, Y. (1990). A critical review of consumer
satisfaction. Review of marketing, 68-123. Yusuf, Moeljadi, Rohman, F., & Rahayu, M. (2015).
Customer Income as the Moderator on the Relation of Customer Satisfaction, Loyalty and Switching Intention. Retrieved from http://ijbmi.org/papers/Vol(4)2/Version-2/C0422016024.pdf