Landscape indicators and soil properties in a naturally
rehabilitated mine waste dump, Western Australia
SETYAWAN Dwi (1,2), GILKES Robert J. (1) and JASPER David A. (1)
(1) Soil Science and Plant Nutrition, The University of Western Australia, Crawley WA 6009, Australia
(2) Faculty of Agriculture, Sriwijaya University, Indralaya OKI 30662, Indonesia
Abstract
Volunteer establishment and sustainable growth of native plant species on non-rehabilitated disturbed land is possible and could be a viable alternative to seeding and fertilisation as a strategy in land rehabilitation. Fieldwork to study this natural approach was conducted at the Scotia gold mine waste dump at Norseman, Western Australia. The waste dump consisted of diverse mixtures of weathered and fresh mafic and felsic rocks with particle sizes ranging from clay to boulder. The dump extended over several hectares and was approximately flat topped with steeply sloping sides. The site had been left in an unrehabilitated condition for about 15 years. Soil surface conditions were recorded along four transects on the waste dump and along two transects in adjacent native forest. Indices for stability, infiltration and nutrient cycling were calculated using Landscape Function Analysis technique (Tongway and Hindley, 1995). Soil samples were analysed for their water retention, texture, and nutrient content.
Bare soil including rock fragments was the dominant zone (patch) in both landscapes occupying 60 % of the total transects. Stability indices ranged from 49 to 54 for the dump, and 64 to 67 for the reference sites. Likewise, the infiltration indices were lower for the dump (35-42) as compared with the native bush sites (mean = 56). The nutrient cycling indices were half those for the native sites (mean 22 and 41). These figures clearly indicate that after 15 years the waste dump is still not within the range of native sites. Native species, especially Eucalyptus and Melaleuca, are growing on the dump in a marked patchy pattern, which reflects available nutrient and water in localised niches. We now have a baseline and can measure change in the future.
Introduction
Spontaneous growth of native species on disturbed sites, especially on mine sites, has been little studied, in contrast to active rehabilitation techniques implemented on disturbed sites which are intensively studied. It is a common practice to use various plant species, either indigenous to the locality or introduced for site rehabilitation. Various cultural practices including fertilisation are usually employed. Natural or spontaneous rehabilitation may also provide a quite satisfactory remediation to disturbed sites although establishment of plant cover by this method may take a considerably longer period. Williams (1997) after visiting several disturbed sites around the world found that natural rehabilitation induces a more stable landscape, owing partly to less compaction by machinery and provides a more favorable niche for species diversity on abandoned sites.
Progress of rehabilitation after mining closure needs to be monitored. It is important that techniques for site monitoring should be practical, quick, unambiguous, and repetitive. Recently the landscape function analysis (LFA) method has been approved by the Department of Minerals and Energy of Western Australia as a fast and reliable technique for monitoring disturbed land (Anderson, 2001). Originally, Tongway and Hindley (1995) develop the LFA technique for rangelands in Australia, but now it has been revised for use on mine sites. Although the analysis is quite reliable, its application to mine sites is still limited, and more fieldwork is required to validate the technique.
We studied natural rehabilitation of a waste dump at the Scotia gold mine (Norseman, Western Australia) that had been left unrehabilitated for 15 years prior to the study, as an example of spontaneous growth, and evaluated the dump using LFA indicators to compare current condition with analogue sites in adjacent native forest.
Materials and Methods
The study site is located at the Scotia gold mine waste dump near Norseman, Western Australia, approximately 760 km south-east of Perth. The site has been left undisturbed in the mining modified landscape for about 15 years. The waste dump and pit lie between 121°47′ to 121°48′ E and 32°28′ to 32°29′ S (approximately AMG Reference 386000E/6406000N).
undisturbed site is under native woodland on soils developed from quaternary calcareous materials resulting from wind-drifted erosion (Doepel, 1973).
Local climate is typically Mediterranean with winter rainfall and summer dry. Annual rainfall is 288 mm and evaporation is 2,445 mm, which clearly shows a very strong deficit of water in the year. Average maximum temperature in January is 32.5°C, and the average minimum is 5.2°C in July.
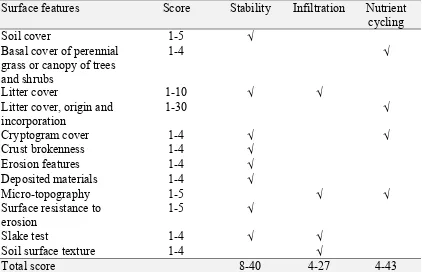
Fieldwork was conducted from November to December 1999 and in February 2000. Four 100-m transects were established on the waste dump, approximately 25 to 50 m apart. In addition, two transects were set up at the analogue site (undisturbed native woodland about 300 m to the west of the dump). Soil patches and interpatches were recorded; they were mostly bare soil (mixed with gravel and rock fragment), shrubs and trees associations, and also a man-made bank-trough series. Twelve soil characteristics were used to calculate indices of stability, infiltration and nutrient cycling (Table 1). Any absent or not applicable features were given a zero score and excluded from the calculation.
Table 1 Summary of soil indicators used for the assessment of soil surface condition as part of Landscape Function Analysis (Tongway and Hindley, 1995).
Surface features Score Stability Infiltration Nutrient cycling
Soil cover 1-5 √
Basal cover of perennial grass or canopy of trees and shrubs
1-4 √
Litter cover 1-10 √ √
Litter cover, origin and incorporation
1-30 √
Cryptogram cover 1-4 √ √
Crust brokenness 1-4 √
Erosion features 1-4 √
Deposited materials 1-4 √
Micro-topography 1-5 √ √
Surface resistance to erosion
1-5 √
Slake test 1-4 √ √
Soil surface texture 1-4 √
Total score 8-40 4-27 4-43
NaHCO3 at pH 8.5; P concentration was measured using the Murphy and Riley method, and K using AAS. Organic carbon was measured using the Walkley-Black method. Total carbon and total nitrogen were determined using a combustion technique with LECO CHN1000 instrument. Exchangeable cations were extracted using 0.01 M silver thiourea and measured by AAS. Water retention was measured using a pressure plate apparatus at 10 and 1,500 kPa. Particle size analysis was determined using the pipette procedure (Van Reeuwijk, 1987). We used a simple correlation matrix to identify relationships between soil properties, and multivariate methods to select the most diagnostic soil attributes, including principle component and canonical variate analysis with the GENSTAT program (Digby et al., 1989).
Results and Discussion
Landscape indicators
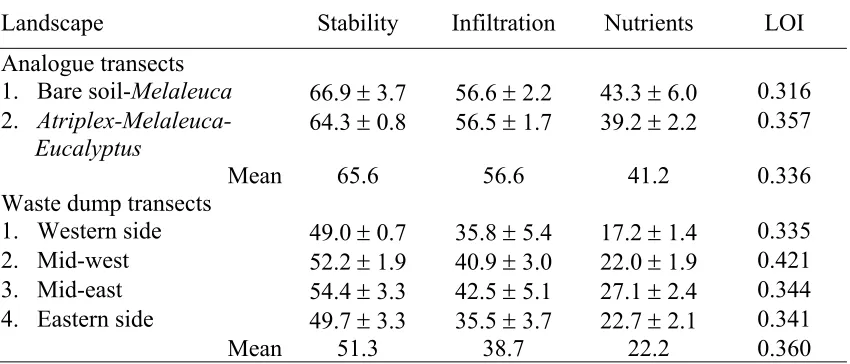
The Scotia waste dump exhibits substantial soil development as indicated by LFA indices (Table 2). For the waste dump, average values of the stability index are 51 %, infiltration 39 %, and nutrient cycling 22 %. The centre of the waste dump (Transect 3; Table 2) may indicate a better condition for supporting plant growth. If the mean values of indices from the waste dump and native sites are compared and expressed as proportions, the stability index is approximately 0.78 of the native woodland and the infiltration index 0.68. The much lower nutrient cycling index for the waste dump (ratio 0.54) may indicate a slow process of soil enrichment. In this case, living biomass is the key factor that will enhance a rapid change of nutrient index. Logically the nutrient index will increase as plants grow, produce more biomass, and as cryptograms become established. A higher obstruction index (LOI, Table 2) on the dump was associated with the manmade ridge (drain) structure. It may reflect the potential of the landscape to retain resources.
Table 2 Summary of LFA indices for the Scotia waste dump and analogue sites. Landscape organization index (LOI) is total length of obstruction divided by transect length to indicate the proportion of sink or retention of resources.
Landscape Stability Infiltration Nutrients LOI
Analogue transects
1. Bare soil-Melaleuca 66.9 ± 3.7 56.6 ± 2.2 43.3 ± 6.0 0.316 2.
Atriplex-Melaleuca-Eucalyptus
64.3 ± 0.8 56.5 ± 1.7 39.2 ± 2.2 0.357
Mean 65.6 56.6 41.2 0.336
Waste dump transects
1. Western side 49.0 ± 0.7 35.8 ± 5.4 17.2 ± 1.4 0.335 2. Mid-west 52.2 ± 1.9 40.9 ± 3.0 22.0 ± 1.9 0.421 3. Mid-east 54.4 ± 3.3 42.5 ± 5.1 27.1 ± 2.4 0.344 4. Eastern side 49.7 ± 3.3 35.5 ± 3.7 22.7 ± 2.1 0.341
Mean 51.3 38.7 22.2 0.360
Major plant species on the waste dump are Eucalyptus torquata, E. diptera and E. terebra, Melaleuca lanceolata, Maireana apppresa, and annual species (including
as leaf, bark and twig, while paperbark (Melaleuca sp.) trees mostly contribute twig and branch material due to the small size of their leaves. Litter accumulation is estimated to be less than 100 kg ha-1, and has accumulated around plant stems and within drainage channels.
Tongway (1999) emphasized that LFA does not automatically classify a site as Poor, Moderate or Good. It is necessary to compare index values from rehabilitated sites with analogue target sites in order to draw any inference from a particular numerical value. There are no generic values to indicate that a functional state is acceptable for all conditions. Types of biome affect the values, for example a nutrient cycling index of 25 may indicate highly functional grassland, but it could be dysfunctional for woodland.
Ideally, LFA measurement is conducted in a time series spanning from the early stage of site rehabilitation to its state at decommissioning. However, it is not always easy to find rehabilitation sites of different ages that have been established with similar practices. In this case, the Scotia waste dump provides a single unit of observation and a time trajectory analysis can not be performed.
Soil properties
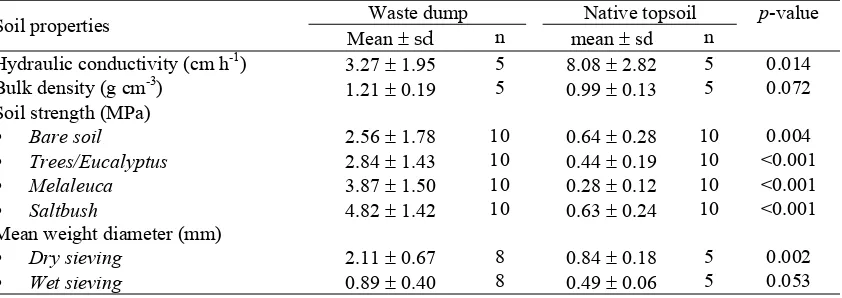
Topsoils from random parts of the Scotia waste dump show lower hydraulic conductivity, higher bulk density (BD), higher soil strength, and bigger soil aggregates than values for the native topsoils (Table 3). The higher BD values in the dump are partly associated with a higher gravel content. Soil crusting also affects the measured physical properties, especially as it inhibits water movement through the profile and generates a hard layer. Mean weight diameter (MWD) values for aggregate stability were higher for the waste dump. However, the ratio of the two MWD values measured by dry and wet sieving may indicate a more stable condition for the native samples than the waste dump samples with ratios of 0.59 and 0.42, respectively.
Table 3 Mean values and standard deviation for selected physical properties of the Scotia waste dump and native forest topsoils.
Waste dump Native topsoil p-value Soil properties
Mean ± sd n mean ± sd n
Hydraulic conductivity (cm h-1) 3.27 ± 1.95 5 8.08 ± 2.82 5 0.014 Bulk density (g cm-3) 1.21 ± 0.19 5 0.99 ± 0.13 5 0.072 Soil strength (MPa)
• Bare soil 2.56 ± 1.78 10 0.64 ± 0.28 10 0.004
• Trees/Eucalyptus 2.84 ± 1.43 10 0.44 ± 0.19 10 <0.001
• Melaleuca 3.87 ± 1.50 10 0.28 ± 0.12 10 <0.001
• Saltbush 4.82 ± 1.42 10 0.63 ± 0.24 10 <0.001
Mean weight diameter (mm)
• Dry sieving 2.11 ± 0.67 8 0.84 ± 0.18 5 0.002
• Wet sieving 0.89 ± 0.40 8 0.49 ± 0.06 5 0.053
suitable for a few tolerant plant species, especially saltbush (Atriplex and Maireana). Woodland subsoils exhibit more saline conditions (higher EC, pH and exchangeable Na) than those of topsoils. Soil properties were relatively close to those of soils of the Dundas series (Salmon Gums area) especially reference profile SG 2. It has been previously suggested that this series should be left uncleared because of high salt concentration and powdery surface which is susceptible to erosion under agriculture (McArthur, 1991).
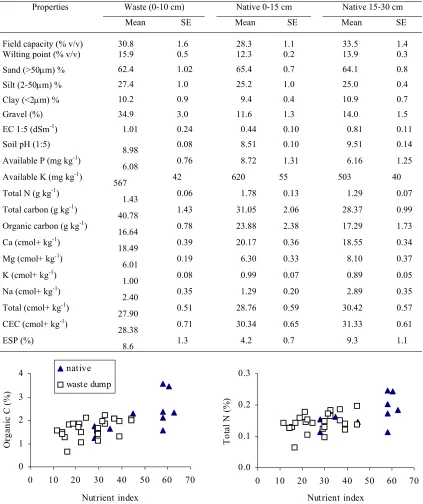
Topsoils of waste dump and analogue sites are quite similar except for total carbon (TC), organic carbon (OC), plant-available P and K (Table 4). However, it should be noted here that the difference between sites might be related to unequal soil depths for sampling. These properties reflect higher potential fertility of woodland soils due to a well-established ecosystem and continuous biomass addition. This pattern is consistent with the previous finding (landscape indices) that soil organic matter increases with nutrient index (Figure 1). For the native woodland, these values were systematically higher for topsoils than subsoils.
If all samples are considered together, then close relationships exist between some soil variables. In particular, organic carbon (OC) is positively related to total nitrogen (r = 0.89), exchangeable Ca (r = 0.71), and CEC (r = 0.64). Soil pH is positively related to Na (r = 0.65). Using the stepwise regression technique, we can identify several relationships between soil attributes. CEC is sufficiently described by OC and total exchangeable bases which together account for 78 % of total variance in CEC. Total N is adequately explained by OC (79 %). There is no strong prediction for available P with clay, EC and soil pH together only explaining 27 % of total variation in available P. Likewise, exchangeable K only accounts for 44 % of total variance in plant-available potassium.
If soils from each site are considered separately, then the relationship between CEC and organic carbon (OC) is improved (r = 0.81) for waste dump soils but is low for native sites (r = 0.59). Exchangeable Ca is the best predictor for CEC for the dump soils (r = 0.83) but not for the analogue sites (r = 0.42). Exchangeable Mg is more predictive for CEC for woodland soils (r = 0.61). Total N is sufficiently predicted by OC for the native soils and accounts for 86 % of variation. The prediction increases by 6 % if silt and CEC are included into the regression equation. For the dump soils, OC accounts for 70 % of variation in total N. The juvenile nature of dump soils may be responsible for the absence of the relationships that exist for mature bush soils.
Multivariate Analysis
PCA explaining 17.7 % of the total variance contains values of positive data for sand, and negative values of water retention at wilting point (PWP), exchangeable Na, and ESP. As the effect of salinity is already partially accounted for by the first component, the second component mostly describes the influence of soil texture and water retention. Table 4 Mean values and standard error (SE) of properties for the Scotia waste dump
and native woodland soils.
Properties Waste (0-10 cm) Native 0-15 cm Native 15-30 cm
Mean SE Mean SE Mean SE
Field capacity (% v/v) 30.8 1.6 28.3 1.1 33.5 1.4
Wilting point (% v/v) 15.9 0.5 12.3 0.2 13.9 0.3
8.98 0.08 8.51 0.10 9.51 0.14
Available P (mg kg-1)
6.08 0.76 8.72 1.31 6.16 1.25
Available K (mg kg-1)
567 42 620 55 503 40
Total N (g kg-1)
1.43 0.06 1.78 0.13 1.29 0.07
Total carbon (g kg-1)
40.78 1.43 31.05 2.06 28.37 0.99
Organic carbon (g kg-1)
16.64 0.78 23.88 2.38 17.29 1.73
Ca (cmol+ kg-1)
18.49 0.39 20.17 0.36 18.55 0.34
Mg (cmol+ kg-1)
6.01 0.19 6.30 0.33 8.10 0.37
K (cmol+ kg-1)
1.00 0.08 0.99 0.07 0.89 0.05
Na (cmol+ kg-1)
2.40 0.35 1.29 0.20 2.89 0.35
Total (cmol+ kg-1)
27.90 0.51 28.76 0.59 30.42 0.57
CEC (cmol+ kg-1)
28.38 0.71 30.34 0.65 31.33 0.61
ESP (%)
8.6 1.3 4.2 0.7 9.3 1.1
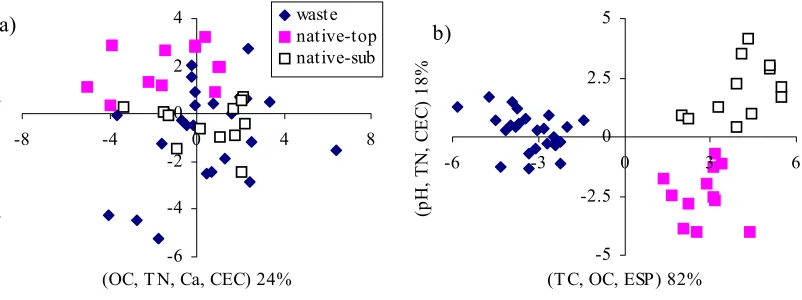
Figure 2 Simplified distribution of latent vectors for the first two components.
The dump and native topsoils could be separated along the first axis (Figure 3), although separation is diffuse for some native subsoils. The first two components only explained 41 % of total variance, and it is likely soil fertility status has a key role in discriminating between the sites.
The canonical variates analysis shows a strong separation between groups of soil samples (Figure 3). Soil fertility status, as expressed by soil carbon and nitrogen, together with exchangeable Na and gravel content accounted for 82 % of total variance along the first axis. Soils from the waste dump are separated from the woodland soils by the second (vertical) axis that indicates soil fertility attributes, while topsoils and subsoils of the native site are separated by soil fertility and salinity. Multivariate analyses identify the effects of soil salinity and the important contribution of soil carbon and nitrogen to soil variation.
Conclusion
Natural rehabilitation at the Scotia waste dump is associated with a reasonably high stability index, moderate infiltration index, and a low-moderate nutrient index in comparison to undisturbed reference sites under native forest. The low biomass production on the mine site is due to patchy growth of trees and shrubs, and is associated with heterogeneous soil fertility and salinity. Some observed differences between the waste dump and the native soils may have been due to variation in soil sampling depths. Surface crusting on the mine site appears to be responsible for patchy plant growth. This may be remediated by soil ripping to increase water infiltration.
Acknowledgments
Financial and technical support from Central Norseman Gold Corporation (CNGC) and its staff, especially Ms. Roberta Selleck made during fieldwork is greatly appreciated.
References
Anderson, K. 2001. Indicators of success in rehabilitation. Proceedings of Indicators of Ecosystem Rehabilitation Success Workshop, 16 August 2001. Centre for Land Rehabilitation UWA, Perth.
Digby, P., N. Galwey and P. Lane. 1989. Genstat 5 A Second Course. Clarendon Press, Oxford.
Doepel, J.J.G. 1973. Geological series explanatory notes Norseman WA sheet SI/51-2 scale 1:250,000. Australian Government Publishing Service, Canberra.
Leclerc, M.L., M.C. Nolin, D. Cluis and R.R. Simard. 2001. Grouping soils of the Montreal Lowlands (Quebec) according to fertility and P sorption and desorption characteristics. Canadian Journal of Soil Science 81:71-83.
McArthur, W.M. 1991. Reference Soils of South-western Australia. WA Department of Agriculture, Perth.
Rayment, G.E. and F.R. Higginson. 1992. Australian Laboratory Handbook of Soil and Water Chemical Methods. Inkata Press, Melbourne.
Swager, C.P., T.J. Griffin, W.K. Witt, S. Wyche, A.L. Ahmat, W.M. Hunter and P.J. McGoldrick. 1995. Geology of the Archaean Kalgoorlie terrane – an explanatory note. Geological Survey of Western Australia Report 48. Department of Minerals and Energy, Perth.
Tongway, D. and N. Hindley. 1995. Manual Assessment of Soil Condition of Tropical Grasslands. CSIRO Division of Wildlife and Ecology, Canberra.
Tongway, D. 1999. Assessing rehabilitation success. A training course to understand, assess and monitor the success of mine rehabilitation using Ecosystem Function Analysis indicators. Outback Ecology Environmental Management Services, Kalgoorlie.
Van Reeuwijk, L.P. 1987. Procedures for Soil Analysis. Second Edition. Technical Paper no. 9. International Soil Reference and Information Centre, Wageningen. Williams, D.J. 1997. Natural versus constructed rehabilitation of open pit mine sites