CLOUD REMOVAL OF OPTICAL IMAGE USING SAR DATA FOR ALOS
APPLICATIONS.
EXPERIMENTING ON SIMULATED ALOS DATA
Nguyen Thanh Hoan*, Ryutaro Tateishi
Centre for Environmental Remote Sensing (CEReS), Chiba University, 1-33 Yayoi-cho, Inage-ku, Chiba, 263-6522,
Japan-nthoan)@graduate.chiba-u.jp, [email protected]
Commission IV, WG IV/3
KEY WORDS: Remote Sensing, Identification, Point Cloud, Radar, Software, Orthoimage, Simulation, Integration
ABSTRACT:
Cloud is always problem of optical remote sensing data. ALOS-AVNIR2 images also will be affected. Microwave images are not affected by cloud. ALOS satellite has both optical and microwave sensor, similar resolution (~10m). Therefore, main purpose of this study is to develop a method for removing cloud in ALOS-AVNIR2 images based on ALOS-PALSAR data. This method is developed based on interpolating under cloud pixel values for ALOS-AVNIR2 images. To remove cloud, it needs to be defined. A combination method of Total Reflectance Radiance Index (TRRI) and Cloud-Soil Index (CSI) is used to define cloud. Around cloud pixels are mixture of cloud and other objects. So, that is very difficult to define. Therefore, the around cloud pixels are extended from cloud. Cloud shadow problem also is discussed in this study. Condition to apply this method is that objects in optical image and radar image change not very much. This method is experimented on simulated ALOS data from Landsat TM and JERS1-SAR images. Interpolated image is a free cloud and shadow image. Visual logic of objects is good. Original image and interpolated image is almost similar together. This method also can be applied for combination of two optical images to remove cloud if change of objects covered by cloud is not so much. Result of this study is a program with many functions like: define cloud, extend cloud, get shadow, remove cloud and so on. This is free software for every user.
1. INTRODUCTION
Cloud is always problem of optical remote sensing data. And of course, AVNIR images will be also affected. ALOS-PALSAR data is not affected by cloud. This study proposes a method to remove cloud in optical images based on interpolation from SAR data. Combination of Total Reflectance Radiance Index (TRRI) and Cloud-Soil Index (CSI) is used to define cloud. TRRI is an index developed by Prof. Nguyen Dinh Duong, VAST, Vietnam (N.T.Duong, 1998) and CSI is an index developed by the author for this study. Some other technics are used to refine cloud like remove single pixels, extend cloud and so on. Shadow of cloud is also solved by interpolating from cloud based on direction and distance from cloud to shadow (these problems will be explained in the Methodology section). Requirement of this method is that objects in ALOS-AVNIR2 and ALOS-PALSAR data are not different very much. So, this method can apply for the data in which optical image and microwave image in the same geographic place are not very far together about time. With ALOS satellite, hope that this requirement will be satisfied. This method also can be applied for removing cloud from optical images based on other optical images. In this study, some examples of removing cloud in ASTER image based on Landsat-ETM image, removing cloud in Landsat-TM image based on Landsat-TM image is also shown. This method can help to make a series of free cloud multi-temporal images for change detection studies, environmental monitoring studies and so on.
2. SIMULATED ALOS DATA
This study uses simulated ALOS data. ALOS-AVNIR2 has 4 spectral channels. Wavelength of them is close to Landsat TM. Comparison table is shown as following:
Band ALOS – AVNIR2 Landsat TM Table 1. Comparison of ALOS-AVNIR2 and Landsat-TM So, the first 4 bands of Lansat TM are used instead of ALOS-AVNIR2 image.
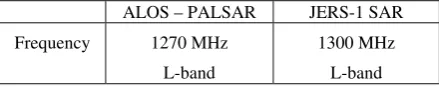
Frequency of ALOS-PALSAR is close to JERS1-SAR data as in the below table. So, JERS1-SAR data is used instead of ALOS-PALSAR data. Table 2. Comparison of ALOS-PALSAR and JERS1-SAR
In this study, Landsat TM image date 1992/10/21 and JERS1-SAR image date 1992/10/27 of Hanoi, Vietnam are used. JERS1-SAR image was resampled to 30m resolution to correspond with Landsat ETM image. It also is applied GAMMA 3X3 FILTER to reduce noises. And it was corrected about geometry by orthogonal geometric correction before using. Following figure is JERS1-SAR image after these processing:
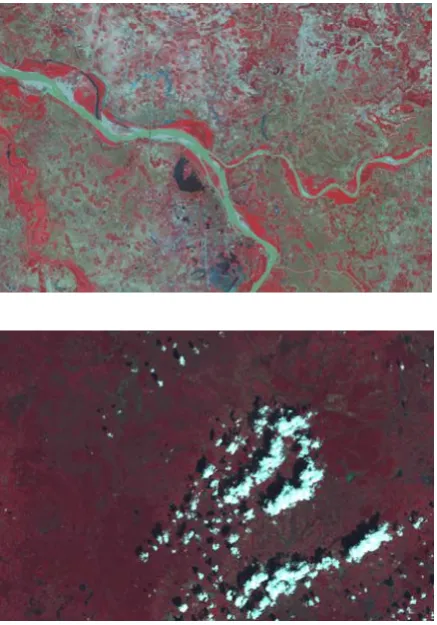
Figure 1. JERS1-SAR image 30m resolution after GAMMA 3X3 FILTER and Orthogonal Geometric Correction In the Landsat TM image, there is no cloud. Cloud was gotten from another Landsat TM image and overlay to Landsat TM image date 1992/10/21 as following figures:
Figure 2. Landsat TM image date 1992/10/21 (up) and Landsat TM image used to get cloud (down)
By this way, we have perfect data for experimenting the remove cloud method including: cloud image to test the cloud defining method, to test the interpolation method and we also have original data (under cloud data – before overlay cloud) to compare with interpolated result for validation. Following is Landsat-TM image after overlaying cloud
Figure 3. Landsat TM image date 1992/10/21 after overlaying cloud
3. METHODOLOGY
Outline of methodology is illustrated in the following figure:
Figure 4. Flow chart of methodology 3.1 Defining Cloud
Reflectance of cloud is always high from visual wave to near infrared wave. So, values of cloud will be high in all 4 bands of ALOS-AVNIR data. With thick cloud, we are very easy to define it by TRRI index. This index is defined by the following formula:
100
*
1 max 1
∫
∫
Δ
Δ
=
nn i
Where
TRRI Value of index
Ii Digital count of channel i
n Number of spectral channels
Imax Maximal digital count for given quantization level
Δ Spectral channel difference
With thin cloud, it is more difficult. It is usually mixed by some dry objects like dry sand or dry barren. As we know, in wavelength from visual to infrared, reflectance of dry barren is always going up according to growing of wavelength. And reflectance of water is always going down. Cloud includes water. So, reflectance curve of cloud will be going down and it will be low in the last band of ALOS-AVNIR2 image. The difference of thin cloud reflectance and dry soil reflectance is shown in the below chart (pixel values are gotten from Landsat
TM image). Figure 6: Cloud gotten by this method (Black)
Integrating TRRI index and CSI index can separate cloud and non-cloud quite well. This model can apply for every type of multi-spectral optical image.
Figure 5: Model for defining cloud
To define cloud, TRRI index is used to divide image to 3 parts: thick cloud, non-cloud and mixture by 2 level values (as in above figure). In the mixture part, reflectance of thin cloud in blue band (band 1) is higher than that of dry soil and reflectance of thin cloud in band 4 is lower than that of dry soil. So, thin cloud and other dry objects can be separated by Cloud -Soil Index (CSI). This index is calculated as following:
4
Result of cloud definition is shown in the figure 6. In this result, boundary of cloud is still white. That is mixture of cloud and other objects, so that is difficult to define. This problem will be solved in the section Refining Cloud.
3.2 Refining cloud
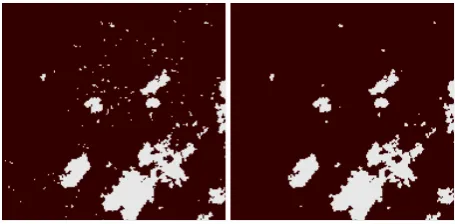
Cloud after defining still has some mistakes. Single pixels exist in some places. These pixels were estimated by visually that are some dry objects like buildings and something like that. To correct these mistakes, a program was developed to remove single pixels. After defining cloud, if result has some single pixels, this program can be used to make a better result. Result is shown in the following figure:
Figure 7: Before remove single pixel (left) and after remove single pixel (right)
The around cloud pixels are mixture of cloud and other objects. So, that is very difficult to define. In this study, the around cloud pixels are extended from cloud. An independent program was developed for this purpose. By this program, the cloud after defining can be extended to cover all real cloud. Example for this function is shown in the figure 9.
3.3 Getting shadow
Shadow is always difficult problem. Shadow of cloud on the different objects will have different values. So it is very difficult to define. In this study, shadow is interpolated from cloud. For each image, average distance from cloud to its shadow is determined. Direction of shadow is also estimated. Based on this information, a program was developed to interpolate shadow from cloud. Result is as following (black is cloud and dark-yellow is shadow):
TRRI
Level 1 Level
2
Non-Cloud Cloud
Mixture
Figure 8: Shadow of cloud is interpolated from cloud Clouds are in different height. Elevation of terrain is also different. So, distance from cloud to shadow will be not constant. In this program, average distance is used and of course it will be not a perfect distance. Interpolated shadow does not cover whole real shadow. After interpolating, shadow result will be extended to cover all real shadow of cloud. Cloud and Shadow after extension is shown in the following figure:
Figure 9: Cloud and Shadow after extension 3.4 Interpolating to Remove Cloud
To remove cloud and shadow, pixel value of cloud and shadow will be replaced by new value. This new value is interpolated from radar image. A program was developed to descript this algorithm.
With each cloud or shadow pixel in optical image, program will find the corresponsive pixel in radar image and get DN value of this pixel in the radar image. Then, program will search from the nearest pixels to farther pixels in the radar image to find a similar pixel with the centre pixel. When meet the pixel that satisfy the condition as the below formula and it is not cloud in optical image, the searching will be stopped.
a
DN
DN
abs
(
i
−
j
)
≤
Where:
a is threshold value
DNi is digital number of centre pixel
DNj is digital number of searching pixel
From DNj position, program will find in the reverse direction to
corresponsive pixel in the optical image. Then, DN value in this position will be gotten to replace for cloud pixel. Processing will be done one pixel by one pixel. This algorithm is described in the following figure:
Figure 10: Interpolation model to remove cloud Local time of ALOS satellite is 10:30 am ± 15 minutes. It means that the sun will be in the right side of image and shadow will be in the left side of image. To reduce effects of shadow, interpolation will be started from right-down pixel of each distance. This interpolation is illustrated by arrow in the figure 10. The white circle is started point of interpolation.
As we know, optical data and microwave data are very different together. The same values in microwave data do not guarantee that values in optical data will be the same. However, if the pixels are near together, likelihood of the same objects in optical data will be higher because the same objects are usually distributed in the same geographic regions. So, result image will have more information than cloud image and microwave image if using independently.
4. RESULTS AND DISCUSSIONS
4.1 On Simulated ALOS Data
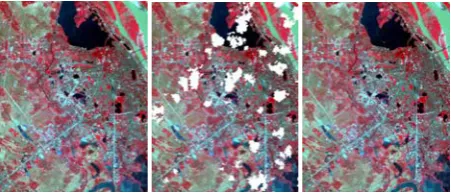
The result is free cloud and shadow image. Interpolated image is compared with the original image (before overlaid by cloud) by visually. Result almost is ok as following figure:
Figure 11: Original image (left), Cloud image (centre) and Interpolated image (right)
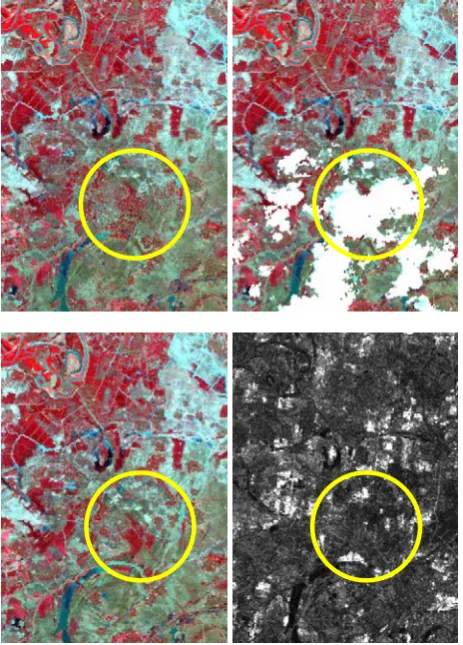
of them in interpolated image is not clear. This problem is shown in the figure 12.
Figure 12: Problem in the interpolated image (up-left), Cloud image (up-right), Original optical image (down-left) and radar
image (down-right)
This object was checked in radar image but that cannot be separated by radar image from around object. This problem may be because of radar image (reflectance is the same with around objects) or change of object (radar image and optical image are different 6 days). This checking is illustrated in the figure 12.
These objects were estimated by local farmers. That is one type of vegetable. Height of this vegetable is about 20-30cm. So, reflectance in radar image may be from ground, not from vegetable. Cause of radar image (can not separate this object by radar image) is higher probability than cause of change of object. So, interpolation of under cloud data based on radar image will be not so good at some special objects. However, by using combination of threshold level (a value) for radar image and searching the nearest pixel to interpolate cloud pixel, the result will have more information than using threshold of whole radar image and cloud optical image independently.
4.2 Cloud Removal of ASTER Image Based on Landsat ETM Image
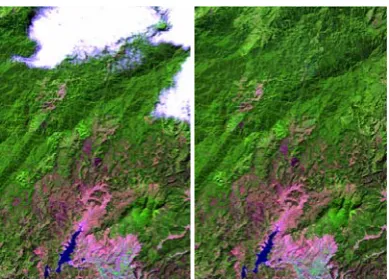
This method also can apply for combination of two optical images to remove cloud if the change of objects is not so much. By the same way, cloud was gotten from another image to overlay on ASTER image date 2001/11/16. NDVI of Landsat-ETM image date 2000/11/04 was used instead of radar image.
Interpolated image is compared with original image by visually. Result is very good. Almost there are no change between interpolated result and original ASTER image. Result is shown in the following figure:
Figure 13: Original image (left), Cloud image (centre) and Interpolated image (right) of ASTER image date 2001/11/16 By this way, many types of different optical image can combine together to remove cloud. We can make a series of free cloud multi-temporal data from many types of satellite data for studies about monitoring the change of environment and natural resource.
4.3 Combination of ETM Image and Landsat-ETM Image
Here is another application of this method. Two Landsat-ETM images date 2002/01/05 and 2001/02/03 were used. Both of them have cloud. These two images can be combined together to make two free cloud images. In this case, wavelength of two images is the same together. So, interpolation is done based on band by band. That means using band 1 to interpolate for band 1, band 2 to interpolate for band 2, band 3 to interpolated for band 3 and so on. The first, cloud part in the image date 2001/02/03 was removed based on the image date 2002/01/05. Result is shown in the following figure:
Figure 14: Cloud image (left) and result image (right) of Landsat-ETM image date 2001/02/03
By the same way, cloud part in the image date 2002/01/05 was removed based on the image date 2001/02/03. Result is shown in the following figure:
Figure 15: Cloud image (left) and result image (right) of Landsat-ETM image date 2002/01/05
Result is two free cloud images. These are really perfect results. Every object in the interpolated images looks very natural and logical. If the change of objects covered by cloud is not so much, this method is perfect way for removing cloud to make a multi-temporal dataset for one type of data or for the types of data that have similar wavelength.
CONCLUSION
Combination of TRRI index and CSI index to define cloud has good result. This method can be applied to every multi-spectral optical image to extract cloud.
Shadow interpolated from cloud will be larger than real shadow. This problem will be studied more.
Result image after removing cloud based on radar image is nine, no cloud and shadow. Distribution of objects under cloud after interpolating almost is good. However, some special objects are not so good after interpolation like some types of vegetable.
Combination of two optical images to remove cloud is good way to make free cloud multi-temporal dataset. Condition to apply this method is the change of objects that covered by cloud is not so much.
In the next step, this method will be inspected to estimate accuracy in real ALOS data.
ACKNOWLEDGMENTS
JERS1-SAR images are licensed copyright by JAXA, Japan. ALOS data for this study is provided by JAXA in the framework of ALOS program of JAXA as Principal Investigator (PI) studies. We warmly give thanks to JAXA provided JERS1-SAR images and ALOS images for this study.
REFERENCES
Nguyen Thanh Hoan, 2004. Proposing a Method to Establish Vietnam Forest Map by Using Multi-Temporal GLI Images and Ecologic Models. Proc. Japan-Vietnam Geoinformatics Consortium (GISIDEAS).
Nguyen Dinh Duong, 1998. Total Reflected Radiance Index – An Index to Support Land Cover Classification. Pro. Asian Conference on Remote Sensing (ACRS).
W.G.Rees, 2001. Physical Principles of Remote Sensing. Cambridge University, pp. 273-279.