Refer to Important disclosures in the last page of this report
Stock DataTarget price (Rp) Rp4,500
Prior TP (Rp) Rp4,500
Shareprice (Rp) Rp3,070
Upside/downside (%) +46.6
Sharesoutstanding (m) 9,936 Marketcap. (US$ m) 2,006
Sumitomo Metal Mining Co.
Ltd. 20.1%
Estimate Change; Vs. Consensus 2018F 2019F Latest EPS (USD
Cents) 0.8 1.2
PT Indo Premier Sekuritas [email protected] +62 21 5793 1170
Strong results despite challenges
Earnings grew 14.5% qoq despite unplanned maintenance in 3Q18.
Production has return to normal and would increase in 4Q18.
We maintain our price estimates and expect supply deficit in 2019.
Maintain Buy rating with 47% upside to our unchanged TP.
Strong 3Q18 earnings.
Despite unplanned maintenance in 3Q18, INCO recorded
strong earnings of US$25.8mn, up 14.5% qoq and jumped more than 12 fold yoy
(due to low base earnings in 3Q17). Sound earnings were mostly backed by
higher nickel matte average selling price (ASP) of US$11k per ton (+1.5% qoq,
+45% yoy). Net profit was recorded at US$55.2mn in 9M18 (vs. net loss of
-US$19.6mn in 9M17) which we see came in above consensus (75% of FY18F) but
inline with our earnings forecast (69%). We believe INCO would be able to book
net profit of US$25mn (flat qoq) in 4Q18F on the back of normalized production
post maintenance activities in 3Q18, allowing the company to meet our earnings
forecast of US$80mn for FY18F.
Production has return to normal.
Post the overpressure incident in INCO’s
electric furnace system in 3Q18, the management stated that production has now
returned to normal without any additional major maintenance activities in 4Q18.
INCO decided to move the planned maintenance activities earlier in 3Q18 (from
initial plan in 4Q18) as “bag house overpressure” incident in electric furnace #1
required two weeks shutdown for reparation. Bag House is equipment that
captures dust from the furnace to improve emission quality during the smelting
process which had been an effective and reliable tool for company’s operations
since its installation in 2005 and 2007.
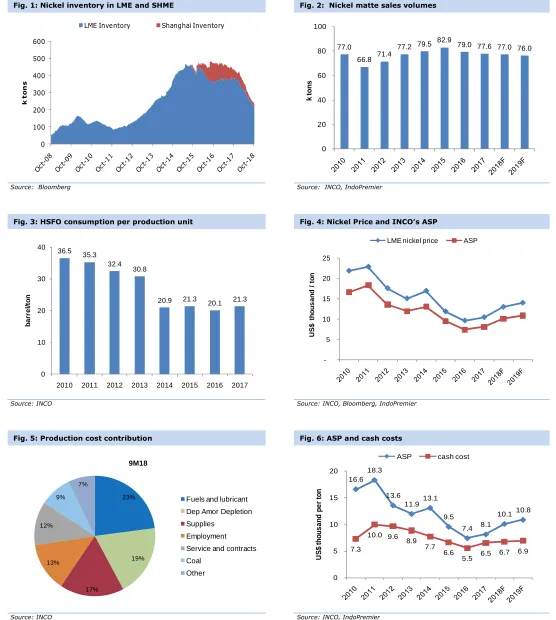
Nickel industry outlook remains positive.
We maintain our nickel price
assumption of US$13,000-US$14,000 per ton for FY18F-19F, respectively. To
note, despite nickel price volatility, YTD18 nickel price average of US$13,560 per
ton remained higher than our assumption for FY18F. We maintain our positive
view on nickel industry’s long term outlook as we share the same view with the
consensus on potential supply deficit in 2019, which will be supportive for price.
Maintain Buy with 47% potential upside.
With these inline results we
maintain our Buy recommendation for INCO with unchanged DCF-based (WACC:
12.7%; TG: 3%) target price of Rp4,500. INCO revised down its production
volumes target to 75k tons for FY18F due to the “Back-House” incident in 3Q18.
Nonetheless, without any major maintenance activities in 4Q18, production
volumes could reach 20k tons (vs. 18.2k tons in 3Q18). Thus, we believe our
earnings forecast of US$80mn for FY18F (4Q18F: US$25mn) would be achievable.
Vale Indonesia
(
INCO IJ
)
Source: INCO, IndoPremier Share Price Closing as of : 24-October-2018
2
Refer to Important disclosures in the last page of this report
Fig. 1: Nickel inventory in LME and SHME Fig. 2: Nickel matte sales volumes
Source: Bloomberg Source: INCO, IndoPremier
Fig. 3: HSFO consumption per production unit Fig. 4: Nickel Price and INCO’s ASP
Source: INCO Source: INCO, Bloomberg, IndoPremier
Fig. 5: Production cost contribution Fig. 6: ASP and cash costs
Source: INCO Source: INCO, IndoPremier
0
LME Inventory Shanghai Inventory
77.0
66.8 71.4
77.2 79.5 82.9
79.0 77.6 77.0 76.0
0
2010 2011 2012 2013 2014 2015 2016 2017
b
LME nickel price ASP
3
Refer to Important disclosures in the last page of this report
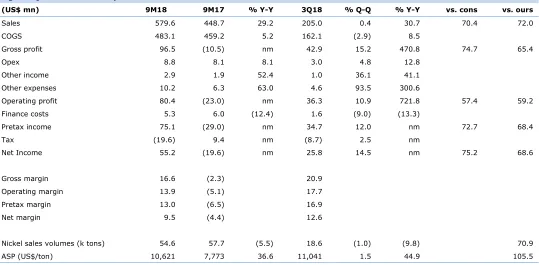
Fig. 7: 3Q18 results summary
(US$ mn) 9M18 9M17 % Y-Y 3Q18 % Q-Q % Y-Y vs. cons vs. ours
Sales 579.6 448.7 29.2 205.0 0.4 30.7 70.4 72.0
COGS 483.1 459.2 5.2 162.1 (2.9) 8.5
Gross profit 96.5 (10.5) nm 42.9 15.2 470.8 74.7 65.4
Opex 8.8 8.1 8.1 3.0 4.8 12.8
Other income 2.9 1.9 52.4 1.0 36.1 41.1
Other expenses 10.2 6.3 63.0 4.6 93.5 300.6
Operating profit 80.4 (23.0) nm 36.3 10.9 721.8 57.4 59.2
Finance costs 5.3 6.0 (12.4) 1.6 (9.0) (13.3)
Pretax income 75.1 (29.0) nm 34.7 12.0 nm 72.7 68.4
Tax (19.6) 9.4 nm (8.7) 2.5 nm
Net Income 55.2 (19.6) nm 25.8 14.5 nm 75.2 68.6
Gross margin 16.6 (2.3) 20.9
Operating margin 13.9 (5.1) 17.7
Pretax margin 13.0 (6.5) 16.9
Net margin 9.5 (4.4) 12.6
Nickel sales volumes (k tons) 54.6 57.7 (5.5) 18.6 (1.0) (9.8) 70.9
ASP (US$/ton) 10,621 7,773 36.6 11,041 1.5 44.9 105.5
4
Refer to Important disclosures in the last page of this report
Year To 31 Dec (US$Mn) 2016A 2017A 2018F 2019F 2020F
Cash & Equivalent 186 222 345 461 530
Receivable 147 166 80 88 97
Inventory 130 118 106 117 129
Other Current Assets 137 92 227 251 275
Total Current Assets 599 597 759 917 1,031
Fixed Assets - Net 1,533 1,494 1,451 1,421 1,423
Goodwill 0 0 0 0 0
Non Current Assets 94 94 88 97 106
Total Assets 2,225 2,185 2,297 2,435 2,560
ST Loans 36 37 37 37 37
Payable 64 61 0 96 106
Other Payables 31 32 27 30 33
Current Portion of LT Loans 0 0 0 0 0
Total Current Liab. 132 129 151 163 175
Long Term Loans 73 36 36 36 36
Other LT Liab. 186 200 210 220 231
Total Liabilities 391 365 397 419 443
Equity 414 414 414 414 414
Retained Earnings 1,420 1,405 1,486 1,601 1,703
Minority Interest 0 0 0 0 0
Total SHE + Minority Int. 1,835 1,819 1,900 2,016 2,117
Total Liabilities & Equity 2,225 2,185 2,297 2,435 2,560
5
Refer to Important disclosures in the last page of this report
Year to 31 Dec 2016A 2017A 2018F 2019F 2020F
Cash Flow
Net Income (Excl.Extraordinary&Min.Int) 2 (15) 80 116 145
Depr. & Amortization 121 125 113 110 108
Changes in Working Capital (116) (12) 126 (8) (9)
Others (124) 136 (9) (125) (22)
Cash Flow From Operating (116) 234 311 93 222
Capital Expenditure (59) (87) (64) (89) (119)
Others 2 3 2 3 4
Cash Flow From Investing (57) (84) (61) (86) (116)
Loans (37) (37) 0 0 0
Operating Margin (%) 3.8 (0.8) 16.9 20.9 23.4
Pre-Tax Margin (%) 0.9 (3.7) 13.6 17.8 20.3
Net Margin (%) 0.3 (2.4) 10.0 13.0 14.9
ROA (%) 0.1 (0.7) 3.6 4.9 5.8
ROE (%) 0.1 (0.8) 4.3 5.9 7.0
ROIC (%) 0.2 (0.7) 4.3 5.9 7.0
Acct. Receivables TO (days) 70.2 90.5 55.6 34.4 34.5
Acct. Receivables - Other TO (days) 0.0 0.0 0.0 0.0 0.0
Inventory TO (days) 4.7 5.0 5.9 6.2 6.0
Payable TO (days) 49.7 36.7 41.1 48.6 50.3
Acct. Payables - Other TO (days) 0.0 0.0 0.0 0.0 0.0
Debt to Equity (%) 6.0 4.0 3.8 3.6 3.4
Interest Coverage Ratio (x) 0.4 (1.0) 0.0 0.0 0.0
Net Gearing (%) (4.1) (8.2) (14.3) (19.3) (21.6)
Head Office
PT INDO PREMIER SEKURITAS
Wisma GKBI 7/F Suite 718
Jl. Jend. Sudirman No.28
Jakarta 10210 - Indonesia
p +62.21.5793.1168
f +62.21.5793.1167
INVESTMENT RATINGS
BUY : Expected total return of 10% or more within a 12-month period HOLD : Expected total return between -10% and 10% within a 12-month period SELL : Expected total return of -10% or worse within a 12-month period
ANALYSTS CERTIFICATION.
The views expressed in this research report accurately reflect the analysts personal views about any and all of the subject securities or issuers; and no part of the research analyst's compensation was, is, or will be, directly or indirectly, related to the specific recommendations or views expressed in the report.
DISCLAIMERS