QUALITY
CONTROL
OF SOIL SURVEY
1Tejoyuwono Notohadiprawiro
SUMMARY
Soil maps are supposed to be accurate and systematic represantions of geographic soil patterns. The purpose of the delineation of the mapping units on soil maps is to enable the user to predict the soil properties of the individual mapping units more precisely than those of the area as whole.Therefore, the assesment of the purity of mapping units or the predictive accurancy of soil maps is basic for the quality control of soil surveys. This can be done on the basic of the spatial variability of soil properties considered most important or of the detecting capability for soil profile types. The scale or the degree of detail of the soil map and the purpose of the production of the soil map must be taken into consideration when defining the standard of quality. The case of seruyan, Central Kalimantan, on a scale of 1:50.000 is as an example.
INTRODUCTION
Results of soil survey are used to produce soil maps which aarrre supposed to
accurate and systematic representations of geographicsoil patterns. Soil maps widee a
means for communicating the truths about soils as they exist in are, what is known about
the distribution of soil attributes in specified areas, an integrated understanding about the
influence of soil characteristics on physical, chemical and biological processes of interest
of soil users (Arnold, )
The purpose of the delineation of the mapping units on soil maps is to enable user
to predict the soil properties of the individual mapping units more precisean those of the
area as a whole (Dent & Young, 1981). Better prediction of related behaviour for mapping
units will place the user in a position to define opriate management for each unit.
Therefore, a soil map is of any value only if lifference between mapping units is
statistically significant and relevan to soil management or land use.
To achieve those goals quality control of soil survey as utmost important.
Otherwise all efforts, time and money spent will be wasted. This must always be into
consideration, in particular by developing countries, where expert yors, time and funds are
usually short.
1
PREDICTIVE ACCURACY OF SOIL MAPS
The predictive accuracy of a soil map is a measure of its quality. Quality as is not
related so much to the amount of information contained n the map, the realibility of the
information supplied by the map for the sp[esified objective map has been made for. This
mean that there is no universal standard of . as the larger the scale of a map is, the more
detailed the information it means, the more rigid the quality requirement must be.
There are also limitations to what soil surveys can do. For instance, soil alone
cannot produce accurate estimates of crop yields. It can only proformation relevant to
certain aspects of land management decisions, but it tell the user of the land what to do
(Dent & Young, 1981). Certain spatial of soils and inherent soil variability over short
distances cannot be truth produced on soil maps even on a technically largest possible
scale.
The real import of soil properties to soil quality are not the same. A
seeming-tificant variance in some properties may in fact be of little consequence to stability of the
soil for particular use, while a less conspicuos variance in other properties may be proven
to have a pronounced influence on the soil.
Economists might measure survey quality in terms of monetary benepe derived
from the application of the survey’s results to its objective. The of soil surveys is therefore
the balance beetwen quality and cost (Western, ). Thus by purre economic standards an
acceptable quality of soil maps is an of the production cooost of soil maps.
The difference among the soil attributes in controlling soil quality in relation to the
purpose of soil use, the technical constrainsts on the production of high quality soil maps,
and the economic background of acceptable values of soil maps, should be dully borne in
mind when evaluating the predictive accuracy of soil maps.
PURITY OS SOIL MAPPING UNITS
Pure in this sense has no absolute meaning. It is nation of homogenity of soil
attributes according to the differentiate af a certain class at a specific category of
classification. A pure mapping unit from the point of view of a higher category of
classification. This is because lower category classes are defined by a greater number of
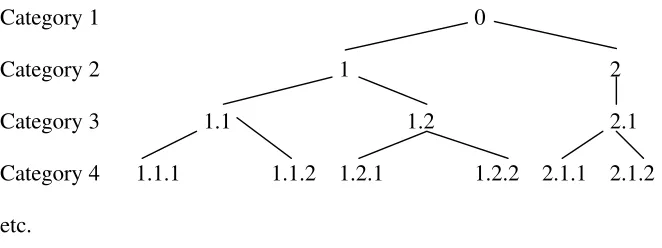
diagnostic criteria than higher category classes. This fact is illustrated in Figure 1.
Category 2 has one criterion, category 3 has two criteria, category 4 has three criteria, and
so on. Thus the determination of the purity of a mapping unit must take into account the
categorical level at which the mapping unit has been defined. In other words purity criteria
of mapping units are a function of the scale of the map.
Category 1 0
Category 2 1 2
Category 3 1.1 1.2 2.1
Category 4 1.1.1 1.1.2 1.2.1 1.2.2 2.1.1 2.1.2
etc.
Figure 1. Dichotomic classification
There is not a single soilscape anywhere which is really homogenous in every
respect. Even low category classes are defined by a certain range of characteristics. In fact,
nobody actually maps soil by units which are spesified by surface and subsurface
properties. It is not feasible to follow on the ground the actual boundary of the properties
that are only present to the subsoil. Soil mappers have to rely upon outside indikators to
demarcate soil units. They check their field assumptions by augeringgs and profile pits
which are usually widely spaced one from another (Wambeke & Forbes, 1986).
It is obvious also that the observation density cannot be increased infinitely to
record every close-distant changes in the soil properties. So there always will be inclusions
of not quite similar or even dissimilar soil bodies.
Thus due to the very nature of soils themselves, the conceptual limitations inherent
in any classification system, and the operational limitations of soil mapping to produce a
photographic image of soils,compelately pure soil mapping salts can never be optained. To
state the purity of a soil unit is a matter of deciding a allowances for the dillution of the
homogeinity of the soil unit by inclusions, which soul not be to such a degree that would
significantly affect the inferences the would draw from the soil atributes used to name the
soil unit. It implies that rity is an indication of the predictive accuracy of the soil mapping
eficiently pure map units from the point of a certain use of the map, but it has an adequate
purity when the map is used for a different purposes.
A different mapping intensity ( a different scale of mapping and/ or level of
assification), a different system of classification, and a different objective that up was
made for, require different standards of purity.
SHORT RANGE VARIABILITY OF SOIL PROPERTIES
The two sources of impurities of soil map units are the lateral aand vertical abilities
of soil properties over short distances. The variability of a single soil properti within a soil
map unit may be expressed as its coefficient of variation, which is
SD
CV (%) = --- x 100 ...(1) X
The SD is the standard deviation and X is the mean of the population of the map (Dent &
Young, 1981). The smaller the CV, the higher the purity of the particu-soil map in respect
of that single soil property. When the CVs of all class-defin-soil properties are small,
meaning the intra-unit variability is low, the map unit ... precisely deliniated when the CVs
were calculated on a number of randomized completed samples from within the map unit.
It is said accurately delimeated when calculations were done on all possible samples from
the map unit (Beckett, ...).
The intra-unit variability of a soil map unit for a given soil property may be passed
also as the ratio of the intra-unit variance to the overall variance of a map unit and it is
defined as
Variance within the map unit
RVU = --- ... (2)
Variance over the whole mapped area
... how better the map unit enable the map user the predict more precisely soil condition in
that part of the area covered by the map unit when taking the area as a whole. A smaller
RVU means a better specification of the soil by the map unit. A greater variance within the
map unit may still give a small RVU if the variance over the whole mapped area is much
greater. RVU measures the relative purity of a map unit using the average purity of
The precision or accuracy of all soil delineations within the mapped area may be
measured by the relative variance of all map unit (RVm) as given by
Combined weighted variance within map units
RVm = --- ...(3)
Variance between map units
The weighting is in proportion to the area occupied by the map units. The variance
between map units is the residual variance of the total variance over the whole mapped
area after subtraction by the combined weighted variances within map units (Young,
1976).
The predictive accuracy of a soil map is then given by
PA = 1 - RVm ...(4) A so-called perfect soil map has a RVm of 0 so that PA gives a value of 1. This is a map in
which the intra-unit variability is zero, while the intra-unit variability is significant. On the
other extreme is a useless soil map, in which the intra-unit variability is zero, while the
intra unit-variability is significant. On the other extreme is a useless soil map, in which the
intra-unit variabilityis just as large as the inter-unit variability. RVm is 1 and PA becomes 0
(Young, 1976; Dent & Young, 1981).
Beckett (1968) proposed the ration Q as a qualitative measure of the effectiveness
of soil map
(SAA) X SDa
Q = _________________ ...(5) S(AA X ASDa)
where AA, ... are the areas covered by the soil units A, ..., etc; (SAA) is the total area
covered by all soil units; SDa is the standard deviation of soil property a within the soil unit
A; S (AAXASDa) is the sum of all intra-unit standard deviation of soil property a, weighted
by the size of the area of the respective soil units.
In fact, according to Beckett (1968), equation (5) compares with 1
Q = --- ...(6) 1-r
where r is the intra-class correlation coefficient, defined as VB
ri = --- ...(7)
Where ri is the intra-class correlation coefficient of soil unit i; VB is the variance between
soil units; VW is the variance within soil units. Equation (7) is a measure of the
effectiveness of a classification (Webster, 1979).
When r is 1, the denominator in equation (6) attains a value of 0, so that Q becomes
infinite. When r is 0, Q is 1. An absolutely effective soil map has an infinite Q, while when
Q is the map is useless.
QUALITY CONTROL OF SOIL MAPS
CVs commonly differ from one soil property to another within the same map unit.
The CV of a single soil property differs from one map unit to another as itu depends on the
geographical setting of the map units. This is also true with the CVs of the soil properties
over the whole mapped area. The same situation is encountered with the variances.
To determine the purity of soil map units, or the predicitve accuracy of soil maps,
or the effectiveness of soil classifications, one is confronted with the difficult choice of the
soil property to use. One may choose to use the soil property which has the greatest
variability in order to ensure the strongest control over the quality of soil maps. But then in
many cases such a rigid control creates an impossible condition to carry on soil mapping.
Another way is to select a soil property which is known from experience to have an
average variability under the given circumstances. One may decide the quality of a soil
map by considering the CVs of a number of soil properties. This can be accomplished by
looking at the range of the CVs, or the proportion of the soil properties having CVs which
meet a predetermined permissible limit. The quality of a soil map can be judged from the
CV, RV, or any measure of variability of the most important soil property in terms of the
proposed use of the soil map. Obviously this sort of procedure will be applicable only on
special-purpose or single-property soil maps.
Experience suggest that chemical propertiees are more variable than physical
properties. As would be expected, RV decreases with increasing map scale. The change
with scale is often irregular and differs for different soil properties. For general-purpose
soil maps there is a limit to the maximum value for 1-RV, beyond which there is little or
no further improvement in PA with increase in scale. It seems possible that it occurs on
maps showing soil series at a scale of about 25,000. At this point PA is about 0.5 for
physical properties and 0.3 for chemical properties. Thus the maximum PA is of the order
Rough estimates of the relationships between PA, scale and survey method have
been shown graphically by Beckett (1968), Young (1976) and Dent & Young (1981). By
interpretation of satelite imagery the ceiling of PA at about 35% may be reached at scales
of around 1:1,000,000. PA levels off at about 55% at scales between 1:1,000,000 and
1:250,000 by use of general purpose survey mainly based on air photo interpretation of
physiographic survey. At these small scales general purpose air photo interpretation yields
at the highest PA. The ceiling of PA at about 75% is possibly obtained by use of general
purpose free survey, combining air photo interpretation with substantial and systematic
field coverage, in the scale range 1:50,000 to 1:10,000. This is also the best PA that can be
obtained at medium scales. At large scales of more tahn 1:10,000 the highest PA of close
to 90% may be obtained by special purpose grid survey.
Thus in terms of PA, the geographical approach (delineation by terrain analysis of
land systems, lanform, etc.) should be recommended for soil survey and mapping. For
large scale mapping the best technique to be applied is parametrical mapping on a grid
pattern.
In the Netherlands a minimum purity of map units of 70% is stipulated. In Britain it
is 80%. In the USA the expected minimum is 85%, except for irrigable land where the
suggested lower limit is 75, 90, and 97% at scales of 1:24,000, 1:12,000, and 1:4,800
respectively (Western, 1978).
Ogunkunle (1986) found in an experimental field for oil palms in southern Nigeria
an average purity of 70% for an Ultisol’s series mapping unit. But since the class
differentiae were properties many of which do not have direct relationship with crop
growth, the purity did not reflect the evidently high degree of short-range variability in the
soil fertility determining chemical properties. As the soil map used for Ogunkule’s study
was a general purpose one at 1:8,000 scale, one may tend to conclude that the purity of the
soil delineations on general purpose maps has little practical meaning, however detailed
the delineations are.
Ross et al. (1987) noted that recent publications on soil variability have shown the
occurrence of large variations even whithin relatively simple map units. The reported
variabilities, expressed as CV values, were 30-45 % for organic carbon, 25 % for clay,
aand 17-48 % for CEC. Their study in Canada on a simple map unit dominated by a soil
series which is a member of the Orthic humic Gleisol subgroup indicated that a soil
suggest also that the intra-unit variability will be less if the delineation was accomplisshed
on the basis of the pedogenetic environment.
The variability of a group of soil variable is the consequence of the variability of
their common state variables. Therefore, quality control of soil maps can be achieved more
effectively if it is pointed to state variables. For example, soil structure is the state is the
state variable variable of soil porosity, permeability, hydraulic conductivity, and
consistence. In natural or less intensive used soils, organic matter is the state variable total
nitrogen, total sulphur, and to a notable extent also of phosphorus. As a matter of fact, over
98 % of N, 60 – 95 % of S and 25 – 60 % of P are in organic combination (Schroeder,
1984).
SURVEY QUALITY
estern (1978) recognizes two methods of measuring survey quality. One is abelled
“implicit” and the other “explicit”. The first estimation assumes survey to be adequately by
the expertise of the surveyor and the methods and controls he chooses to adopt. The second
estimation uses quantitative standards to measure survey quality.
The explicit methods considers survey quality to consists of four basic elements,
viz. relevance, reliability, presentation and aplication. Their relative importance varies
according to the type and aim of survey. In general purposes surveys relevance is much
less critical than in special purpose surveys. Large scale surveys emphasize more on
reliability than small scale surveys. Presentation becomes vital if the report has to be
communicated to people without previous training in reading soil data, but posses political
power to decide on land use. Aplication denotes that proper application of the survey by
the user. This may need the participation of the surveyors (producer) in the actual use of
his findings. In low intensity, general purpose surveys application is not a user will be
another surveyor or a fellow pedologist who doesn´t need any expertise assistance in
making proper use of surveys. In high intensity, special purpose surveys, however, the user
usually belongs to a completely different professional field, like agribusiness, engineering,
economics, etc. In such acase, when the surveyor and the user have the oportunity to work
together there is a much better situato\ion for proper application of the survey.
A strong relevance means the survey is highly relevant to the defined objectives of
surveys. Relevance needs a simple and clearly expressed system of soil classification,
capable of defining soil units of practically homogeneous development potential.
Reliability is concerned with what the survey has achieved in term of acceptable
level of mapping accuracy. Thus it expresses the purity of soil map units and the predictive
accuracy of soil maps. It measures the scientific quality of soil surveya.
Presentation measures the functional or informative quality, while application is a
measure of the utility quality of soil surveys.
To quantity survey quality Western (1978) proposes the following :
1. Asses the relative importance of each element of survey quality to the success of the
survey by scoring as a percentage of the total score of 100 %.
2. Estimate the actual achievement by element separately by proportional scoring to the
corresponding posibble maximum score as set in point (1).
3. If Rv, Rb, P and A symbolize relevance, reliability, presentation and application,
respectively, then
actual (Rv x Rb x P x A)
Final score % = ... (8) maximum (Rv x Rv x P x A)
4. Grading of survey quality by final score :
Over 60 % - excellent
40 – 60 % - good
20 – 40 % - moderate
10 – 20 % - poor
below 10 % - extremely poor
The assesment of the relative importance of each element of survey quality is a
matter of agreement between the instigator, user, and surveyor. In many cases the
instigator is also the user, which is especially true in private projects. In public projects in
Indonesia the instigstor may be BAPPENAS, the user may be one of the ministries of
goverment, and the surveyor may be one of the universities.
Multiplying tgether, and not a straightforward summation of, element scores is to
bring out more realistically the associative relatonship between elements. By this way the
lowest score giveen to thae leassst satisfactory element will be clearly reflected in the final
another elementsas woulllld rather be suggested by summatiioon oof scores. It is analogous
with the wellknown “low of the minimum “ of Leibig for plant nutrition.
Western (1978 ) presented typical scores of relative importance of survey quality
elements fir a special purpose survey : relevance 35 % , reliability 35 %, presentation 10 %
, and application 20 %.
THE SERUYAN EXAMPLE
Measuring the purity of soil mapping units by statistical inference of individual soil
properties is difficult, if not possible. Each soil property in its spatial variability, so that
purity assessmant will show a strong personal bias. In addition soil mapping units are
almost invariably delineations of polypedons, except on single value soil maps for
specified engineering purposes.
Therefore, it will be much mmmmore approriate to asses the purity of soil mapping
units by profile types. Profile types are expressions of polypedons, representing the
assesce of soils as natural bodies.
This example is presented here tio illustrate tthe few attempts ever been made in
Indonesia to assess the quality of soil surveys. The Seruyan Area in Central Kalimamntan
is one of the many areas allocated for transmigration settlements. The soil was mapped
using special piurpose grid surveeey at a 1 : 50,000 scale.
There were 14 soil profile types according to three kinds of constituting material,
viz, sand , non - sand (slit and / or clay ) and peat, and the untra-solum order of position of
the three different material. Soil profile descriptions covered the normal depth of
observation of about 125 cm. The 14 pofiles were pprofiles were assemblled into 13 map
units on the basis of the consociaative assemblage or the recurrennt pattern of the spatial
distribution of soil profiles.
If P denotes sand, L non-sand and G peat material, the 14 profile types could be
symbolized as follows: L (entirellllly of non- sand material ), L (peat over non sand ),
G-L-P (interbedded non – sand between peat and sand ), L- P (non-sand over sand ), G-L-P-L
(interbedded sand between non-sand), G-L (interbedded between peat and non-sand),
P-L (sand over non-sand), P (entirely sand), G-P (peat over sand), G-P-G (interbedded sand
between peat), L-G-L (interbedded peat between non-sand), G (purely peat), G-L-G
further subdivided according to degree of decomposition (fibric, hemic, sapric). L was
further separated into a hydric, sulfidic, and non-hydric non-sulfidic variants.
The different map units were distinguished by four attributes : (1) the dominant
profile type, (2) the profile which is a variant of the dominant profile type, (3) the profile
type belonging to a different class than the dominant one, and (4) inpurities or inclusions.